. 2022 Feb 24;139(8):1222-1233.
doi: 10.1182/blood.2021013422.

Resolvin T-series reduce neutrophil extracellular traps

Affiliations

Resolvin T-series reduce neutrophil extracellular traps

Nan Chiang et al. Blood. .

Abstract

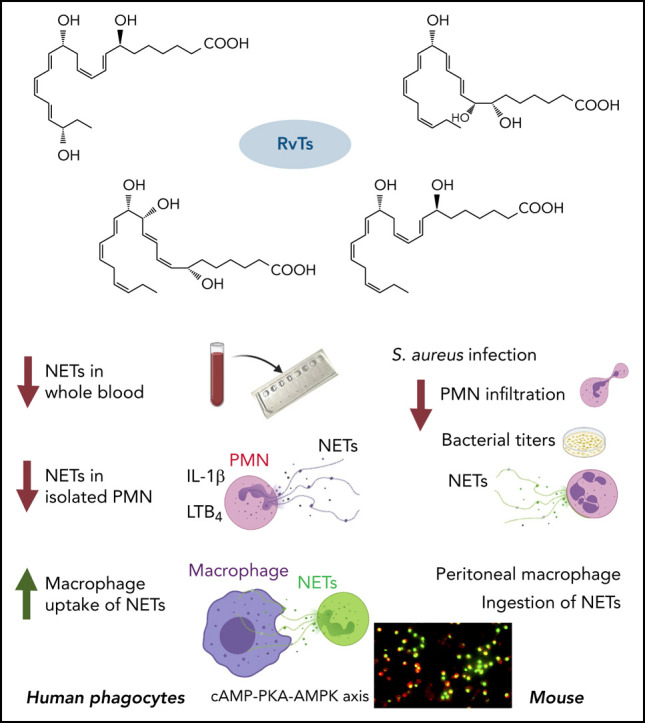
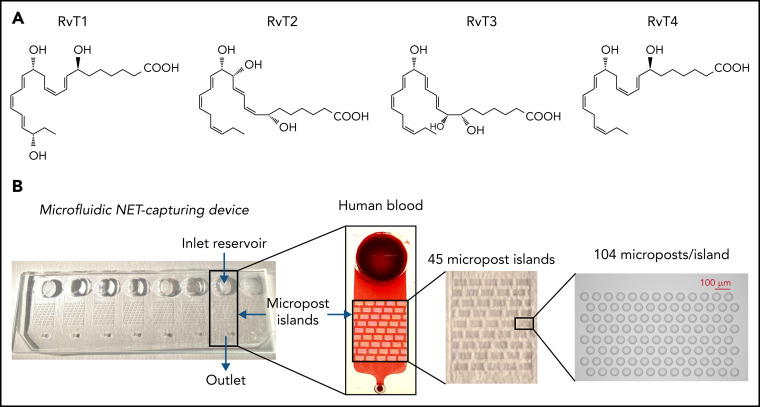
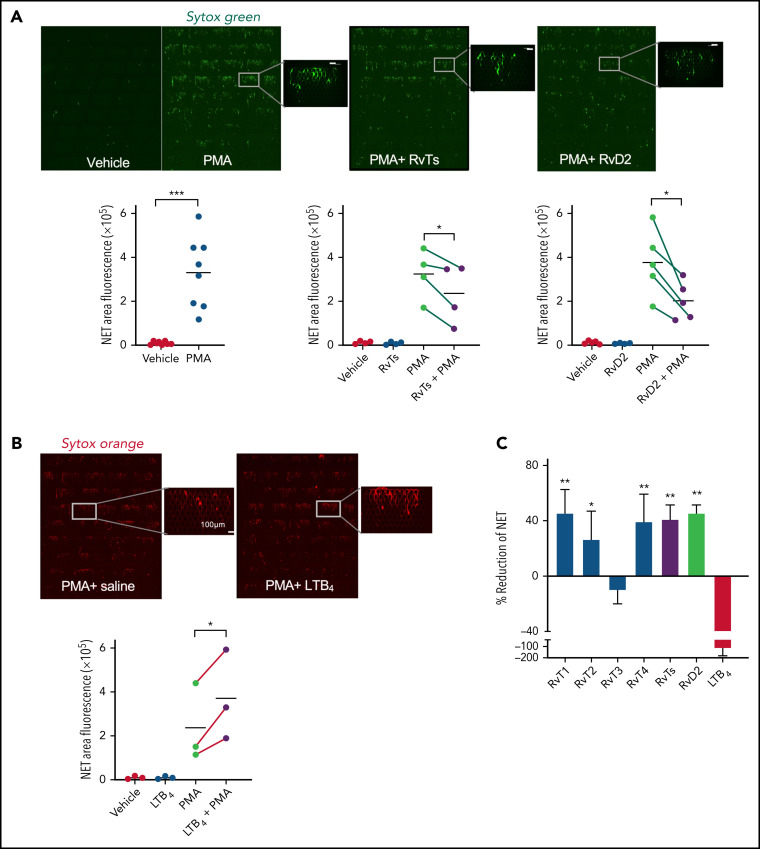
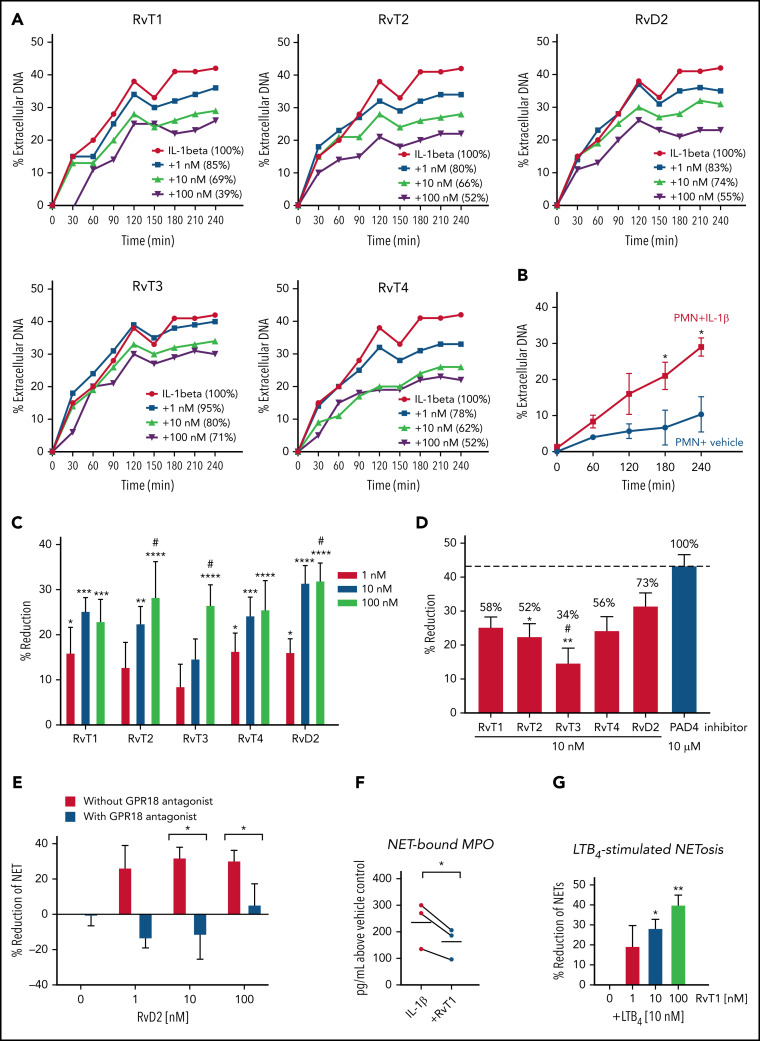
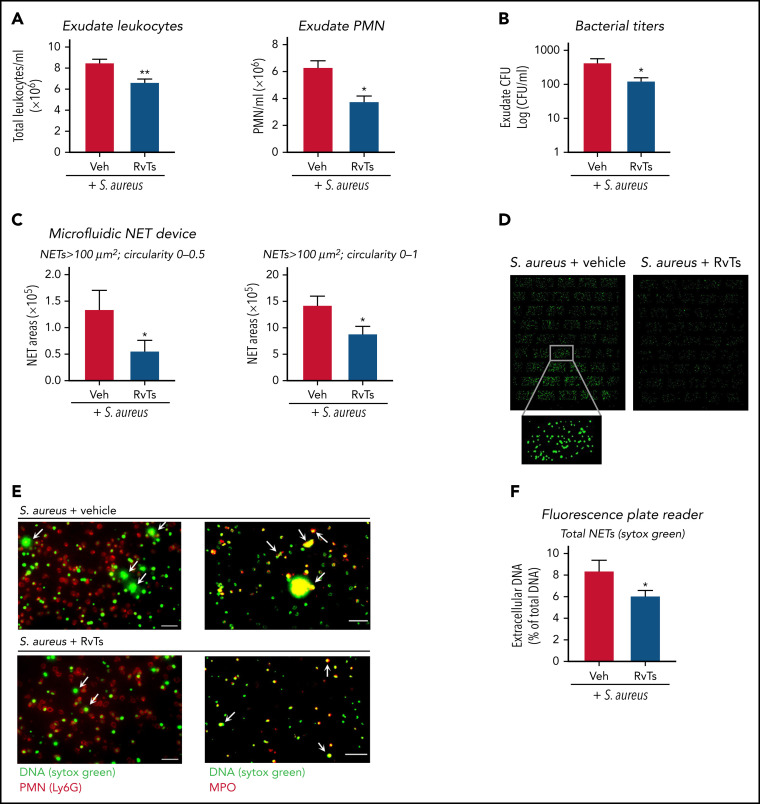
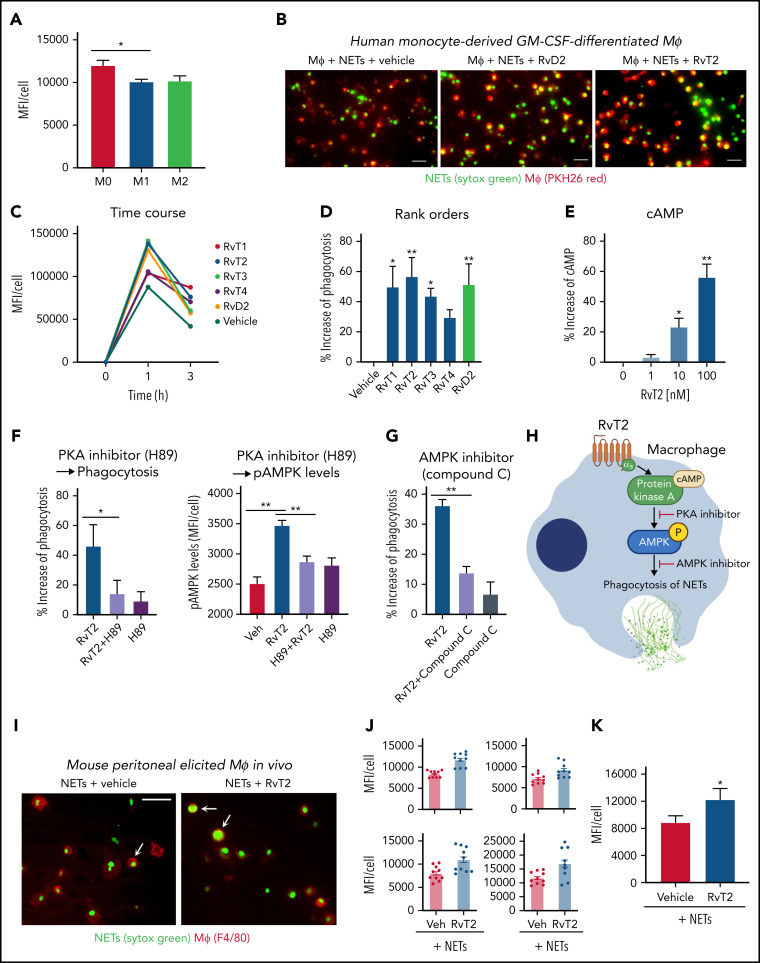
The newly identified 13-series (T-series) resolvins (RvTs) regulate phagocyte functions and accelerate resolution of infectious inflammation. Because severe acute respiratory syndrome coronavirus 2 elicits uncontrolled inflammation involving neutrophil extracellular traps (NETs), we tested whether stereochemically defined RvTs regulate NET formation. Using microfluidic devices capturing NETs in phorbol 12-myristate 13-acetate-stimulated human whole blood, the RvTs (RvT1-RvT4; 2.5 nM each) potently reduced NETs. With interleukin-1β-stimulated human neutrophils, each RvT dose and time dependently decreased NETosis, conveying ∼50% potencies at 10 nM, compared with a known NETosis inhibitor (10 μM). In a murine Staphylococcus aureus infection, RvTs (50 ng each) limited neutrophil infiltration, bacterial titers, and NETs. In addition, each RvT enhanced NET uptake by human macrophages; RvT2 was the most potent of the four RvTs, giving a >50% increase in NET-phagocytosis. As part of the intracellular signaling mechanism, RvT2 increased cyclic adenosine monophosphate and phospho-AMP-activated protein kinase (AMPK) within human macrophages, and RvT2-stimulated NET uptake was abolished by protein kinase A and AMPK inhibition. RvT2 also stimulated NET clearance by mouse macrophages in vivo. Together, these results provide evidence for novel pro-resolving functions of RvTs, namely reducing NETosis and enhancing macrophage NET clearance via a cyclic adenosine monophosphate-protein kinase A-AMPK axis. Thus, RvTs open opportunities for regulating NET-mediated collateral tissue damage during infection as well as monitoring NETs.


Figures

None
Graphical abstract
Figure 1
Figure 1
The microfluidic device for trapping NETs in human blood. (A) Structures of RvTs used in these experiments. RvT1: 7S,13R,20S-trihydroxy-8E,10Z,14E,16Z,18E-docosapentaenoic acid; RvT2: 7S,12R,13S-trihydroxy-8Z,10E,14E,16Z,19Z-docosapentaenoic acid; RvT3: 7S,8R,13S-trihydroxy-9E,11E,14E,16Z,19Z-docosapentaenoic acid; and RvT4: 7S,13R- dihydroxy-8E,10Z,14E,16Z,19Z-docosapentaenoic acid. (B) Overview of the microfluidic NET-capturing device. Each device consists of an inlet reservoir (for loading samples [eg, human blood]), micropost islands (for capturing NETs), and an outlet connected via Tygon Tubing to a syringe pump; flow rate was set at 10 µL/min with a target volume of 50 µL. The scheme illustrates a device in the absence or presence of human blood. Each device contains 45 micropost islands, and each island is formed by an array of 104 microposts.
Figure 2
Figure 2
RvTs reduce NETs in human peripheral blood. Human blood (500 μL) was incubated with RvT1, RvT2, RvT3, and RvT4 (10 nM each) individually, or with a combination of RvTs (RvT1-RvT4; 2.5 nM each), RvD2 (10 nM), LTB4 (10 nM), or vehicle control (0.01% ethanol v/v in saline) at 37°C for 15 minutes followed by the addition of PMA (1 μg/mL) for 4 hours. Aliquots of blood (50 μL) were added to Sytox Green (450 μL) and loaded onto the inlet reservoirs of the microfluidic NET devices. NETs captured within the micropost arrays were then imaged and quantified. (A) (Top panels) Representative images of fluorescent NETs using Sytox Green. Scale bars = 100 μm. (Bottom panels) Results are expressed as NET areas. The NET areas of PMA and PMA plus RvTs or RvD2 obtained from the same donors are connected by green lines. n = 4 (RvTs) or n = 5 (RvDs) separate donors. *P < .05, ***P < .001, paired two-tailed Student t test. (B) (Top panels) Representative images of fluorescent NETs using Sytox Orange. Scale bars = 100 μm. (Bottom panel) The NET areas of PMA and PMA plus LTB4 obtained from the same donors are connected by red lines. n = 3 separate donors. *P < .05, paired two-tailed Student t test. Details on imaging and quantification are given in the “Materials and methods”. (C) Results are percent reduction of NETs compared with PMA alone. Mean ± SEM. n = 3 to 5. *P < .05, **P < .01, vs LTB4.
Figure 3
Figure 3
RvTs reduce NETs with isolated human PMNs. Freshly isolated human PMNs were incubated with test compounds RvT1, RvT2, RvT3, RvT4, and RvD2 (1-100 nM) or vehicle control (0.01% ethanol v/v) at 37°C for 15 minutes, followed by the addition of IL-1β (50 ng/mL) with Sytox Green (5 µM). Fluorescence was monitored from 0 to 4 hours. (A-B) Dose response and time course of NETosis. The fluorescence of extracellular DNA in the presence of IL-1β alone was taken as 100%. The percentages of extracellular DNA in the presence of test compounds (1-100 nM) at 4 hours are indicated in parentheses. (A) One representative from 7 separate donors. (B) Mean ± SEM. n = 3 separate donors. *P < .05, vs PMN + vehicle. (C) Dose response of each RvT and RvD2. Results are expressed as percent reduction compared with IL-1β alone at 4 hours. Mean ± SEM. n = 7 separate donors. *P < .05, **P < .01, ***P < .001, ****P < .0001, vs 0 nM; #P < .05, vs 1 nM (two-way analysis of variance with Tukey's multiple comparisons). (D) Comparison of SPMs (10 nM) and a PAD4 inhibitor (10 μM). Numbers shown on top of each bar are percentages compared with the PAD4 inhibitor that was taken as 100%. Mean ± SEM. n = 7 (SPMs) or n = 3 (inhibitor) separate donors. *P < .05, **P < .01, vs PAD4 inhibitor; #P < .05, vs RvD2 (one-way analysis of variance with Tukey's multiple comparisons). (E) GPR18-dependent RvD2 action. PMNs were incubated with a GPR18 antagonist. O-1918 (20 μM) for 10 minutes before the addition of RvD1 (1-100 nM) and/or IL-1β. Mean ± SEM. n = 3 separate donors. *P < .05, two-tailed Student t test. (F) MPO levels. PMNs were incubated with RvT1 (10 nM) or vehicle control at 37°C for 15 minutes, followed by the addition of IL-1β (50 ng/mL) for 4 hours. DNA (NET)-bound MPO was determined. MPO levels from the same donors are connected by black lines. n = 3 separate donors. *P < .05. (G) LTB4-stimulated NETosis. PMNs were incubated with RvT1 (1-100 nM) or vehicle control at 37°C for 15 minutes, followed by the addition of LTB4 (10 nM) with Sytox Green (5 µM). Fluorescence was monitored at 4 hours. Mean ± SEM. n = 3 separate donors. *P < .05, **P < .01, vs LTB4 alone and LTB4 + 1 nM RvT1.
Figure 4
Figure 4
RvTs limit S aureus infection and reduce NETs in vivo. Mice were given a panel of RvTs (RvT1, RvT2, RvT3, and RvT4; 50 ng each) or vehicle control together with live S aureus (107 CFU) by intra-pouch injection. Sixteen hours later, pouch exudates were collected. (A) Exudate leukocytes were enumerated by using light microscopy and PMN percentages determined by differential counting. Mean ± SEM. n = 7 (leukocytes) or n = 4 (PMNs). *P < .05, **P < .01, two-tailed Student t test. (B) Exudate bacterial titers were determined by enumerating colonies on LB agar plates. Mean ± SEM. n = 6. *P < .05, two-tailed Student t test. (C) NETs were quantified by using the microfluidic NET devices. Exudate cells (2 × 10⁵ cells) were incubated with Sytox Green (5 µM) for 15 minutes and loaded onto the microfluidic NET device. NETs were quantified according to 2 criteria: (left) long-string NETs > 100 μm2 (fluorescent areas larger than 100 μm2 in size with a shape circularity 0-0.5) or (right) NETs > 100 μm2 (fluorescent areas larger than 100 μm2 in size with shape circularity 0-1). Mean ± SEM. n = 5 or 6. *P < .05, two-tailed Student t test. (D) Representative images of NETs > 100 μm2 and shape circularity 0-1. (E) Representative images. Exudate cells (2 × 10⁵ cells) were adhered onto 8-well chamber slides, incubated with Sytox Green (5 µM), followed by staining with (left panels) phycoerythrin-conjugated anti-Ly6G antibody for mouse PMN or (right panels) goat anti-mouse MPO antibody. Arrows denote NETs. Scale bars = 50 μm. (F) NETs were quantified by using a fluorescence plate reader. Exudate cells (1 × 10⁵ cells) were adhered onto a 96-well plate, incubated with Sytox Green (5 µM) for 20 minutes, and fluorescence determined. Mean ± SEM. n = 7. *P < .05, two-tailed Student t test. Veh, vehicle control.
Figure 5
Figure 5
RvTs enhance MΦ ingestion of NET in vitro and in vivo. (A-D) Human MΦs were plated onto 8-well chamber slides (1 × 10⁵ cells per well). Test compounds (RvT1-RvT4, RvD2; 10 nM) or vehicle controls were added to MΦs for 15 minutes, followed by the addition of Sytox Green–labeled NETs for 1 hour. NETs from ∼1 × 10⁶ PMNs (∼10 μg DNA) were added to 1 × 10⁵ MΦs per well. (A) Mean fluorescence intensity (MFI) per cell with M0-MΦ, M1-MΦ, and M2-MΦ. Mean ± SEM. n = 3 separate donors. *P < .05. (B) Representative images of M0-MΦs (PKH26 Red) with ingested Sytox Green–labeled NETs. Scale bars = 50 μm. (C-D) An average of ∼300 MΦs were quantified in each condition for each donor. (C) Time course of MFI per MΦ: a representative donor from n = 4 separate donors. (D) Results are percent increase of MFI/MΦ compared with MΦ + NET + vehicle. Mean ± SEM. n = 8 separate donors. *P < .05, **P < .01, one-way analysis of variance with Tukey's multiple comparisons. (E) cAMP. Human M0-MΦs (1 × 10⁵/0.2 mL) were incubated with RvT2 (0-100 nM) for 15 minutes. MΦs were lysed and cAMP levels determined. Results are percent increase above vehicle. Mean ± SEM. n = 3. *P < .05, **P < .01, vs vehicle. (F-G) Human M0-MΦs (1 × 10⁵ cells/well in 8-well chamber slides) were incubated with RvT2 (10 nM), a PKA inhibitor (H89, 3 μM, 24 hours), the AMPK inhibitor (Compound C, 500 nM, 4 hours), or vehicle controls for 15 minutes, followed by the addition of Sytox Green–labeled NETs for 1 hour. MΦ ingestion of NETs was quantified according to Sytox Green intensities and pAMPK levels quantified according to immunofluorescence with an anti–phospho-AMPK (pAMPK) antibody. Mean ± SEM. n = 5 (phagocytosis) or n = 3 (pAMPK levels) separate donors. *P < .05, **P < .01. (H) Proposed RvT2-cAMP-PKA-AMPK axis in stimulating MΦ phagocytosis of NETs. (I-K) Mice were given zymosan (1 mg/mL, IP) for 72 hours, followed by RvT2 (100 ng/mL per mouse, IP) or vehicle (0.05% ethanol) for 15 minutes, and fluorescent-labeled NETs (∼100 μg/mL DNA from ∼10 × 106 PMN) for 60 minutes. Exudate cells (2 × 10⁵ cells) were adhered onto 8-well chamber slides for imaging and quantification. An average of ∼780 MΦs was quantified per condition per mouse. (I) Representative images of MΦs (red: F4/80) with ingested Sytox Green–labeled NETs, denoted by arrows. Scale bars = 50 μm. (J) Four independent experiments and 4 mice each group. In each experiment, 10 fields (20×) per mouse were imaged and quantified. (K) Mean ± SEM from n = 4. *P < .05, two-tailed paired Student t test. GM-CSF, granulocyte-macrophage colony-stimulating factor; Veh, vehicle control.

Comment in

References

    1. Serhan CN, Savill J. Resolution of inflammation: the beginning programs the end. Nat Immunol. 2005;6(12):1191–1197. - PubMed
    1. Buckley CD, Gilroy DW, Serhan CN. Proresolving lipid mediators and mechanisms in the resolution of acute inflammation. Immunity. 2014;40(3):315–327. - PMC - PubMed
    1. Perretti M, Cooper D, Dalli J, Norling LV. Immune resolution mechanisms in inflammatory arthritis. Nat Rev Rheumatol. 2017;13(2):87–99. - PubMed
    1. Buchheit T, Huh Y, Maixner W, Cheng J, Ji RR. Neuroimmune modulation of pain and regenerative pain medicine. J Clin Invest. 2020;130(5):2164–2176. - PMC - PubMed
    1. Van Dyke TE. Pro-resolving mediators in the regulation of periodontal disease. Mol Aspects Med. 2017;58:21–36. - PMC - PubMed

Publication types