. 2021 Nov 23;22(1):561.
doi: 10.1186/s12859-021-04471-3.

Spliceator: multi-species splice site prediction using convolutional neural networks

Affiliations

Spliceator: multi-species splice site prediction using convolutional neural networks

Nicolas Scalzitti et al. BMC Bioinformatics. .

Abstract

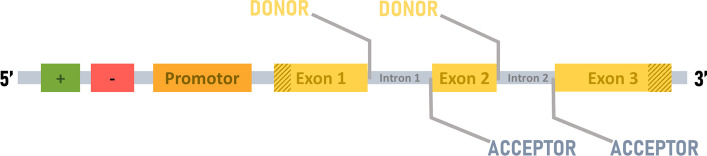
Background: Ab initio prediction of splice sites is an essential step in eukaryotic genome annotation. Recent predictors have exploited Deep Learning algorithms and reliable gene structures from model organisms. However, Deep Learning methods for non-model organisms are lacking.

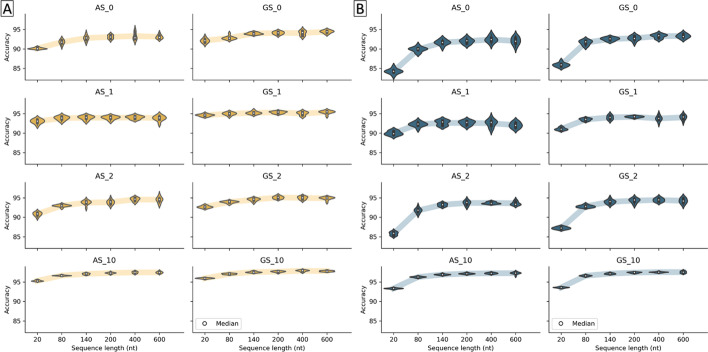
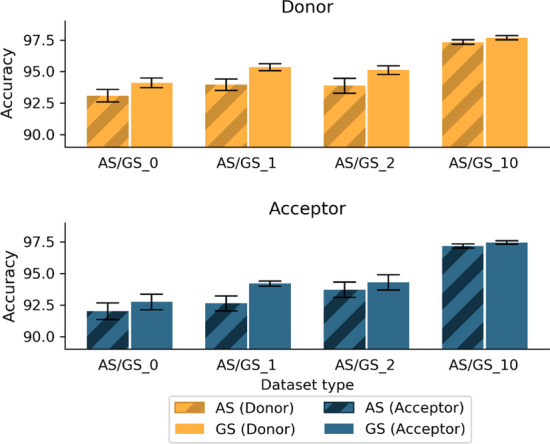
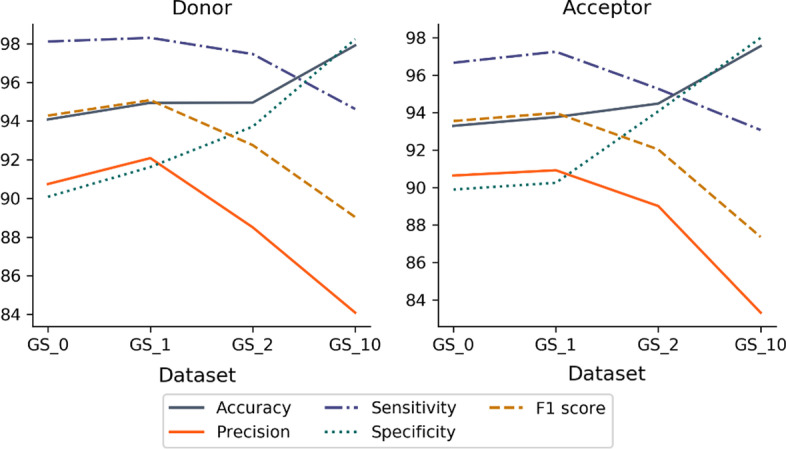
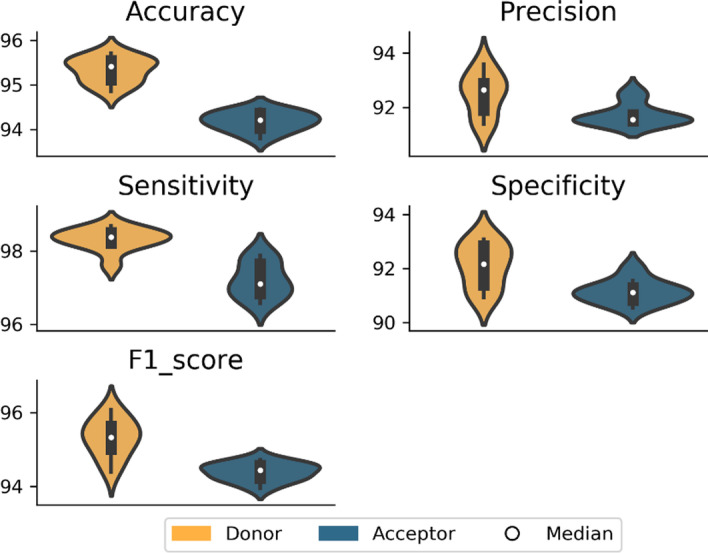
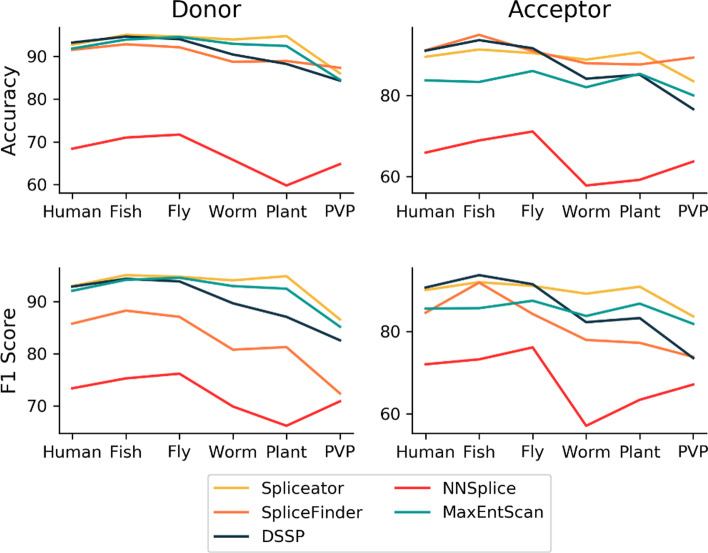
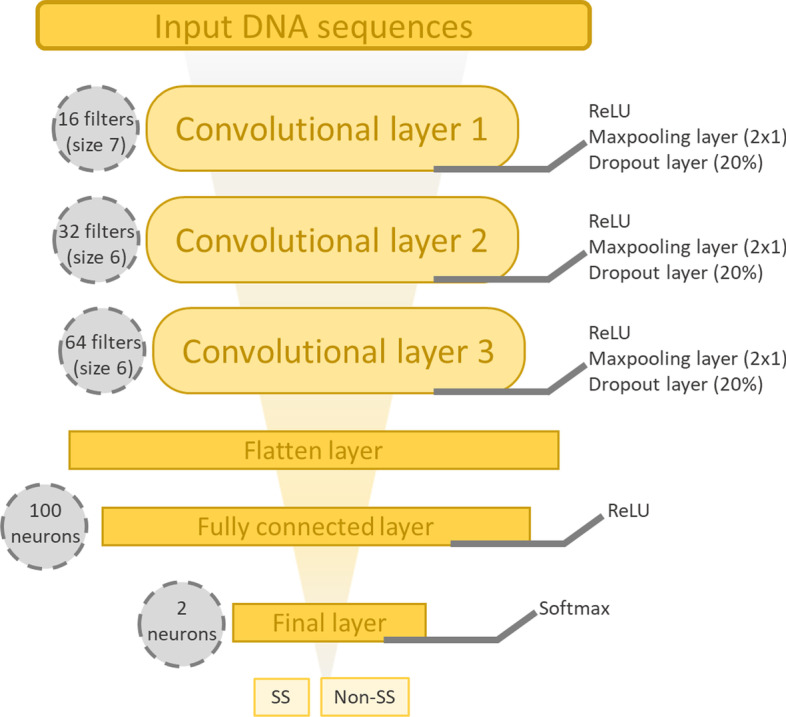
Results: We developed Spliceator to predict splice sites in a wide range of species, including model and non-model organisms. Spliceator uses a convolutional neural network and is trained on carefully validated data from over 100 organisms. We show that Spliceator achieves consistently high accuracy (89-92%) compared to existing methods on independent benchmarks from human, fish, fly, worm, plant and protist organisms.

Conclusions: Spliceator is a new Deep Learning method trained on high-quality data, which can be used to predict splice sites in diverse organisms, ranging from human to protists, with consistently high accuracy.

Keywords: Convolutional neural network; Data quality; Deep learning; Genome annotation; Splice site prediction.


Conflict of interest statement

JDT is a member of the editorial board (Associate Editor) of this journal. The authors declare they have no other competing interests.

Figures

Fig. 1
Fig. 1
Typical architecture of a eukaryotic protein-coding gene. Green (enhancer) and red (silencer) boxes represent the regulatory elements. The mosaic of exons (labelled yellow boxes) and introns (labelled grey boxes) is usually preceded by a promotor (orange box). The brown diagonal stripes represent the untranslated regions (UTR). The boundaries between exons and introns are called donor splice sites and between introns and exons are acceptor splice sites
Fig. 2
Fig. 2
Prediction accuracy according to input sequence length for each dataset (AS: All Sequences and GS: Gold Standard) for A donor and B acceptor SS
Fig. 3
Fig. 3
Average prediction accuracy for donor and acceptor SS, using the AS and GS datasets (AS/GS_0 = positive/negative ratio of 1:1 with only FP sequences in negative subset; AS/GS_1 = positive/negative ratio of 1:1 with exon, intron and FP sequences; AS/GS_2 = positive/negative ratio of 1:2 with only FP sequences in negative subset; AS/GS_10 = positive/negative ratio of 1:10 with only FP sequences in negative subset). Standard deviations are indicated by black bars
Fig. 4
Fig. 4
Average values of the 5 performance metrics (accuracy, precision, sensitivity, specificity and F1 score) for each dataset composition and for each type of SS (donor or acceptor). GS_0 = positive/negative ratio of 1:1 with only FP sequences in negative subset, GS_1 = positive/negative ratio of 1:1 with exon, intron and FP sequences in negative subset, GS_2 = positive/negative ratio of 1:2 and GS_10 = positive/negative ratio of 1:10
Fig. 5
Fig. 5
Performance of optimized model (GS_1 dataset, positive/negative ratio of 1:1 with heterogeneous negative examples and input sequence length = 200 nt) averaged over 10 experiments
Fig. 6
Fig. 6
Average heatmap of the two classes, non-Splice Site and Splice Site, for donor and acceptor SS, with colors ranging from yellow (very important nucleotide position) to dark blue (not important position). The dinucleotide characterizing the SS is located at positions 101–102 for the donor and acceptor SS
Fig. 7
Fig. 7
Accuracy and F1 score for each program and for each independent benchmark representing diverse organisms
Fig. 8
Fig. 8
Overview of the construction of the training and test sets. A DNA sequences and exon maps are recovered for each G3PO+ gene. B The AS (All Sequences) positive subset includes the SS of all G3PO+ ‘Confirmed’ and ‘Unconfirmed’ sequences. The GS (Gold Standard) positive subset includes only the SS of the ‘Confirmed’ sequences. Ten negative AS subsets and ten negative GS subsets are then constructed by random sampling of the exon, intron and FP regions of the corresponding genomic sequences. C Four AS and four GS datasets are then constructed with different ratios of positive and negative SS (described in Table 4). D Finally, the training and test sets are formed by shuffling the positive and negative sequences (10 times for each AS and GS dataset)
Fig. 9
Fig. 9
Number of canonical (bar) and non-canonical (n-c) (line) sequences for each positive subset (AS and GS) and for each sequence length
Fig. 10
Fig. 10
Sequence logos for canonical and non-canonical SS for each SS type (donor or acceptor) and each positive subset (AS and GS)
Fig. 11
Fig. 11
Average number of positive and negative sequences in training and test sets, for all AS and GS datasets, according to SS type. Standard deviations are indicated by black bars
Fig. 12
Fig. 12
Data pre-processing. Input sequences are converted in one-hot encoding. The result is a 1D vector of size W, where W is the length of the input sequences, with 4 channels
Fig. 13
Fig. 13
Representation of the CNN architecture. The architecture is composed of 2 convolutional layers, each followed by a dropout step and maxpooling layer. Then, a flatten layer is added to flatten the input. The output layer consists of 2 neurons activated by the Softmax function

References

    1. Brůna T, Hoff KJ, Lomsadze A, Stanke M, Borodovsky M. BRAKER2: automatic eukaryotic genome annotation with GeneMark-EP+ and AUGUSTUS supported by a protein database. bioRxiv. Cold Spring Harbor Laboratory; 2020;2020.08.10.245134. - PMC - PubMed
    1. Campbell MS, Holt C, Moore B, Yandell M. Genome annotation and curation using MAKER and MAKER-P. Curr Protoc Bioinformatics. 2014;48:4.11.1–4.11.39. - PMC - PubMed
    1. Haas BJ, Delcher AL, Mount SM, Wortman JR, Smith RK, Jr, Hannick LI, et al. Improving the Arabidopsis genome annotation using maximal transcript alignment assemblies. Nucleic Acids Res. 2003;31:5654–5666. - PMC - PubMed
    1. Yates AD, Achuthan P, Akanni W, Allen J, Allen J, Alvarez-Jarreta J, et al. Ensembl 2020. Nucleic Acids Res. 2020;48:D682–D688. - PMC - PubMed
    1. Thibaud-Nissen F, DiCuccio M, Hlavina W, Kimchi A, Kitts PA, Murphy TD, et al. P8008 The NCBI eukaryotic genome annotation pipeline. J Anim Sci. 2016;94:184–184.

LinkOut - more resources