. 2021 Dec 14;8(6):ENEURO.0424-21.2021.
doi: 10.1523/ENEURO.0424-21.2021. Print 2021 Nov-Dec.

Three Water Restriction Schedules Used in Rodent Behavioral Tasks Transiently Impair Growth and Differentially Evoke a Stress Hormone Response without Causing Dehydration

Affiliations

Three Water Restriction Schedules Used in Rodent Behavioral Tasks Transiently Impair Growth and Differentially Evoke a Stress Hormone Response without Causing Dehydration

Dmitrii Vasilev et al. eNeuro. .

Abstract

Water restriction is commonly used to motivate rodents to perform behavioral tasks; however, its effects on hydration and stress hormone levels are unknown. Here, we report daily body weight and bi-weekly packed red blood cell volume and corticosterone (CORT) in adult male rats across 80 days for three commonly used water restriction schedules. We also assessed renal adaptation to water restriction using postmortem histologic evaluation of renal medulla. A control group received ad libitum water. After one week of water restriction, rats on all restriction schedules resumed similar levels of growth relative to the control group. Normal hydration was observed, and water restriction did not drive renal adaptation. An intermittent restriction schedule was associated with an increase in CORT relative to the control group. However, intermittent restriction evokes a stress response which could affect behavioral and neurobiological results. Our results also suggest that stable motivation in behavioral tasks may only be achieved after one week of restriction.


Figures

Figure 1.
Figure 1.
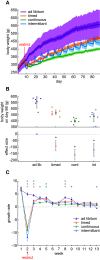
Water restriction evokes an overall body weight reduction that is because of weight loss during the first two weeks. A, Body weight is plotted across the entire duration of the experiment (88 d). Water restriction began on day 8. The mean and SE for each group of rats is shown as a line and shading. The additional light shading around the ad libitum group indicates ±2 SDs around the mean. There were six rats per group. B, The final body weight at the end of the experiment was reduced in all water restriction groups relative to the ad libitum control group. The upper panel shows the distribution of individual rats (dots) and the group mean and SE. The lower panel shows the effect size relative to the ad libitum control group and the error bars show the 95% confidence interval for the effect size. A star symbol indicates that the BF for a post hoc Bayesian t test was greater than 3. C, Weekly body weight change is plotted throughout the experiment. The data markers and lines show the mean and SE for each group of rats. Negative growth (below the dotted line) indicates weight loss, whereas positive points indicate growth. Post hoc Bayesian t tests on the alternative hypothesis that control group growth was greater than the restricted group’s growth is illustrated with a star when BF is >3. The color of the star indicates the identity of the group being compared against the ad libitum control group. A BF > 3 indicates that these data provide evidence supporting the alternative hypothesis that growth in the control group was greater than that of the restricted group. The growth differences occurred primarily during the first two weeks of restriction.
Figure 2.
Figure 2.
Hct did not differ between the ad libitum control group and groups of rats subjected to various water restriction schedules. A, % Hct is plotted as the group average of all samples collected each week. The error bars indicate the SE. Although there in an increase in Hct during the first week of blood collection, this occurred in all groups inclusive of the control group. A star symbol indicates that the BF for a post hoc Bayesian t test was greater than 3. The color of the star indicates the identity of the group being compared against the ad libitum control group. B, An assessment of effect sizes comparing all Hct values collected over 88 d suggests that Hct does not differ between groups. The effect sizes (95% confidence interval) relative to the ad libitum control group were: timed group, 1.0% (−2.1 to +4.1%); continuous group, 2.2% (−5.2 to +0.9%); intermittent group, 0.1% (−3.0 to +3.3%).
Figure 3.
Figure 3.
CORT is increased during intermittent water restriction. A, The average and SE of weekly CORT values are plotted for each group of rats. The intermittent group has occasionally elevations in CORT. A star symbol indicates that the BF for a post hoc Bayesian t test was greater than 3. The t symbol indicates a BF value greater than 2. The color of the symbols indicate the identity of the group being compared against the ad libitum control group. B, Collapsing all measurements over time revealed that the intermittent group has elevated CORT relative to the ad libitum control group. The upper panel shows individual data points, and the lower panel shows the effect sizes of group differences relative to the ad libitum control group.
Figure 4.
Figure 4.
Water restriction is not associated with alterations in the Loops of Henle. A, This example tissue section of the kidney shows the gross anatomic makers used to delineate the cortex (C), the outer medulla (OM), the total medulla (TM) demarcated as the distance between the capsule and the “assisting line” (A). The assisting line connects the two points where the ureter connects to the kidney and was used to have a standardized starting point for measurements. The TM may or may not include the entire inner medulla, which sometimes crossed the assisting line. We assessed RMT using two formulae. The first was the OM to C ratio (OMR) and the other was the TM to C ratio (MR). B, C, Neither the MR (B) nor the OMR (C) differed across groups of rats. The plots show the individual data points where complete sections could be obtained to make a clear assessment of these measures. The lower panel shows the effect sizes relative to the ad libitum control group and the 95% confidence intervals of those effect sizes. D, Postmortem kidney weight was measured and indicated a reduction in kidney weight in the group of rats subjected to continuous water restriction. The upper panel shows individual data points and the lower panel shows effect sizes and confidence intervals relative to the ad libitum control group.

References

    1. Abrahamsen GC, Berman Y, Carr KD (1995) Curve-shift analysis of self-stimulation in food-restricted rats: relationship between daily meal, plasma corticosterone and reward sensitization. Brain Res 695:186–194. 10.1016/0006-8993(95)00764-h - DOI - PubMed
    1. Akana SF, Dallman MF (1997) Chronic cold in adrenalectomized, corticosterone (B)-treated rats: facilitated corticotropin responses to acute restraint emerge as B increases. Endocrinology 138:3249–3258. 10.1210/endo.138.8.5291 - DOI - PubMed
    1. Armario A, Lopez-Calderon A, Jolin T, Balasch J (1986) Response of anterior pituitary hormones to chronic stress. The specificity of adaptation. Neurosci Biobehav Rev 10:245–250. 10.1016/0149-7634(86)90011-4 - DOI - PubMed
    1. Arnhold MM, Yoder JM, Engeland WC (2009) Subdiaphragmatic vagotomy prevents drinking-induced reduction in plasma corticosterone in water-restricted rats. Endocrinology 150:2300–2307. 10.1210/en.2008-1594 - DOI - PMC - PubMed
    1. Barnet RC, Cole RP, Miller RR (1997) Temporal integration in second-order conditioning and sensory preconditioning. Anim Learn Behav 25:221–233. 10.3758/BF03199061 - DOI

Publication types