. 2021 Dec;31(12):2209-2224.
doi: 10.1101/gr.275373.121. Epub 2021 Nov 23.

Individualized VDJ recombination predisposes the available Ig sequence space

Affiliations

Individualized VDJ recombination predisposes the available Ig sequence space

Andrei Slabodkin et al. Genome Res. 2021 Dec.

Abstract

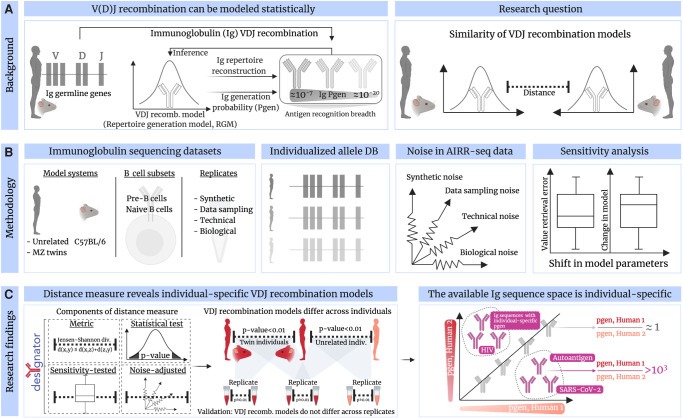
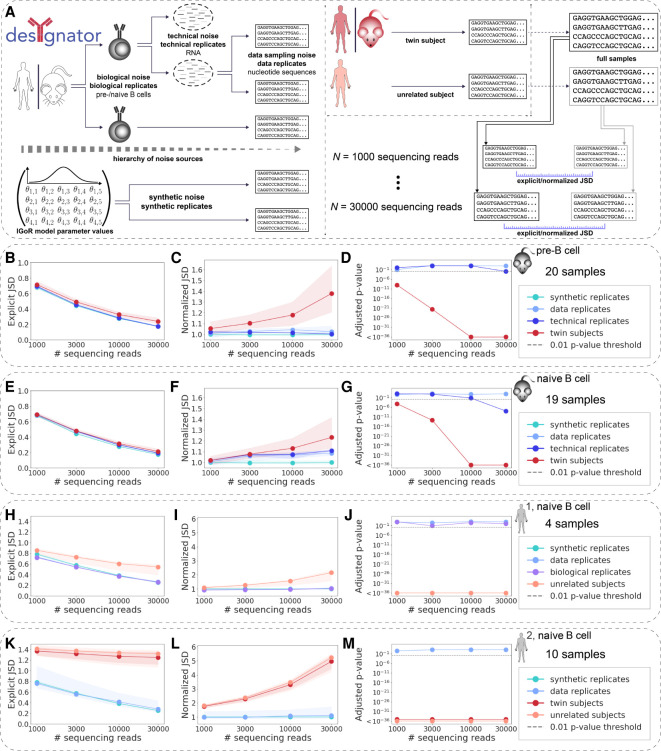
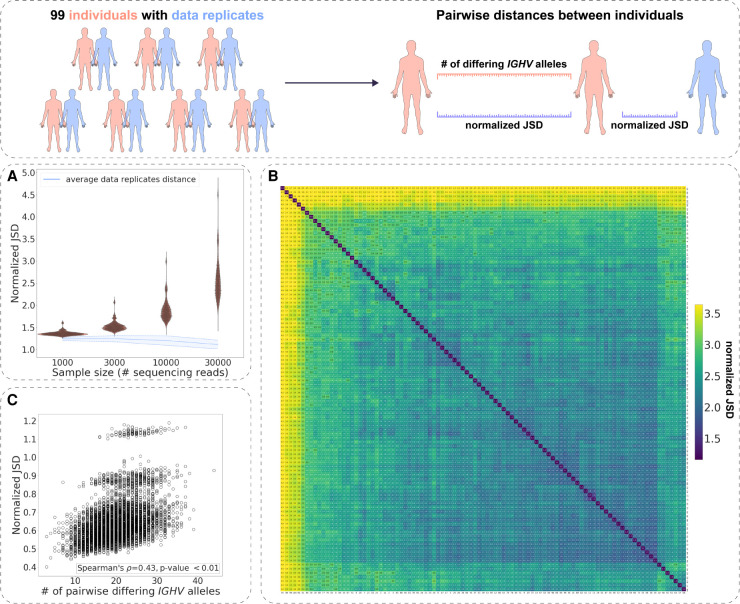
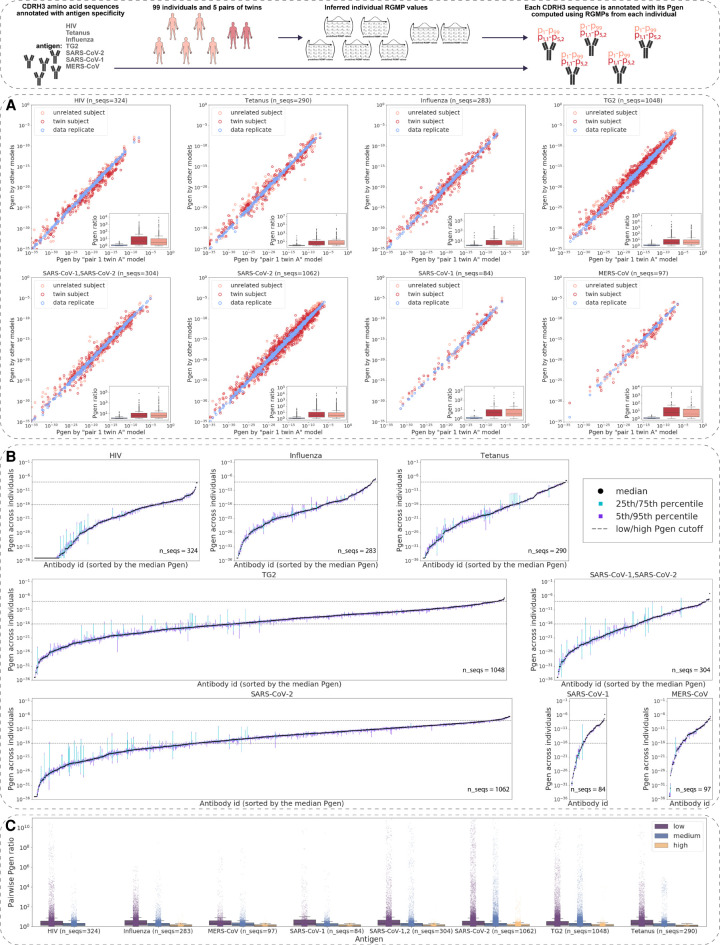
The process of recombination between variable (V), diversity (D), and joining (J) immunoglobulin (Ig) gene segments determines an individual's naive Ig repertoire and, consequently, (auto)antigen recognition. VDJ recombination follows probabilistic rules that can be modeled statistically. So far, it remains unknown whether VDJ recombination rules differ between individuals. If these rules differed, identical (auto)antigen-specific Ig sequences would be generated with individual-specific probabilities, signifying that the available Ig sequence space is individual specific. We devised a sensitivity-tested distance measure that enables inter-individual comparison of VDJ recombination models. We discovered, accounting for several sources of noise as well as allelic variation in Ig sequencing data, that not only unrelated individuals but also human monozygotic twins and even inbred mice possess statistically distinguishable immunoglobulin recombination models. This suggests that, in addition to genetic, there is also nongenetic modulation of VDJ recombination. We demonstrate that population-wide individualized VDJ recombination can result in orders of magnitude of difference in the probability to generate (auto)antigen-specific Ig sequences. Our findings have implications for immune receptor-based individualized medicine approaches relevant to vaccination, infection, and autoimmunity.


Figures

Figure 1.
Figure 1.
Comparison of AIR repertoire generation models. (A) The process of recombining variable (V), diversity (D), and joining (J) immunoglobulin (Ig) gene segments determines an individual's naive Ig repertoire and, consequently, (auto)antigen recognition. VDJ recombination follows probabilistic rules that can be described statistically as repertoire generation models (RGMs). So far, it remains unknown whether VDJ recombination rules differ across individuals. We set out to resolve this question by developing a distance measure that enables the quantification of RGM parameter (RGMP) similarity. (B) Accounting for several sources of noise in murine and human Ig sequencing data (by leveraging various types of replicates), as well as allelic diversity, (C) we were able to implement a noise-aware, sensitivity-tested statistical test for comparing RGM similarity. We call our method desYgnator for DEtection of SYstematic differences in GeneratioN of Adaptive immune recepTOr Repertoires (desYgnator). Using desYgnator, we found that replicate samples of the same subject are consistently more similar to each other than to samples from other unrelated individuals or even monozygotic twins (or inbred mice) indicating that not only genetic but also nongenetic factors contribute to the individualization of an RGM. We validated desYgnator by showing that RGM did not differ across synthetic and experimental replicates. We quantified the implication of individual RGMs on Ig repertoire architecture in a data set of approximately 100 human individuals by showing that the same (antigen-annotated) Ig sequence can have different generation probabilities across individuals. Thus, the available Ig sequence space is individually biased, predisposed by the individual RGM.
Figure 2.
Figure 2.
RGMPs are individual-specific independent of the degree of immunogenetic similarity between individuals. (A) Different sources of AIRR-seq noise may arise impacting RGMP inference. To account for these sources of noise, different kinds of replicates are necessary. Specifically, biological replicates (i.e., biological samples obtained from the same individual) allow for observing biological noise; technical replicates (an RNA sample that was split, and the parts were sequenced independently) allow for observing technical noise; and data replicates (subsamples of the same AIRR FASTA file, termed “full sample” in the figure) allow for observing data sampling noise. Samples obtained from different (either twin or unrelated) subjects incorporate all these aforementioned sources of noise along with the associated potential nongenetic or genetic individual differences between their RGMPs. Synthetic replicates (synthetic samples generated using the same RGMP sets) allow for observing synthetic noise. (B) Explicit Jensen–Shannon divergence (JSD) between RGMP inferred from samples differing by several levels of noise: synthetic replicates; data replicates; technical replicates; twin mice. We computed the explicit JSD for random subsets of [1000, 3000, 10,000, 30,000] sequencing reads taken from samples of the MOUSE_PRE data set (19 IgH pre–B cell samples from C57BL/6 mice and one technical replicate, see Methods, “Experimental immunoglobulin sequencing data”). Circles correspond to the median explicit JSD; shaded areas correspond to the whole range of the explicit JSD for the given sample size and pair type (from minimum to maximum). (C) The amount of noise that accounts for the difference between synthetic replicates is quantified using the explicit JSD. This can be considered as the lower bound of noise in our system. We then normalized the explicit JSD by this lower bound. (D) To test whether the difference between a pair of samples is significantly higher than the difference between data replicates, we adapted the Student's t-test. The adjusted P-values for data and technical replicates were above the 0.01 threshold for each sample size except 30,000 for technical replicates. The adjusted P-values for twin subjects were below the 0.01 threshold for all sample sizes, indicating that the recombination models of the twin subjects are not identical. (EG) Same as BD but computed for the MOUSE_NAIVE data set (19 IgH naive B cell samples from C57BL/6 mice and one technical replicate). The twin subjects are closer to each other than in the pre–B cell case. The P-values of the statistical test, as in D, indicated RGMP of cross-subject samples differed systematically. (HJ) Same as BD but computed for the HUMAN1 data set (three IgH naive B cell samples of healthy Caucasian male donors and one biological replicate). For all samples, individually restricted germline allele databases were constructed. The considered sample pair types are synthetic replicates, data replicates, biological replicates, and unrelated subjects. P-values indicate that biological as well as technical replicates were generated with the same RGMPs and that RGMPs differed across unrelated human individuals. (KM) Same as BD but computed for the HUMAN2 data set (IgH naive B cell samples from five pairs of MZ twins). For all samples, individually restricted germline allele databases were constructed (Methods, “An approach to building personalized RGMs that are robust to allelic variability of IGHV genes”). The considered sample pair types are synthetic replicates, data replicates, twin subjects, and unrelated subjects. P-values indicate that RGMPs of human MZ twins differ. All P-values were adjusted using the Bonferroni correction within one data set. The significance threshold of P = 0.01 is indicated by a gray dashed line.
Figure 3.
Figure 3.
Immunoglobulin RGM parameters are unique across human individuals. (Inset) For samples from a cohort of 99 unrelated individuals, two kinds of distance were computed: the normalized JSD between RGMPs inferred from these samples and the number of differing IGHV alleles. Additionally, for each sample, we computed the normalized JSD between its own RGMPs and RGMPs inferred from its data replicate. (A) The distribution of the pairwise normalized JSD for 99 individuals of the HUMAN3 data set was computed for subsamples of 1000, 3000, 10,000, and 30,000 sequencing reads. The blue line corresponds to the average distance between data replicates. (B) Heatmap visualization of A for the subsample size of 30,000 sequencing reads: The values on the diagonal correspond to the average distance between data replicates. (C) The number of IGHV gene alleles that differ between any two individuals as a function of the normalized JSD between their RGMP inferred from subsamples of 30,000 sequencing reads.
Figure 4.
Figure 4.
Generation probabilities of antigen-annotated immunoglobulins (CDRH3 sequences) vary by several orders of magnitude within the human population. (Inset) For a data set of CDRH3 amino acid sequences annotated with antigen specificity, we computed Pgens using a set of RGMs corresponding to N different experimental samples. Each CDRH3 sequence is thus annotated with N Pgens. (A) Pgens of antibody CDRH3 amino acid sequences (annotated with antigen specificity) computed using RGMs corresponding to samples of different levels of immunogenetic similarity: a pair of data replicate models, a pair of models from twin individuals, and a pair of models from unrelated individuals. The x-axis always stands for the Pgen as computed with the model corresponding to the pair 1 twin A individual from the HUMAN2 data set. The y-axis corresponds to the Pgen as computed with the other model in the pair (data replicate or twin/unrelated subject). The boxplots show the distribution of the min(x,y)/max(x,y) ratios, that is, the pairwise difference of Pgens. (B) For each CDRH3 amino acid sequence, we calculated its Pgen as determined by the models corresponding to the 99 individuals from the HUMAN3 data set. The x-axis itemizes each of the CDRH3 sequences tested; the y-axis denotes the fifth, 25th, 50th, 75th, and 95th percentiles of the 99 Pgens of each CDRH3. (C) Pairwise ratios of the Pgens from B by antigen. For each antigen, we divided the CDRH3 amino acid sequences into three groups depending on the sequence's median Pgen across individuals: low (median Pgen < 10−16), medium (10−16 ≤ median Pgen < 10−8), and high (10−8 ≤ median Pgen).
Figure 5.
Figure 5.
The sensitivity of RGMP inference and their impact on Pgen values vary by RGMP. (Inset) Given a set {Θ} of RGMPs, we modified one of the parameter values, obtaining a modified RGMP set {Θ′}, generated a set of synthetic IgH sequences using {Θ′} and then inferred RGMP values from these sequences, thus obtaining RGMP set {Θ′′}. By comparing {Θ′} and {Θ′′}, we estimated the stability of the RGMP inference model in IGoR. (AD) RGMP value retrieval error (the difference between the inferred parameter value and the ground truth one) for RGMPs inferred from synthetic samples that were generated using a modified RGMP set with increased conditional probability to observe a certain J segment given a V segment for synthetic sample sizes of 1000, 3000, 10,000, and 30,000 sequencing reads (10 synthetic samples for each sample size) based on the HUMAN2 data set. The dashed line corresponds to zero difference (i.e., no error observed). (EH) Normalized JSD between the inferred RGMP sets and the initial modified one (boxes; each box corresponds to the same 10 synthetic samples that were used in AD). Average normalized JSD across the inferred RGMP sets themselves equals one because it is the value used for normalization (i.e., between synthetic replicates; dotted line). (I) All J|V conditional probabilities are ranked by their importance, then the k (k in [1…20]) most important probabilities are chosen and multiplied by a coefficient from 10−2 to 106; the rest is rescaled, to sum up to one. The x-axis corresponds to this multiplicative coefficient. The y-axis corresponds to the normalized JSD between the modified model and the unmodified one. The green colors correspond to the first five most important parameters. The circles correspond to the values obtained by generating synthetic samples using the modified model and inferring the parameters back as in EH. (J) Pgens evaluated on identical sequences using different RGM parameter values (each point corresponds to a single sequence). The x-axis corresponds to the Pgen evaluated using the model parameter values inferred from the same sequences that the Pgens were computed for (the “self” model). The y-axis corresponds to the Pgens evaluated using other RGMP values (inferred from a data replicate sample, a technical replicate sample, and a sample from a twin subject). The boxplots show the corresponding Pgen ratio distributions. (K) Analogous to J but the Pgens were computed only on a set of sequences that consisted of the most impactful combinations of V and J segments (five top pairs as computed in I).

References

    1. Akbar R, Robert PA, Pavlović M, Jeliazkov JR, Snapkov I, Slabodkin A, Weber CR, Scheffer L, Miho E, Haff IH, et al. 2021a. A compact vocabulary of paratope-epitope interactions enables predictability of antibody-antigen binding. Cell Rep 34: 108856. 10.1016/j.celrep.2021.108856 - DOI - PubMed
    1. Akbar R, Robert PA, Weber CR, Widrich M, Frank R, Pavlović M, Scheffer L, Chernigovskaya M, Snapkov I, Slabodkin A, et al. 2021b. In silico proof of principle of machine learning-based antibody design at unconstrained scale. bioRxiv 10.1101/2021.07.08.451480 - DOI - PMC - PubMed
    1. Arora R, Burke HM, Arnaout R. 2018. Immunological diversity with similarity. bioRxiv 10.1101/483131 - DOI
    1. Avnir Y, Watson CT, Glanville J, Peterson EC, Tallarico AS, Bennett AS, Qin K, Fu Y, Huang C-Y, Beigel JH, et al. 2016. IGHV1-69 polymorphism modulates anti-influenza antibody repertoires, correlates with IGHV utilization shifts and varies by ethnicity. Sci Rep 6: 20842. 10.1038/srep20842 - DOI - PMC - PubMed
    1. Barennes P, Quiniou V, Shugay M, Egorov ES, Davydov AN, Chudakov DM, Uddin I, Ismail M, Oakes T, Chain B, et al. 2021. Benchmarking of T cell receptor repertoire profiling methods reveals large systematic biases. Nat Biotechnol 39: 236–245. 10.1038/s41587-020-0656-3 - DOI - PubMed

LinkOut - more resources