. 2021 Nov 30;118(48):e2105021118.
doi: 10.1073/pnas.2105021118.

Defective cytokinin signaling reprograms lipid and flavonoid gene-to-metabolite networks to mitigate high salinity in Arabidopsis

Affiliations

Defective cytokinin signaling reprograms lipid and flavonoid gene-to-metabolite networks to mitigate high salinity in Arabidopsis

Mostafa Abdelrahman et al. Proc Natl Acad Sci U S A. .

Abstract

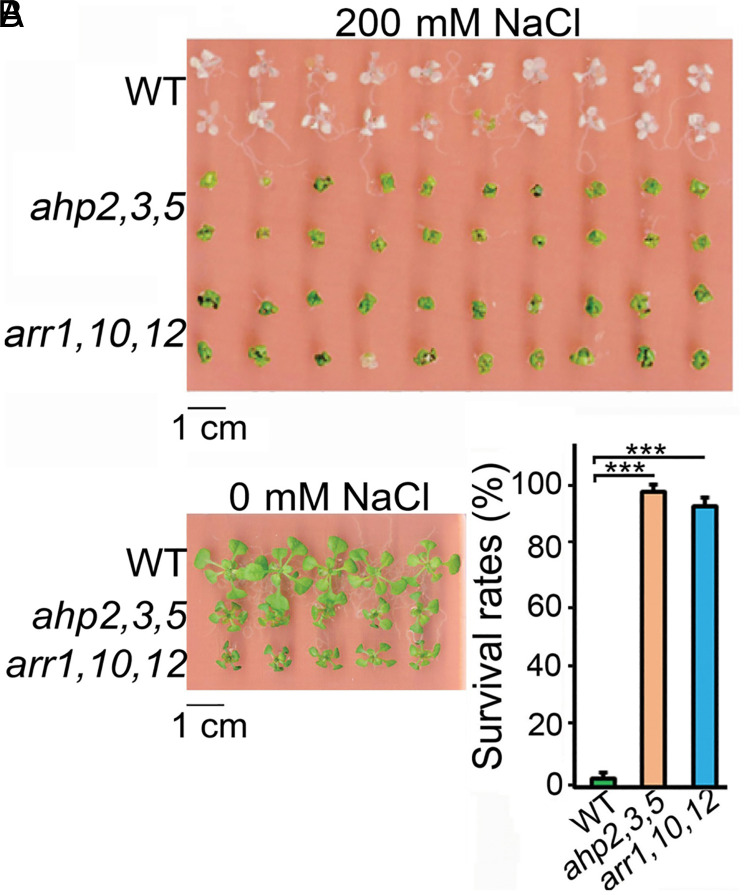
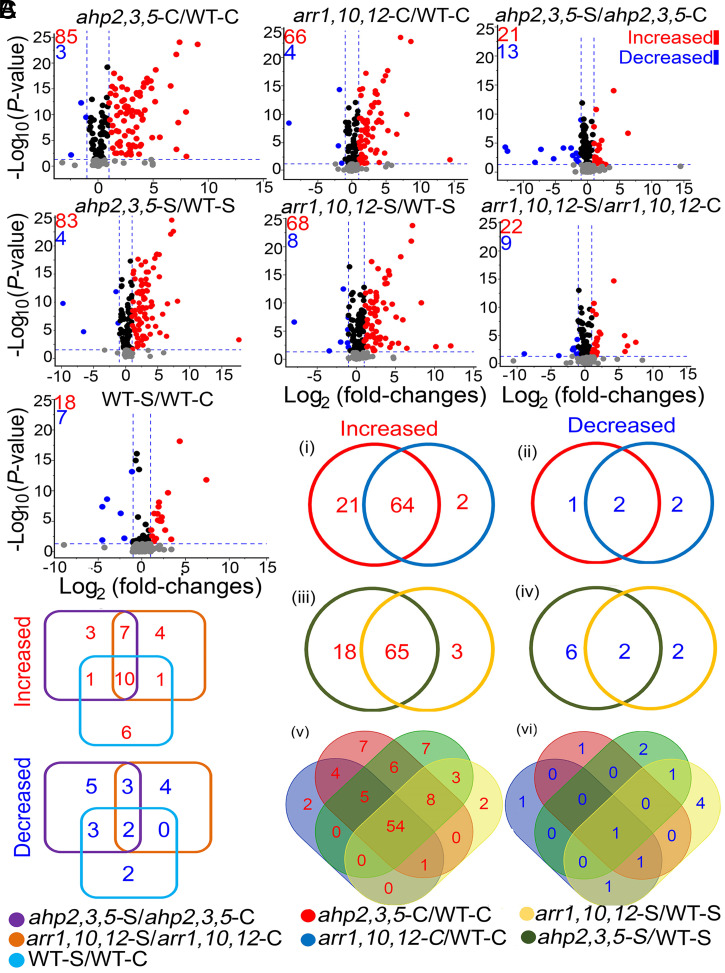
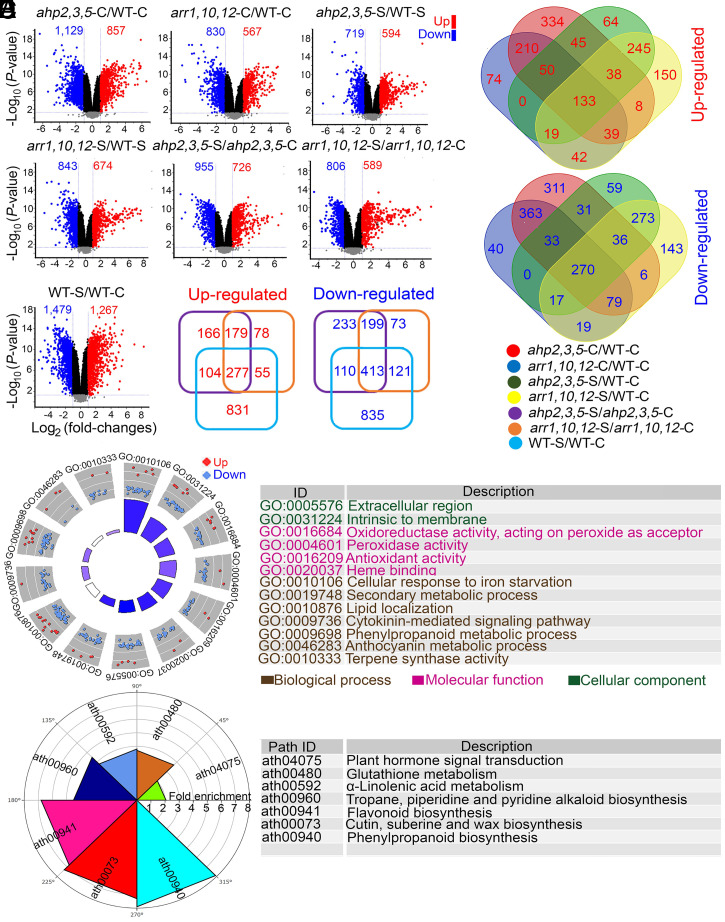
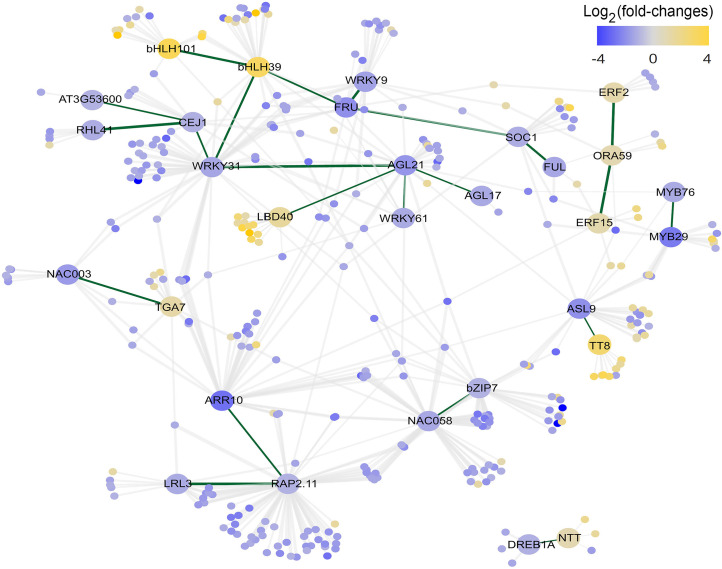
Cytokinin (CK) in plants regulates both developmental processes and adaptation to environmental stresses. Arabidopsis histidine phosphotransfer ahp2,3,5 and type-B Arabidopsis response regulator arr1,10,12 triple mutants are almost completely defective in CK signaling, and the ahp2,3,5 mutant was reported to be salt tolerant. Here, we demonstrate that the arr1,10,12 mutant is also more tolerant to salt stress than wild-type (WT) plants. A comprehensive metabolite profiling coupled with transcriptome analysis of the ahp2,3,5 and arr1,10,12 mutants was conducted to elucidate the salt tolerance mechanisms mediated by CK signaling. Numerous primary (e.g., sugars, amino acids, and lipids) and secondary (e.g., flavonoids and sterols) metabolites accumulated in these mutants under nonsaline and saline conditions, suggesting that both prestress and poststress accumulations of stress-related metabolites contribute to improved salt tolerance in CK-signaling mutants. Specifically, the levels of sugars (e.g., trehalose and galactinol), amino acids (e.g., branched-chain amino acids and γ-aminobutyric acid), anthocyanins, sterols, and unsaturated triacylglycerols were higher in the mutant plants than in WT plants. Notably, the reprograming of flavonoid and lipid pools was highly coordinated and concomitant with the changes in transcriptional levels, indicating that these metabolic pathways are transcriptionally regulated by CK signaling. The discovery of the regulatory role of CK signaling on membrane lipid reprogramming provides a greater understanding of CK-mediated salt tolerance in plants. This knowledge will contribute to the development of salt-tolerant crops with the ability to withstand salinity as a key driver to ensure global food security in the era of climate crisis.

Keywords: comparative metabolomics; comparative transcriptomics; cytokinin signaling; regulatory network; salt stress.


Conflict of interest statement

The authors declare no competing interest.

Figures

Fig. 1.
Fig. 1.
Phenotype and survival rates of Arabidopsis CK-signaling ahp2,3,5 and arr1,10,12 mutants, relative to WT plants, grown for 6 d on 0.5× Murashige and Skoog-agar plates supplemented with 200 mM NaCl. (A) Phenotypes of the investigated genotypes at 0 mM and 200 mM NaCl. (B) Survival rates (%) of the investigated genotypes at 200 mM NaCl. Values represent means and SEs calculated from three independent replicates (n = 3, 20 plants per genotype per replicate). Asterisks indicate significantly higher survival rates of ahp2,3,5 and arr1,10,12 compared with WT plants (***P < 0.001; Student’s t test).
Fig. 2.
Fig. 2.
Volcano plots and Venn diagrams of DPMs in ahp2,3,5 and arr1,10,12 mutants, relative to WT plants, grown under nonsaline (ahp2,3,5-C/WT-C and arr1,10,12-C/WT-C) and saline (ahp2,3,5-S/WT-S and arr1,10,12-S/WT-S) conditions, as well as for each genotype, under saline versus nonsaline conditions (ahp2,3,5-S/ahp2,3,5-C, arr1,10,12-S/arr1,10,12-C, and WT-S/WT-C comparisons). (A) Volcano plots of significantly increased [log2 (fold-changes) ≥ 1; q-values ≤ 0.05], and decreased [log2 (fold-changes) ≤ −1; q-values ≤ 0.05] metabolites in the investigated comparisons. Blue-dashed lines represent the q-value and fold-change threshold. Red and blue points highlight the increased and decreased metabolites, respectively, in the investigated comparisons. (B) Venn diagrams of overlapping metabolites in the ahp2,3,5-C/WT-C and arr1,10,12-C/WT-C (i and ii); ahp2,3,5-S/WT-S and arr1,10,12-S/WT-S (iii and iv); and ahp2,3,5-C/WT-C, arr1,10,12-C/WT-C, ahp2,3,5-S/WT-S, and arr1,10,12-S/WT-S comparisons (v and vi). (C) Venn diagrams of overlapping metabolites in the ahp2,3,5-S/ahp2,3,5-C, arr1,10,12-S/arr1,10,12-C, and WT-S/WT-C comparisons. Three independent biological replicates (n = 3) from WT and CK-signaling mutant genotypes were collected for the metabolome (primary and secondary metabolites, except lipids) analysis, while five biological replicates (n = 5) were collected for lipidome analysis.
Fig. 3.
Fig. 3.
Heatmap hierarchical clustering and genotype–genotype correlations of 83 metabolites differentially produced in ahp2,3,5 and arr1,10,12 mutants, relative to WT plants, grown under nonsaline (ahp2,3,5-C/WT-C and arr1,10,12-C/WT-C) and saline (ahp2,3,5-S/WT-S and arr1,10,12-S/WT comparisons) conditions. (AE) Heatmap hierarchical clusters of sugars (A), amino acids and polyamines (B), lipids and sterols (C), flavonoids, phenolics, and glucosinolates (D), and other general metabolites (E) in the investigated comparisons. (F) Genotype–genotype correlations based on the Pcc of DPMs in the investigated comparisons. The metabolite production levels in the heatmaps are a z-score–normalized data matrix. Red and blue colors indicate increased and decreased levels of metabolites, respectively, as indicated by the colored scales.
Fig. 4.
Fig. 4.
KEGG pathways associated with the 83 metabolites differently produced in ahp2,3,5 and arr1,10,12 mutants, relative to WT plants, grown under nonsaline (ahp2,3,5-C/WT-C and arr1,10,12-C/WT-C) and saline (ahp2,3,5-S/WT-S and arr1,10,12-S/WT-S comparisons) conditions. The metabolite production levels in the heatmaps are a z-score–normalized data matrix. KEGG IDs of the DPMs were submitted to KEGG mapper to identify specific pathways. Red and blue colors indicate increased and decreased levels of metabolites, respectively, as indicated by the colored scales. 4-amino-butyrate, GABA; cyanidin 3-O-[2-O-(β-d-xylopyranosyl)-6-O-(E-p-coumaroyl)-β-d-glucopyranoside]-5-O-[6-O-(malonyl)-β-d-glucopyranoside], A5; cyanidin 3-O-[2-O-(2-O-(E-sinapoyl)-β-d-xylopyranosyl)-6-O-(4-O-E-p-coumaroyl)-β-d-glucopyranoside]-5-O-[6-O-(malonyl)-β-d-glucopyranoside], A9; cyanidin 3-O-[2-O-(2-O-(E-sinapoyl)-β-d-xylopyranosyl)-6-O-(4-O-(β-d-glucopyranosyl)-E-p-coumaroyl)-β-d-glucopyranoside]-5-O-[β-d-glucopyranoside], A10; cyanidin 3-O-[2-O-(2-O-(E-sinapoyl-β-d-xylopyranosyl)-6-O-(4-O-(β-d-glucopyranosyl)-(E-p-coumaroyl)-β-d-glucopyranoside)-5-O-[6-O-(malonyl)-β-d-glucopyranoside], A11; kaempferol-diHex-Rha, KHR; kaempferol-3-Rha-7-Glu, KRG; quercetin-3-O-α-L-rhamnopyranosyl(1, 2)-β-D-glucopyranoside-7-O-α-L-rhamnopyranoside, F4; rhamnoside, Rha.

References

    1. Munns R., Gilliham M., Salinity tolerance of crops—What is the cost? New Phytol. 208, 668–673 (2015). - PubMed
    1. Abiala M. K., Abdelrahman M., Burritt D. J., Tran L. P., Salt stress tolerance mechanisms and potential applications of legumes for sustainable reclamation of salt-degraded soils. Land Degrad. Dev. 29, 3812–3822 (2018).
    1. Fu Y., Yang Y., Chen S., Ning N., Hu H., Arabidopsis IAR4 modulates primary root growth under salt stress through ROS-mediated modulation of auxin distribution. Front. Plant Sci. 10, 522 (2019). - PMC - PubMed
    1. Szymańska K. P., Polkowska-Kowalczyk L., Lichocka M., Maszkowska J., Dobrowolska G., SNF1-related protein kinases SnRK2.4 and SnRK2.10 modulate ROS homeostasis in plant response to salt stress. Int. J. Mol. Sci. 20, 143 (2019). - PMC - PubMed
    1. Shabala L., et al. , Cell-type-specific H+-ATPase activity in root tissues enables K+ retention and mediates acclimation of barley (Hordeum vulgare) to salinity stress. Plant Physiol. 172, 2445–2458 (2016). - PMC - PubMed

Publication types

MeSH terms