

Exploitation of Sulfated Glycosaminoglycan Status for Precision Medicine of Triplatin in Triple-Negative Breast Cancer
- PMID: 34815360
- PMCID: PMC8828673
- DOI: 10.1158/1535-7163.MCT-20-0969
Exploitation of Sulfated Glycosaminoglycan Status for Precision Medicine of Triplatin in Triple-Negative Breast Cancer
Abstract
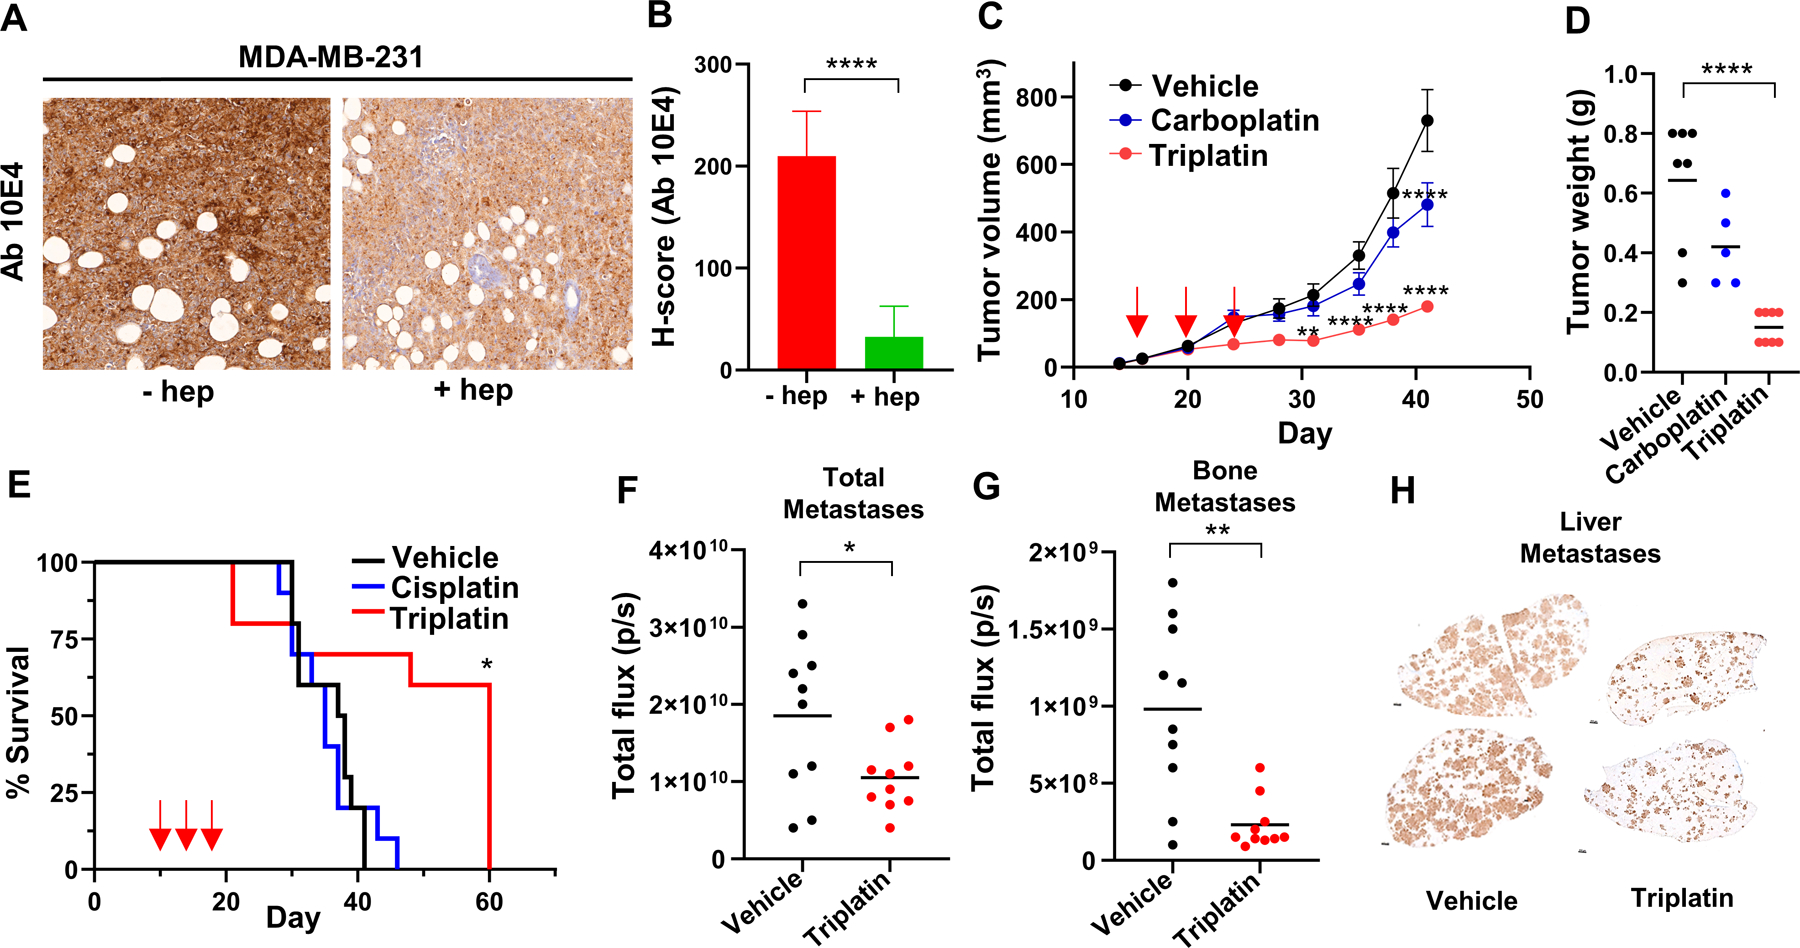
Triple-negative breast cancer (TNBC) is a subtype of breast cancer lacking targetable biomarkers. TNBC is known to be most aggressive and when metastatic is often drug-resistant and uncurable. Biomarkers predicting response to therapy improve treatment decisions and allow personalized approaches for patients with TNBC. This study explores sulfated glycosaminoglycan (sGAG) levels as a predictor of TNBC response to platinum therapy. sGAG levels were quantified in three distinct TNBC tumor models, including cell line-derived, patient-derived xenograft (PDX) tumors, and isogenic models deficient in sGAG biosynthesis. The in vivo antitumor efficacy of Triplatin, a sGAG-directed platinum agent, was compared in these models with the clinical platinum agent, carboplatin. We determined that >40% of TNBC PDX tissue microarray samples have high levels of sGAGs. The in vivo accumulation of Triplatin in tumors as well as antitumor efficacy of Triplatin positively correlated with sGAG levels on tumor cells, whereas carboplatin followed the opposite trend. In carboplatin-resistant tumor models expressing high levels of sGAGs, Triplatin decreased primary tumor growth, reduced lung metastases, and inhibited metastatic growth in lungs, liver, and ovaries. sGAG levels served as a predictor of Triplatin sensitivity in TNBC. Triplatin may be particularly beneficial in treating patients with chemotherapy-resistant tumors who have evidence of residual disease after standard neoadjuvant chemotherapy. More effective neoadjuvant and adjuvant treatment will likely improve clinical outcome of TNBC.
©2021 American Association for Cancer Research.
Conflict of interest statement
Figures


Comment on
-
Selected Articles from This Issue.Mol Cancer Ther. 2022 Feb;21(2):243. doi: 10.1158/1535-7163.MCT-21-2-HI. Mol Cancer Ther. 2022. PMID: 35135870 No abstract available.
Similar articles
-
p53 deficiency linked to B cell translocation gene 2 (BTG2) loss enhances metastatic potential by promoting tumor growth in primary and metastatic sites in patient-derived xenograft (PDX) models of triple-negative breast cancer.Breast Cancer Res. 2016 Jan 27;18(1):13. doi: 10.1186/s13058-016-0673-9. Breast Cancer Res. 2016. PMID: 26818199 Free PMC article.
-
Establishment of chemosensitivity tests in triple-negative and BRCA-mutated breast cancer patient-derived xenograft models.PLoS One. 2019 Dec 10;14(12):e0225082. doi: 10.1371/journal.pone.0225082. eCollection 2019. PLoS One. 2019. PMID: 31821346 Free PMC article.
-
Capecitabine Efficacy Is Correlated with TYMP and RB1 Expression in PDX Established from Triple-Negative Breast Cancers.Clin Cancer Res. 2018 Jun 1;24(11):2605-2615. doi: 10.1158/1078-0432.CCR-17-3490. Epub 2018 Feb 20. Clin Cancer Res. 2018. PMID: 29463559
-
Neoadjuvant therapy for triple-negative breast cancer: potential predictive biomarkers of activity and efficacy of platinum chemotherapy, PARP- and immune-checkpoint-inhibitors.Expert Opin Pharmacother. 2020 Apr;21(6):687-699. doi: 10.1080/14656566.2020.1724957. Epub 2020 Feb 13. Expert Opin Pharmacother. 2020. PMID: 32052646 Review.
-
Role of Platinums in Triple-Negative Breast Cancer.Curr Oncol Rep. 2021 Mar 22;23(5):50. doi: 10.1007/s11912-021-01041-x. Curr Oncol Rep. 2021. PMID: 33754211 Review.
Cited by
-
Genomic screening reveals ubiquitin-like modifier activating enzyme 1 as a potent and druggable target in c-MYC-high triple negative breast cancer models.PNAS Nexus. 2022 Oct 11;1(5):pgac232. doi: 10.1093/pnasnexus/pgac232. eCollection 2022 Nov. PNAS Nexus. 2022. PMID: 36712364 Free PMC article.
-
Amphiphilic Glycoprobes for Cell Surface Engineering and Drug Delivery.Methods Mol Biol. 2025;2926:157-173. doi: 10.1007/978-1-0716-4542-0_12. Methods Mol Biol. 2025. PMID: 40266524
-
Transcriptomic changes underlying EGFR inhibitor resistance in human and mouse models of basal-like breast cancer.Sci Rep. 2022 Dec 8;12(1):21248. doi: 10.1038/s41598-022-25541-3. Sci Rep. 2022. PMID: 36482068 Free PMC article.
-
A Comparison of Di- and Trinuclear Platinum Complexes Interacting with Glycosaminoglycans for Targeted Chemotherapy.ACS Med Chem Lett. 2023 Sep 1;14(9):1224-1230. doi: 10.1021/acsmedchemlett.3c00244. eCollection 2023 Sep 14. ACS Med Chem Lett. 2023. PMID: 37736178 Free PMC article.
-
Radiation induces ESCRT pathway dependent CD44v3+ extracellular vesicle production stimulating pro-tumor fibroblast activity in breast cancer.Front Oncol. 2022 Aug 29;12:913656. doi: 10.3389/fonc.2022.913656. eCollection 2022. Front Oncol. 2022. PMID: 36106109 Free PMC article.
References
-
- Cardoso F, Senkus E, Costa A, Papadopoulos E, Aapro M, André F, et al. 4th ESO–ESMO International Consensus Guidelines for Advanced Breast Cancer (ABC 4) These guidelines were developed by the European School of Oncology (ESO) and the European Society for Medical Oncology (ESMO). Ann. Oncol 2018; 1;29(8):1634–57. - PMC - PubMed
-
- Bevers TB, Anderson BO, Bonaccio E, Buys S, Daly MB, Dempsey PJ, et al. Breast Cancer Screening and Diagnosis. J. Natl. Compr. Canc. Ne 2009; 1;7(10):1060–96. - PubMed
-
- Waks AG, Winer EP. Breast Cancer Treatment: A Review. JAMA 2019; 22;321(3):288–300. - PubMed
-
- Schmid P, Cortes J, Pusztai L, McArthur H, Kümmel S, Bergh J, et al. Pembrolizumab for Early Triple-Negative Breast Cancer. N. Engl. J. Med 2020; 27;382(9):810–21. - PubMed
-
- Bardia A, Hurvitz SA, Tolaney SM, Loirat D, Punie K, Oliveira M,et al. Sacituzumab govitecan in metastatic triple-negative breast cancer. N. Engl. J. Med 2021; 22;384(16):1529–41. - PubMed
Publication types
MeSH terms
Substances
Grants and funding
LinkOut - more resources
Full Text Sources
