. 2021 Nov 23;12(1):6763.
doi: 10.1038/s41467-021-26768-w.

The role of urban trees in reducing land surface temperatures in European cities

Affiliations

The role of urban trees in reducing land surface temperatures in European cities

Jonas Schwaab et al. Nat Commun. .

Abstract

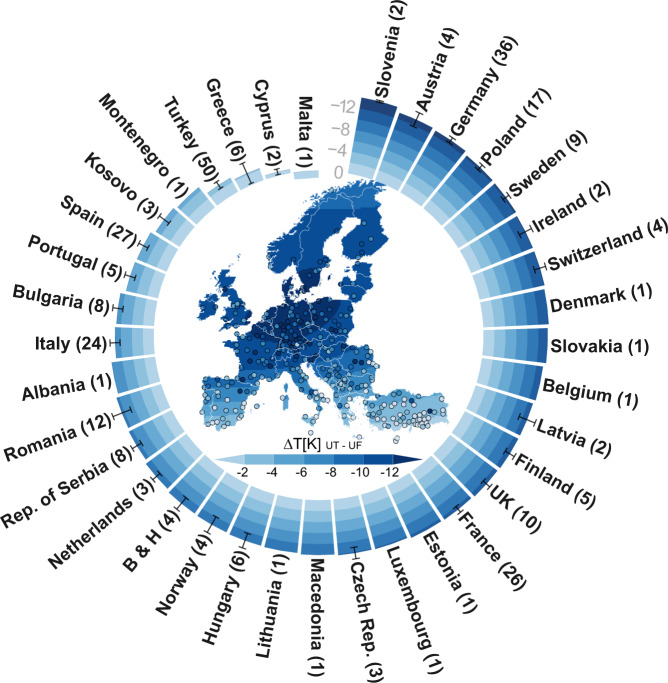
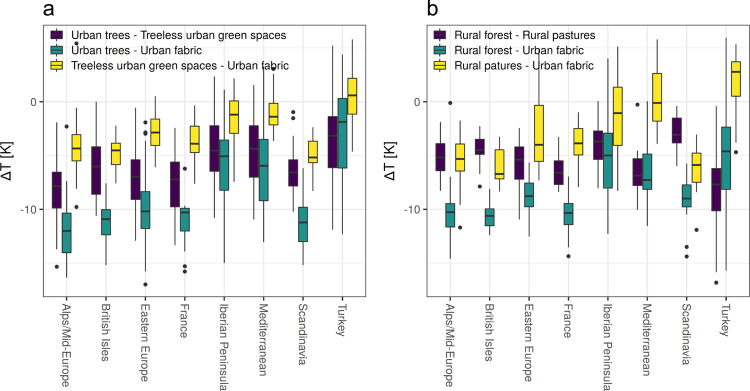
Urban trees influence temperatures in cities. However, their effectiveness at mitigating urban heat in different climatic contexts and in comparison to treeless urban green spaces has not yet been sufficiently explored. Here, we use high-resolution satellite land surface temperatures (LSTs) and land-cover data from 293 European cities to infer the potential of urban trees to reduce LSTs. We show that urban trees exhibit lower temperatures than urban fabric across most European cities in summer and during hot extremes. Compared to continuous urban fabric, LSTs observed for urban trees are on average 0-4 K lower in Southern European regions and 8-12 K lower in Central Europe. Treeless urban green spaces are overall less effective in reducing LSTs, and their cooling effect is approximately 2-4 times lower than the cooling induced by urban trees. By revealing continental-scale patterns in the effect of trees and treeless green spaces on urban LST our results highlight the importance of considering and further investigating the climate-dependent effectiveness of heat mitigation measures in cities.


Conflict of interest statement

The authors declare no competing interests.

Figures

Fig. 1
Fig. 1. Regional variation in temperature differences (∆T) during hot extremes between areas covered 100% by urban trees (UT) and areas covered 100% by continuous urban fabric (UF).
The map shows smoothed spatial trends of the temperature differences, and each dot represents the temperature difference in a specific city. Mean temperature differences for each country are indicated by stacked bars, and standard errors of the mean are also shown. The number of cities that could be used to calculate mean values in each country are indicated in brackets after the country name. B & H stands for the country Bosnia and Herzegovina.
Fig. 2
Fig. 2. Temperature differences between urban trees and continuous urban fabric for selected cities in Europe.
a All cities together with their surroundings that were selected for analysis (grey) and cities for which results are shown in more detail (red). In each region, a representative city was selected (except for Turkey, where we show the results for two cities). b Geographic extent of the defined European regions. c The LST differences between continuous urban fabric and areas covered 100% by urban trees (UT urban trees, UF continuous urban fabric). Boxplots of each city indicate the spread of temperature differences calculated for all summertime (JJA) observations (boxes show the first and third quartile; whiskers show the largest/smallest values, but do not extend beyond 1.5 times of the interquartile range; outliers are shown as separate points). The temperature difference observed when the background temperature was highest is shown as an orange dot together with error bars denoting standard errors.
Fig. 3
Fig. 3. Temperature differences between urban or rural vegetation and urban fabric.
a Temperature differences between urban vegetation and urban fabric. b Temperature differences between rural vegetation and urban fabric (boxes show the first and third quartile; whiskers show the largest/smallest values but do not extend beyond 1.5 times of the interquartile range; outliers are shown as separate points).
Fig. 4
Fig. 4. Mean summertime temperature differences (∆T) between urban vegetated areas and continuous urban fabric plotted against evapotranspiration of vegetated areas outside of each city.
a Scatterplot of temperature differences between urban trees (UT) and urban fabric (UF) plotted against evapotranspiration (ET) estimated for rural forests. b Scatterplot of temperature differences between treeless urban green spaces (GS) and urban fabric (UF) plotted against evapotranspiration estimated for rural pastures. Each dot represents a city. All cities in a specific region have the same colour.
Fig. 5
Fig. 5. Schematic of modelling process showing conceptually how the LST observation are analysed in each city.
LST observations between 2006 and 2018 are used as response variables when fitting GAMs including several predictor variables (e.g. DEM—Digital Elevation Model). The resulting models are used to make predictions on the temperature difference between vegetated land and continuous urban fabric. A smooth function is fitted to approximate these differences based on background temperature and the value indicated by the smooth for the highest observed temperature (orange dot) is used for a comparison with other cities. The grey area indicates the uncertainty in the form of a confidence interval.

References

    1. Wang XH, Wu Y, Gong J, Li B, Zhao JJ. Urban planning design and sustainable development of forest based on heat island effect. Appl. Ecol. Environ. Res. 2019;17:9121–9129.
    1. Manoli G, et al. Magnitude of urban heat islands largely explained by climate and population. Nature. 2019;573:55–60. - PubMed
    1. Chakraborty T, Lee X. A simplified urban-extent algorithm to characterize surface urban heat islands on a global scale and examine vegetation control on their spatiotemporal variability. Int. J. Appl. Earth Observation Geoinf. 2019;74:269–280.
    1. Martilli A, Krayenhoff ES, Nazarian N. Is the Urban Heat Island intensity relevant for heat mitigation studies? Urban Clim. 2020;31:100541.
    1. Li, Y. et al. Local cooling and warming effects of forests based on satellite observations. Nat. Commun.6, 6603 (2015). - PMC - PubMed

Publication types