. 2021 Nov 23;12(1):6802.
doi: 10.1038/s41467-021-27096-9.

Adaptation, spread and transmission of SARS-CoV-2 in farmed minks and associated humans in the Netherlands

Affiliations

Adaptation, spread and transmission of SARS-CoV-2 in farmed minks and associated humans in the Netherlands

Lu Lu et al. Nat Commun. .

Abstract

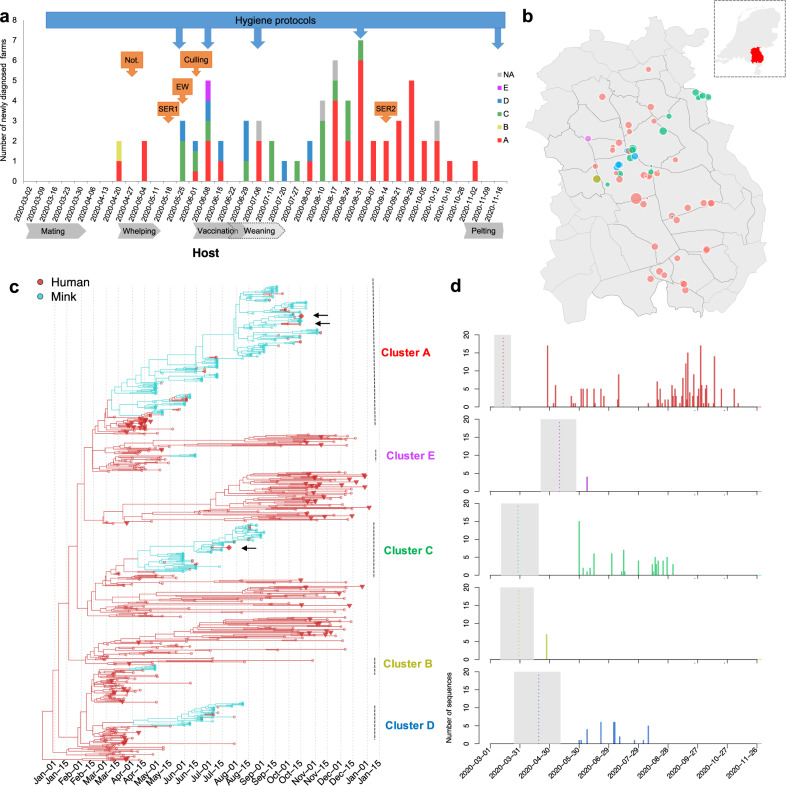
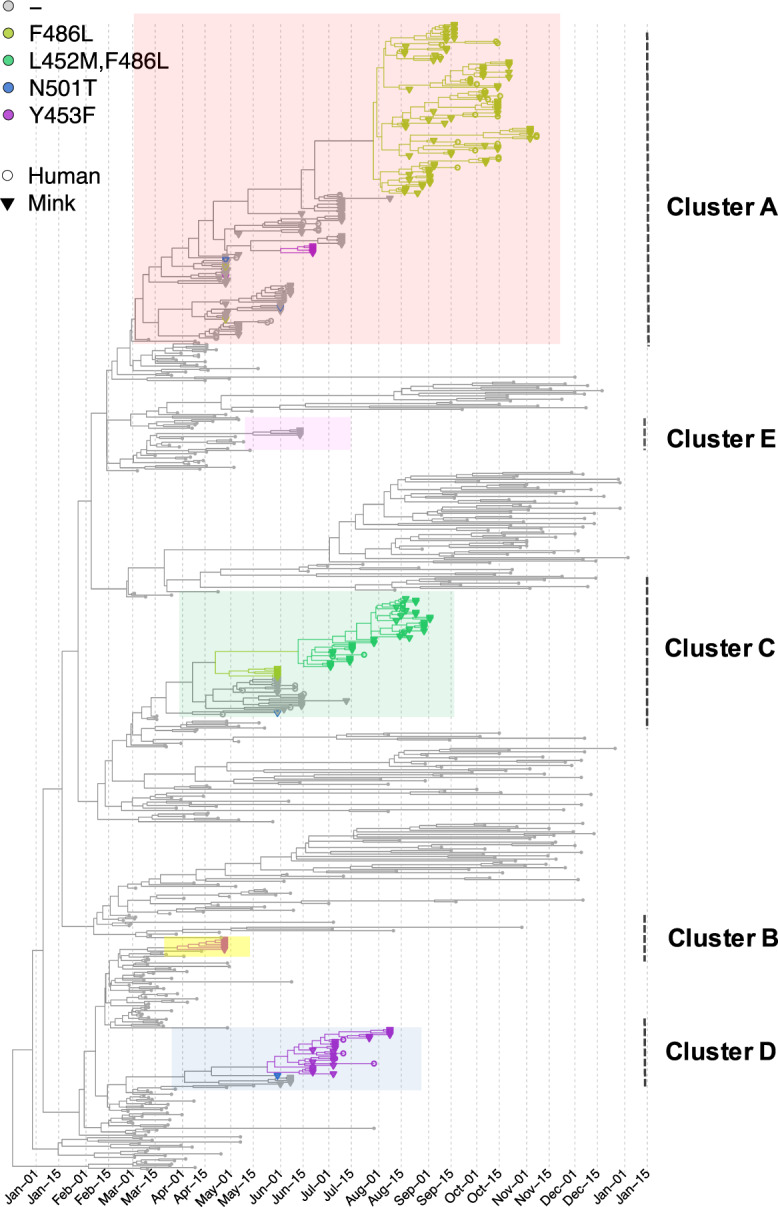
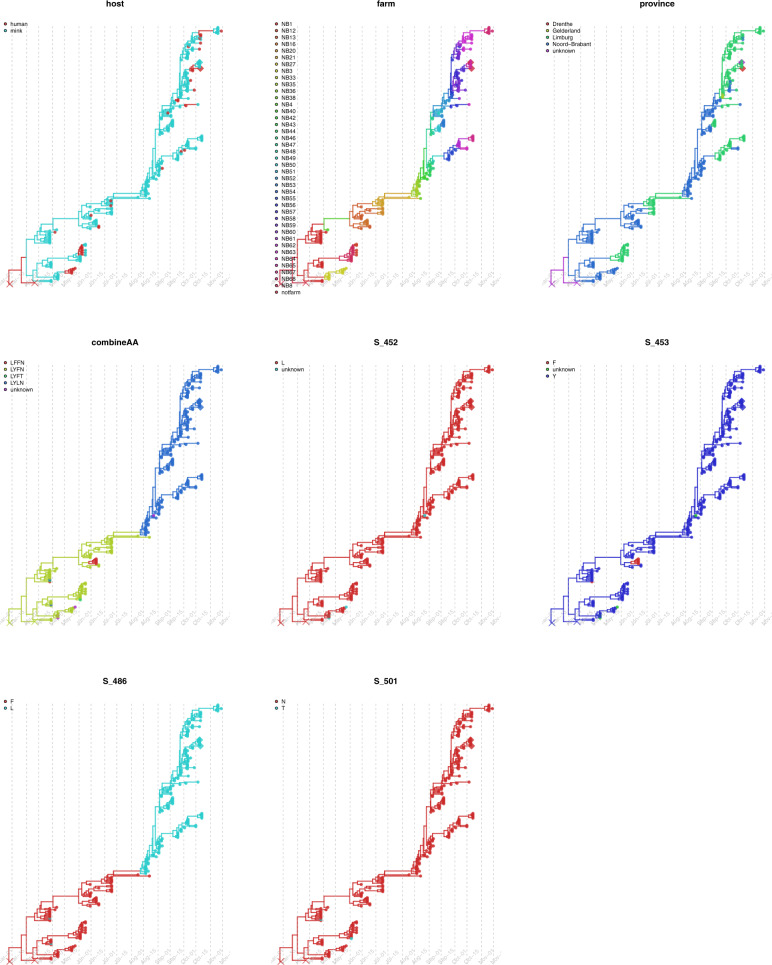
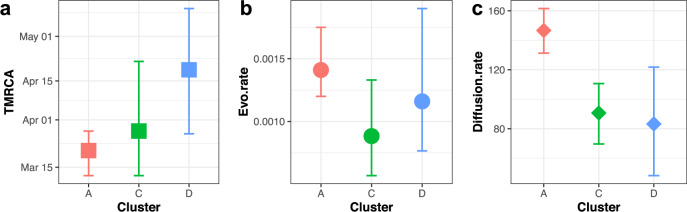
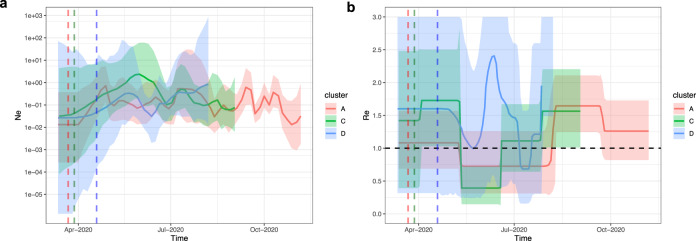
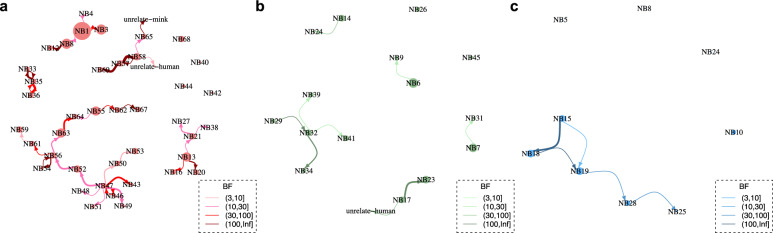
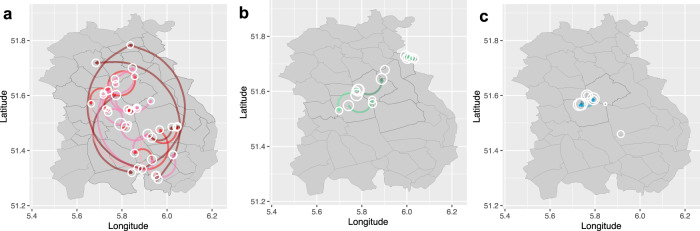
In the first wave of the COVID-19 pandemic (April 2020), SARS-CoV-2 was detected in farmed minks and genomic sequencing was performed on mink farms and farm personnel. Here, we describe the outbreak and use sequence data with Bayesian phylodynamic methods to explore SARS-CoV-2 transmission in minks and humans on farms. High number of farm infections (68/126) in minks and farm workers (>50% of farms) were detected, with limited community spread. Three of five initial introductions of SARS-CoV-2 led to subsequent spread between mink farms until November 2020. Viruses belonging to the largest cluster acquired an amino acid substitution in the receptor binding domain of the Spike protein (position 486), evolved faster and spread longer and more widely. Movement of people and distance between farms were statistically significant predictors of virus dispersal between farms. Our study provides novel insights into SARS-CoV-2 transmission between mink farms and highlights the importance of combining genetic information with epidemiological information when investigating outbreaks at the animal-human interface.


Conflict of interest statement

The authors declare no competing interests.

Figures

Fig. 1
Fig. 1. Distinct Clusters of SARS-Cov-2 circulating in mink farms in the Netherlands.
a Overview of SARS-CoV-2 outbreaks on mink farms in the Netherlands in relation to implementation of control measures and the mink farm cycle. The diagnosed farms per week are coloured based on virus cluster. One farm in June 2020 is indicated as half A/half D as both clusters were found. The blue arrows above the graph point to the starting week of implementation of more strict hygiene protocols with regard to people working on or visiting farms. Orange arrows point to the start of other control measures including obligation for notification of clinical signs and mortality (Not.), first and second serological screening (SER1 and 2), early warning system with weekly sending in of carcasses (EW) and culling of infected farms. Below the graph important periods in the farmed mink production cycle are indicated. These include mating (March), whelping (April/May), vaccination (June) and weaning (June and July). Also, the start of the pelting season is shown. The 5 viral clusters are in unique colour (A in red, B in yellow, C in green, D in blue and E in pink) and are consistently used in (ad). b The location of each infected mink farm. The node size represents the number of sequences obtained from minks in each farm. The locations of farms on the map have been jittered for privacy reasons. c Time-scaled maximum clade credibility (MCC) tree of SARS-CoV-2 sequences isolated from humans and minks in the Netherlands (n = 673). Human sequences are highlighted in red and mink sequences in green, the subsampled human samples (n = 72) isolated from the same four-digit postal code are highlighted as triangle, and 3 samples (1 escaped mink and 2 un-associated human sequences) which fell within mink clusters are highlighted as diamond and indicated by arrows. Clusters of sequences from minks and associated humans are indicated on the right with unique colours. d The number of samples in time for each cluster. The estimated TMRCAs of each cluster are indicated via dotted line (mean) and grey shade (95% highest posterior density (HPD) intervals).
Fig. 2
Fig. 2. Time-scaled maximum clade credibility (MCC) tree of SARS-Cov2 sequences mapping with 4 amino acid changes (L452M, Y453F, F486L and N501T) of the spike protein.
The phylogeny is the same as Fig. 1c. Tips with specific amino acid changes are enlarged and in different colours; sequences isolated from mink and human are in triangle and circle, respectively. The 5 viral clusters are highlighted on the tree and labelled on the right.
Fig. 3
Fig. 3. Discrete trait mapping on time-scaled phylogeny of Cluster A.
Eight traits including host, farm ID (farm), province, the 4 unique sites in the spike protein with amino acid changes (L452M, Y453F, F486L and N501T) and the combinations of the 4 sites (combineAA) are mapped on the same MCC tree using the discrete trait model. The traits are plotted individually and for each tree, the branches and nodes are coloured by inferred ancestral traits. Samples which fell within mink clusters but not isolated from farms are highlighted in diamond (1 escaped mink and 1 un-associated human sequences). The outgroup containing human samples are cross labelled.
Fig. 4
Fig. 4. Time to most recent common ancestor (TMRCA), evolution rate and spatial diffusion rate of virus clusters infecting multiple farms.
Comparisons of Cluster A, C and D in TMRCA (month, year) (a), evolution rate (substitution/site/year) (b) and spatial diffusion rate (km/year) (c). Data are presented as means (square, circle and diamond) and 95% highest posterior density (HPD) intervals (error bars), estimated with Bayesian phylogenetic methods with MCMC algorithm (with a chain length of 1 × 108 steps sampling every 1 × 104 steps). Cluster A, C and D are in red, green and blue, respectively.
Fig. 5
Fig. 5. Bayesian Skygrid and BDSKY analysis reveal spatiotemporal independent population dynamics of Cluster A, C and D.
a Estimation of effective population size (Ne) by Skygrid analysis for Cluster A (red), C (green) and D (blue) sequences. The logarithmic effective number of infections viral generation time (t) representing effective transmissions is plotted over time. 95% HPD intervals are plotted in lighter colours. Vertical dashed line is the mean TMRCA. b Estimation of reproductive number (Re) by BDSKY analysis of Cluster A (red), C (green) and D (blue) sequences. The shaded portion is the 95% HPD interval, and the solid line is the posterior median. Vertical dashed line is the mean TMRCA.
Fig. 6
Fig. 6. Inferred transmission network between farms.
Transmission network between farms inferred from phylogenies of 3 mink clusters (a) Cluster A (b) Cluster C and (c) Cluster D. Size of node indicates number of samples; edge weight indicates median number of transmissions between pairs of farms; arrow on edge indicates transmission direction; colour of edge from light to dark indicates Bayes Factor (BF) support from low to high (only transmissions with BF >3 are shown). The correlated farms are grouped together. Nodes with no link to the others indicated no significant transmissions with other farms although sequences belong to the cluster have been sampled. The number of transmissions and the correlated BF supports are shown in Table S3.
Fig. 7
Fig. 7. Transmission network between farms on map inferred from phylogenies of 3 mink clusters.
a Cluster A, b Cluster C and c Cluster D. The locations of farms on the map have been jittered for privacy reasons. Size of nodes indicates number of samples; arrow on edge indicates transmission direction; colour of edge from light to dark indicates Bayes Factor (BF) support from low to high (only transmissions with BF >3 are shown), colour keys are the same as Fig. 6.

References

    1. El Masry, I. et al. The likelihood of exposure of humans or animals to SARS-CoV-2 from wild, livestock, companion and aquatic animals: qualitative exposure assessment. FAO Animal Production and Health. Paper 181 (FAO, 2020).
    1. Giner, J. et al. SARS-CoV-2 seroprevalence in household domestic ferrets (Mustela putorius furo). Animals (Basel)11, 667 (2021). - PMC - PubMed
    1. Oreshkova, N. et al. SARS-CoV-2 infection in farmed minks, the Netherlands, April and May 2020. Euro Surveill. 25, 2001005 (2020). - PMC - PubMed
    1. Oude Munnink BB, et al. Transmission of SARS-CoV-2 on mink farms between humans and mink and back to humans. Science. 2021;371:172–177. doi: 10.1126/science.abe5901. - DOI - PMC - PubMed
    1. Rambaut A, et al. A dynamic nomenclature proposal for SARS-CoV-2 lineages to assist genomic epidemiology. Nat. Microbiol. 2020;5:1403–1407. doi: 10.1038/s41564-020-0770-5. - DOI - PMC - PubMed

Publication types

MeSH terms

Substances