. 2021 Nov 23;11(1):22733.
doi: 10.1038/s41598-021-02181-7.

EZH2 presents a therapeutic target for neuroendocrine tumors of the small intestine

Affiliations

EZH2 presents a therapeutic target for neuroendocrine tumors of the small intestine

Elham Barazeghi et al. Sci Rep. .

Abstract

Small intestinal neuroendocrine tumors (SI-NETs) are slow-growing tumors that seem genetically quite stable without highly recurrent mutations, but are epigenetically dysregulated. In contrast to the undetectable expression of the enhancer of zeste homolog 2 (EZH2) histone methyltransferase in the enterochromaffin cells of the small intestine, we found high and differential expression of EZH2 in primary SI-NETs and corresponding metastases. Silencing EZH2 in the SI-NET cell line CNDT2.5 reduced cell proliferation and induced apoptosis. Furthermore, EZH2 knockout inhibited tumor progression in a CNDT2.5 SI-NET xenograft mouse model, and treatment of SI-NET cell lines CNDT2.5 and GOT1 with the EZH2-specific inhibitor CPI-1205 decreased cell viability and promoted apoptosis. Moreover, CPI-1205 treatment reduced migration capacity of CNDT2.5 cells. The EZH2 inhibitor GSK126 also repressed proliferation of CNDT2.5 cells. Recently, metformin has received wide attention as a therapeutic option in diverse cancers. In CNDT2.5 and GOT1 cells, metformin suppressed EZH2 expression, and inhibited cell proliferation. Exposure of GOT1 three-dimensional cell spheroids to CPI-1205 or metformin arrested cell proliferation and decreased spheroid size. These novel findings support a possible role of EZH2 as a candidate oncogene in SI-NETs, and suggest that CPI-1205 and metformin should be further evaluated as therapeutic options for patients with SI-NETs.


Conflict of interest statement

The authors declare no competing interests.

Figures

Figure 1
Figure 1
EZH2 expression in SI-NETs. (a) Representative results from immunohistochemical analysis of EZH2 in 17 PTs and 21 paired MTs; positive staining regardless of strength in a primary and a metastatic tumor. Scale bar 50 µm. (b) Immunofluorescent double staining for chromogranin A and EZH2. Chromogranin A-positive cells (green) are negatively stained for EZH2 (red) in normal small intestinal tissue. Scale bar 50 µm. (c) Western blot analysis of EZH2 in 4 PTs and paired MTs (n = 8). Actin was detected on the same membrane as loading control, and full-length blots are presented in Supplementary Figure S1. (d) mRNA expression level of EZH2 in PTs (n = 27) and paired MTs (n = 33). Wilcoxon–Mann–Whitney U test result displayed in the boxplot (p = 0.03).
Figure 2
Figure 2
EZH2 knockout in SI-NET cells. (a) CNDT2.5 cells were transfected with CRISPR double nickase plasmids (EZH2-h or EZH2-h2) or control double nickase plasmid (empty vector), and were selected for puromycin resistance. Efficient knockout of EZH2 was obtained at mRNA and protein level (full-length blots are found in Supplementary Figure S1). EZH2-h2 plasmids were used for further experiments. (b) Cell viability measured for 24 h, seventy-two hours after transfection under 0.5 µg/mL puromycin selection. (c) Apoptosis was analyzed by quantifying cytoplasmic histone-associated-DNA-fragments, 72 h after transfection. Incubation in 0.1 μg/mL camptothecin was used as a positive control. Data shown are means ± SD of triplicate.
Figure 3
Figure 3
EZH2 knockout in vivo. (a) NMRI-nude female mice (n = 18) were randomly distributed into three groups, and CNDT2.5 WT, control or EZH2 knockout cells were subcutaneously inoculated in the hind flank of the mice. The tumors were dissected after 38 days. (b) Tumor volume was monitored by caliper measurements. Six mice per group were used, and the data represent means ± SD. (c) Xenograft tumor weight is presented as means ± SD. Tumor volumes and weights in the three groups were compared using one-way analysis of variance, and Bonferroni correction was used to adjust the p values (*, p < 0.001). (d) Representative results from immunohistochemical analysis of synaptophysin, EZH2, Ki-67, and activated caspase-3 in tumors dissected from the control and the EZH2 knockout groups. Scale bar 50 µm.
Figure 4
Figure 4
CPI-1205 treatment reduced proliferation and induced apoptosis in SI-NET cells. (a) Cell proliferation was determined in CNDT2.5 and GOT1 cells after treatment with CPI-1205 for 72 and 48 h, respectively. (b) Treatment effect on apoptosis was analyzed by quantifying cytoplasmic histone-associated-DNA-fragments under the same conditions. Incubation with 0.1 μg/mL camptothecin for 48 h was used as a positive control. Data shown are means ± SD of triplicate.
Figure 5
Figure 5
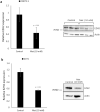
Metformin treatment reduced expression of EZH2 in SI-NET cells. (a) Reduced expression of EZH2 in CNDT2.5 cells after 48 h. Western blot analysis is presented for triplicates. (b) Reduced EZH2 expression in GOT1 cells after 72 h. Western blot analysis is presented for a pooled lysate of triplicates. Full-length blots are found in Supplementary Figure S1. Data presented are means ± SD of triplicate.
Figure 6
Figure 6
Metformin treatment reduced proliferation and, in combination with CPI-1205, induced apoptosis in SI-NET cells. (a) Cell proliferation was determined in CNDT2.5 and GOT1 cells after 48 and 72 h, respectively. (b) CNDT2.5 and GOT1 cells were treated with CPI-1205 (200 μM), metformin (Met) (10 mM), or a combination of both (Combo), followed by apoptosis assay. Data shown are means ± SD of triplicate.
Figure 7
Figure 7
Effects of CPI-1205 and metformin on migration of SI-NET cells. Migration of CNDT2.5 cells was measured by scratch wound-healing assay following incubation with (a) 200 µM CPI-1205 or (b) 10 mM metformin. Representative bright-field images and quantification of scratch wound area at 0 and 24 h after treatment are shown. Scale bar 500 µm. Data presented are means ± SD of triplicate.
Figure 8
Figure 8
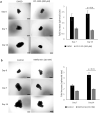
CPI-1205 and metformin treatment reduced the growth of GOT1 cell spheroids. Spheroids were treated with (a) 200 µM CPI-1205 or (b) 10 mM metformin for 14 days. Bright-field images were taken at day 0 of treatment, and 7 and 14 days after treatment. Scale bar 500 µm. The figure reports fold increases in spheroid size after 7 and 14 days of treatment compared to the controls. Data presented are means ± SD of triplicate.

Similar articles

Cited by

References

    1. Stalberg P, Westin G, Thirlwell C. Genetics and epigenetics in small intestinal neuroendocrine tumours. J. Intern. Med. 2016;280:584–594. doi: 10.1111/joim.12526. - DOI - PubMed
    1. Di Domenico A, Wiedmer T, Marinoni I, Perren A. Genetic and epigenetic drivers of neuroendocrine tumours (NET) Endocr. Relat. Cancer. 2017;24:R315–R334. doi: 10.1530/ERC-17-0012. - DOI - PubMed
    1. Ito T, Lee L, Jensen RT. Carcinoid-syndrome: Recent advances, current status and controversies. Curr. Opin. Endocrinol. Diabetes Obes. 2018;25:22–35. doi: 10.1097/MED.0000000000000376. - DOI - PMC - PubMed
    1. Daskalakis K, et al. Association of a prophylactic surgical approach to stage IV small intestinal neuroendocrine tumors with survival. JAMA Oncol. 2018;4:183–189. doi: 10.1001/jamaoncol.2017.3326. - DOI - PMC - PubMed
    1. Banck MS, et al. The genomic landscape of small intestine neuroendocrine tumors. J. Clin. Investig. 2013;123:2502–2508. doi: 10.1172/JCI67963. - DOI - PMC - PubMed

Publication types

MeSH terms

Substances