

Nanoplasmonic immunosensor for the detection of SCG2, a candidate serum biomarker for the early diagnosis of neurodevelopmental disorder
- PMID: 34815513
- PMCID: PMC8610996
- DOI: 10.1038/s41598-021-02262-7
Nanoplasmonic immunosensor for the detection of SCG2, a candidate serum biomarker for the early diagnosis of neurodevelopmental disorder
Erratum in
-
Publisher Correction: Nanoplasmonic immunosensor for the detection of SCG2, a candidate serum biomarker for the early diagnosis of neurodevelopmental disorder.Sci Rep. 2021 Dec 16;11(1):24386. doi: 10.1038/s41598-021-03378-6. Sci Rep. 2021. PMID: 34916556 Free PMC article. No abstract available.
Abstract
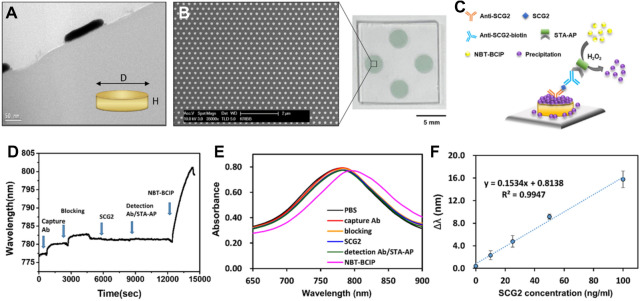
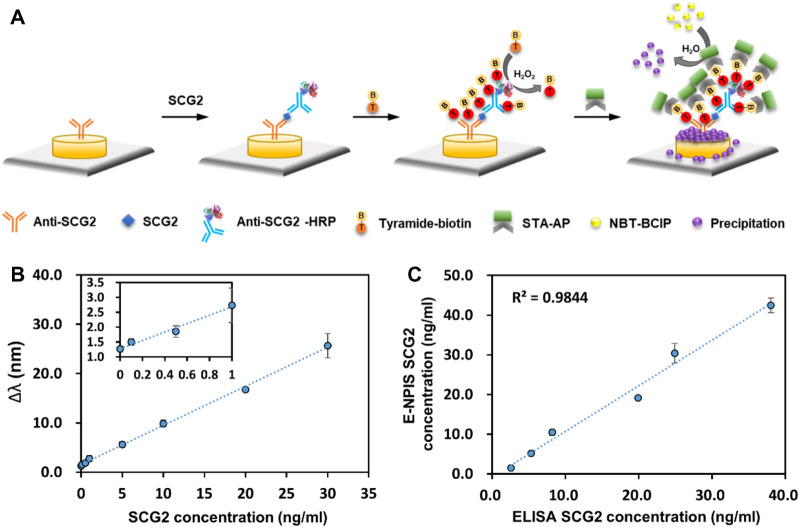
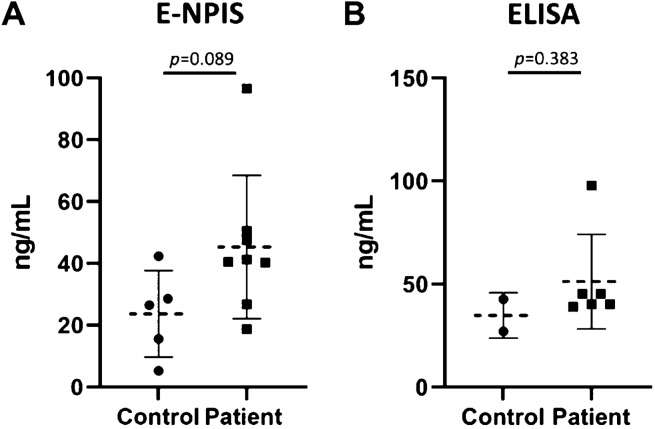
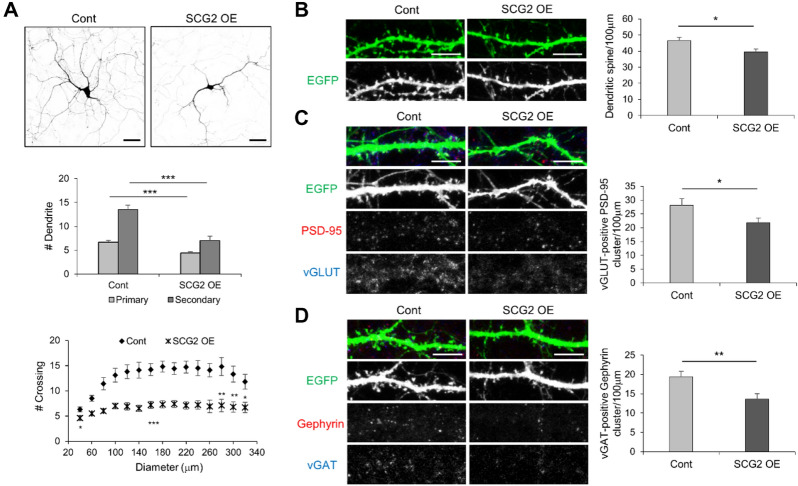
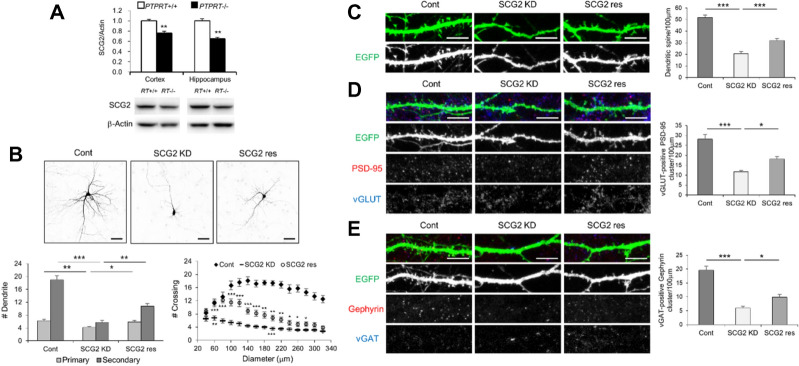
The neural circuits of the infant brain are rapidly established near 6 months of age, but neurodevelopmental disorders can be diagnosed only at the age of 2-3 years using existing diagnostic methods. Early diagnosis is very important to alleviate life-long disability in patients through appropriate early intervention, and it is imperative to develop new diagnostic methods for early detection of neurodevelopmental disorders. We examined the serum level of secretogranin II (SCG2) in pediatric patients to evaluate its potential role as a biomarker for neurodevelopmental disorders. A plasmonic immunosensor performing an enzyme-linked immunosorbent assay (ELISA) on a gold nanodot array was developed to detect SCG2 in small volumes of serum. This nanoplasmonic immunosensor combined with tyramide signal amplification was highly sensitive to detect SCG2 in only 5 μL serum samples. The analysis using the nanoplasmonic immunosensor revealed higher serum SCG2 levels in pediatric patients with developmental delay than in the control group. Overexpression or knockdown of SCG2 in hippocampal neurons significantly attenuated dendritic arborization and synaptic formation. These results suggest that dysregulated SCG2 expression impairs neural development. In conclusion, we developed a highly sensitive nanoplasmonic immunosensor to detect serum SCG2, a candidate biomarker for the early diagnosis of neurodevelopmental disorders.
© 2021. The Author(s).
Conflict of interest statement
The authors declare no competing interests.
Figures
Similar articles
-
Publisher Correction: Nanoplasmonic immunosensor for the detection of SCG2, a candidate serum biomarker for the early diagnosis of neurodevelopmental disorder.Sci Rep. 2021 Dec 16;11(1):24386. doi: 10.1038/s41598-021-03378-6. Sci Rep. 2021. PMID: 34916556 Free PMC article. No abstract available.
-
The secretogranin II gene is a signal integrator of glutamate and dopamine inputs.J Neurochem. 2014 Jan;128(2):233-45. doi: 10.1111/jnc.12467. Epub 2013 Oct 24. J Neurochem. 2014. PMID: 24111984
-
REST Regulates Non-Cell-Autonomous Neuronal Differentiation and Maturation of Neural Progenitor Cells via Secretogranin II.J Neurosci. 2015 Nov 4;35(44):14872-84. doi: 10.1523/JNEUROSCI.4286-14.2015. J Neurosci. 2015. PMID: 26538656 Free PMC article.
-
The Potential Role of miRNAs as Predictive Biomarkers in Neurodevelopmental Disorders.J Mol Neurosci. 2021 Jul;71(7):1338-1355. doi: 10.1007/s12031-021-01825-7. Epub 2021 Mar 27. J Mol Neurosci. 2021. PMID: 33774758 Review.
-
A Novel Way to Measure and Predict Development: A Heuristic Approach to Facilitate the Early Detection of Neurodevelopmental Disorders.Curr Neurol Neurosci Rep. 2017 May;17(5):43. doi: 10.1007/s11910-017-0748-8. Curr Neurol Neurosci Rep. 2017. PMID: 28390033 Free PMC article. Review.
Cited by
-
Spatial multi-omics at subcellular resolution via high-throughput in situ pairwise sequencing.Nat Biomed Eng. 2024 Jul;8(7):872-889. doi: 10.1038/s41551-024-01205-7. Epub 2024 May 14. Nat Biomed Eng. 2024. PMID: 38745110
-
Hippocampal gray matter volume alterations in patients with first-episode and recurrent major depressive disorder and their associations with gene profiles.BMC Psychiatry. 2025 Feb 15;25(1):134. doi: 10.1186/s12888-025-06562-4. BMC Psychiatry. 2025. PMID: 39955494 Free PMC article.
-
Sustainable Integration of Nanobiosensors in Biomedical and Civil Engineering: A Comprehensive Review.ACS Omega. 2025 Jun 10;10(24):25120-25157. doi: 10.1021/acsomega.5c00852. eCollection 2025 Jun 24. ACS Omega. 2025. PMID: 40584327 Free PMC article. Review.
-
Altered Cerebrospinal Fluid Proteins in Smith-Lemli-Opitz Syndrome.J Proteome Res. 2025 Aug 1;24(8):4154-4165. doi: 10.1021/acs.jproteome.5c00282. Epub 2025 Jul 9. J Proteome Res. 2025. PMID: 40631482 Free PMC article.
-
FTO inhibition mitigates high-fat diet-induced metabolic disturbances and cognitive decline in SAMP8 mice.Mol Med. 2025 Feb 21;31(1):73. doi: 10.1186/s10020-025-01126-4. Mol Med. 2025. PMID: 39984825 Free PMC article.
References
-
- Diagnostic and Statistical Manual of Mental Disorders: DSM-5. 5th ed. Arlington, VA. American Psychiatric Association. 10.1176/appi.books.9780890425596 (2013).
-
- Yasui Y. A data-analytic strategy for protein biomarker discovery: Profiling of high-dimensional proteomic data for cancer detection. Biostatistics. 2003;4:449–463. - PubMed
Publication types
MeSH terms
Substances
Grants and funding
- ZYM9332111/Customized Manpower Training Project funded by the National Research Council of Science & Technology
- KGM5222113/KRIBB Initiative Research Program
- KGS1172113/KRIBB Initiative Research Program
- H-GUARD_2013M3A6B2078950/Global Frontier Project, National Research Foundation of Korea (NRF) funded by the Ministry of Science, ICT & Future Planning
- NRF-2015M3C7A1029113/Brain research program, National Research Foundation of Korea (NRF) funded by the Ministry of Science, ICT & Future Planning
LinkOut - more resources
Full Text Sources
Molecular Biology Databases
