Review
. 2022 Jan;23(1):53-66.
doi: 10.1038/s41583-021-00533-w. Epub 2021 Nov 23.

The probabilistic model of Alzheimer disease: the amyloid hypothesis revised

Affiliations
Review

The probabilistic model of Alzheimer disease: the amyloid hypothesis revised

Giovanni B Frisoni et al. Nat Rev Neurosci. 2022 Jan.

Abstract

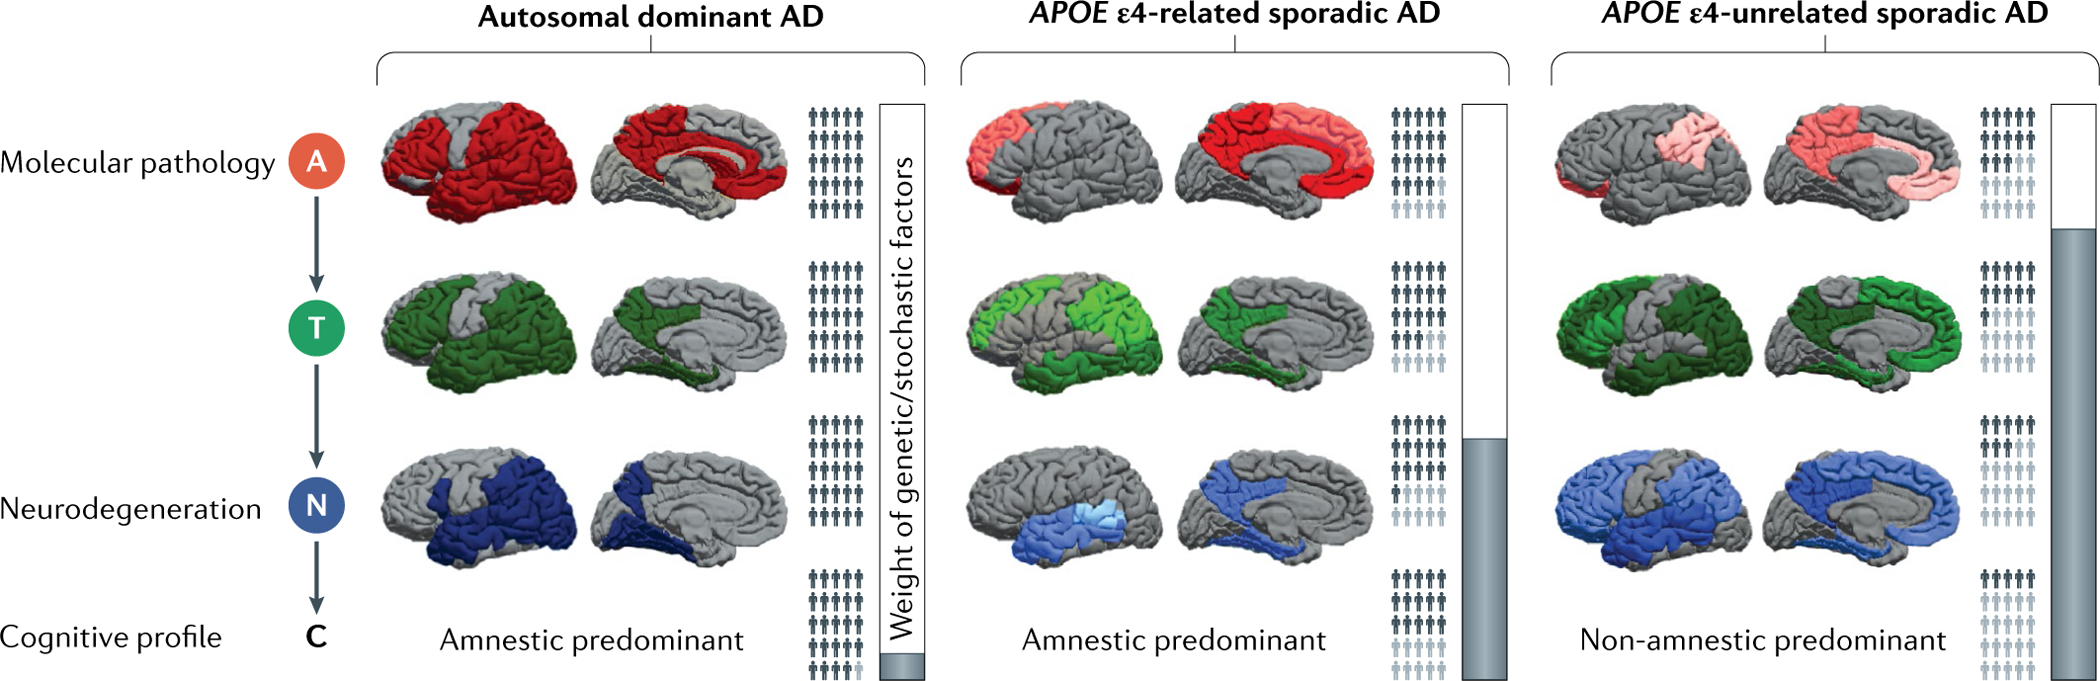
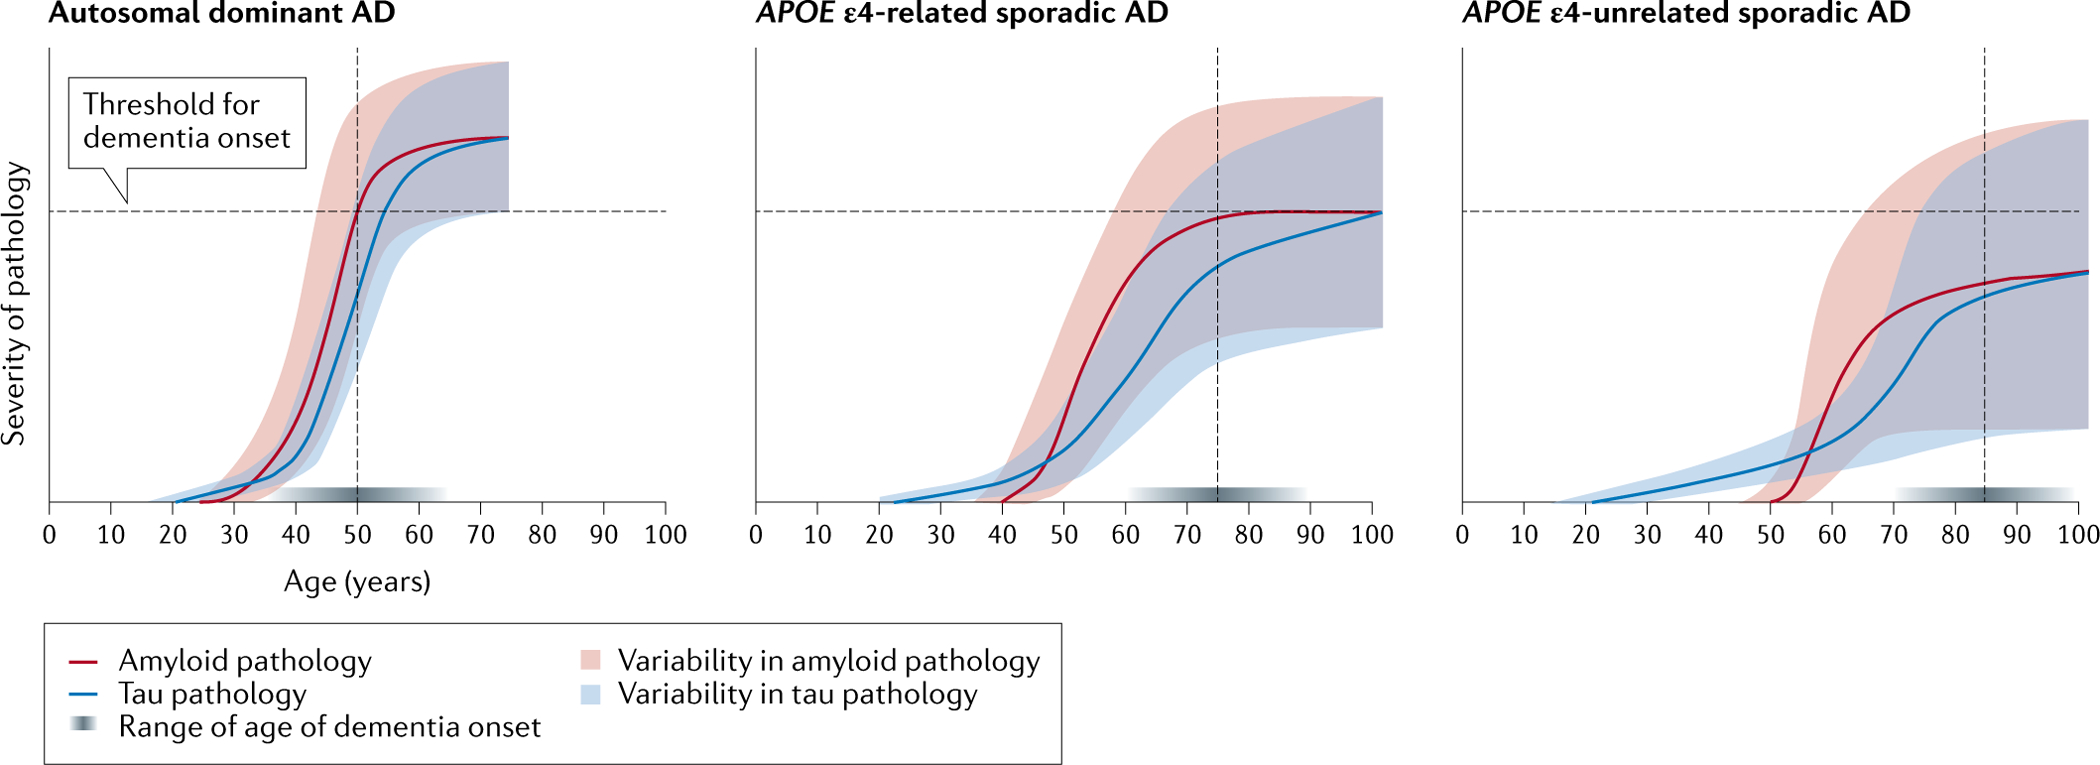
The current conceptualization of Alzheimer disease (AD) is driven by the amyloid hypothesis, in which a deterministic chain of events leads from amyloid deposition and then tau deposition to neurodegeneration and progressive cognitive impairment. This model fits autosomal dominant AD but is less applicable to sporadic AD. Owing to emerging information regarding the complex biology of AD and the challenges of developing amyloid-targeting drugs, the amyloid hypothesis needs to be reconsidered. Here we propose a probabilistic model of AD in which three variants of AD (autosomal dominant AD, APOE ε4-related sporadic AD and APOE ε4-unrelated sporadic AD) feature decreasing penetrance and decreasing weight of the amyloid pathophysiological cascade, and increasing weight of stochastic factors (environmental exposures and lower-risk genes). Together, these variants account for a large share of the neuropathological and clinical variability observed in people with AD. The implementation of this model in research might lead to a better understanding of disease pathophysiology, a revision of the current clinical taxonomy and accelerated development of strategies to prevent and treat AD.


Figures

Fig. 1 |
Fig. 1 |. The probabilistic model of Alzheimer disease.
We propose three Alzheimer disease (AD) variants — autosomal dominant AD, APOE ε4-related sporadic AD and APOE ε4-unrelated sporadic AD — on the basis of genetic backgrounds and featuring differences in lifetime risk of dementia, the influence of stochastic factors, topography and the burden of amyloid pathology (A), tau pathology (T), neurodegeneration (N) and cognitive symptoms (C). A, T and N burdens in various brain regions are represented by the intensity of red, green and blue, respectively, with darker colours indicating greater burden. The topography of pathology and its global burden are reported in TABLE 1. The relative burden within and between variants for A is based on REFS,, for T on REFS,– and for N on REFS–,. The proportions of dark and light grey people (affected and unaffected individuals, respectively) are approximate representations for the lifetime prevalence of A+, T+, N+ and cognitive impairment in the three AD variants. Autosomal dominant AD individuals almost invariably develop A, T, N and C. In sporadic AD, the interplay of APOE genotype with stochastic factors leads to a weaker cascade from A to T, N and C, resulting in fewer affected cases. The lifetime risk of dementia is very high (nearly 100%) in autosomal dominant AD, intermediate (22–95%,) in APOE ε4-related AD and low (7–35%,) in APOE ε4-unrelated AD. The vertical bars graphically denote the weight of genetic and stochastic factors (white and grey, respectively).
Fig. 2 |
Fig. 2 |. The lifetime dynamics of Aβ and tau in the three Alzheimer disease variants.
The curves represent the dynamics of Aβ (red) and tau (blue) deposition in the three Alzheimer disease (AD) variants. Age is shown on the x axis and the severity of the molecular pathology is shown on the y axis. The curves were generated by taking the dynamic biomarker model of Jack et al. as a template and warping it in accordance with evidence from the literature on the differences among autosomal dominant AD, APOE ε4-related sporadic AD and APOE ε4-unrelated sporadic AD regarding the following: the onset of Aβ and tau deposition (the intersections between the Aβ and tau curves with the x axis),, the rates of change of patholog (curve slopes), the age of symptom onset (dotted vertical lines),,, the varoability of Aβ and tau pathology among individuals (shaded areas), the crossing of the clinical symptom threshold (dotted horizontal lines),, and the range of age of dementia onset (horizontal shaded grey bar immediately above the x axis, where darker shades denote greater frequency density of the age of dementia onset). In the younger ages, the curve for tau lies above the Aβ curve to denote age-related tau deposition, which is thought to be necessary for Aβ to trigger further and extensive AD-related tau spread to neocortical areas,. The curves for Aβ and tau are steeper (denoting a more aggressive disease neurobiology) in autosomal dominant AD than in the APOE ε4-related and APOE ε4-unrelated sporadic variants. When the burdens of Aβ and tau pathologies reach a certain threshold, cognitive impairment becomes manifest. This occurs at around 50 years of age in autosomal dominant AD, 75 years in APOE ε4-related sporadic AD, and 85 years in APOE ε4-unrelated sporadic AD,. In all cases, in the final stages of the disease, the Aβ and tau curves reach a plateau. The intersection of the shaded areas with the threshold for dementia onset denotes the lifetime prevalence of dementia, with all individuals with autosomal dominant AD crossing the threshold at some point in their lifetime, while a minority of non-APOE ε4 carriers, and an intermediate proportion of APOE ε4 carriers, do. Solid population-based data on the age of onset in APOE ε4 carriers and APOE ε4 non-carriers are lacking. The data in the literature were either estimated retrospectively on the basis of proxy reports in diagnostic cohorts not representative of the general population or estimated in well-conducted prospective population-based studies that had small sample sizes. Indeed, the two largest population-based studies (the Rotterdam Study and the Framingham Study) comprised only 134 and 43 cases, respectively,. However, it is widely accepted that carrying the APOE ε4 allele reduces the age of onset by about 12 years. The curves for autosomal dominant AD are cut at around 60 years, assuming an average dementia duration of around 10 years. The shaded areas denote the predicted variability of individual trajectories of Aβ and tau pathologies based on the probabilistic model that we are proposing. The variability of trajectories is inversely proportional to the penetrance of genetic factors and directly proportional to the impact of stochastic factors: smaller in autosomal dominant AD, intermediate in the APOE ε4-related variant and largest in the APOE ε4-unrelated variant.

References

    1. Prince M et al. World Alzheimer Report 2015. The Global Impact of Dementia - An Analysis of Prevalence, Incidence, Cost and Trends. https://www.alzint.org/u/WorldAlzheimerReport2015.pdf (2015).
    1. Ballard C et al. Alzheimer’s disease. Lancet 377, 1019–1031 (2011). - PubMed
    1. Jack CR et al. NIA-AA research framework: toward a biological definition of Alzheimer’s disease. Alzheimers Dement 14, 535–562 (2018). - PMC - PubMed
    1. Hardy JA & Higgins GA Alzheimer’s disease: the amyloid cascade hypothesis. Science 256, 184–185 (1992). - PubMed
    1. Selkoe DJ & Hardy J The amyloid hypothesis of Alzheimer’s disease at 25 years. EMBO Mol. Med. 8, 595–608 (2016). - PMC - PubMed

Publication types