. 2021 Sep 27;11(20):9738-9751.
doi: 10.7150/thno.60902. eCollection 2021.

Osteoblast-derived EGFL6 couples angiogenesis to osteogenesis during bone repair

Affiliations

Osteoblast-derived EGFL6 couples angiogenesis to osteogenesis during bone repair

Kai Chen et al. Theranostics. .

Abstract

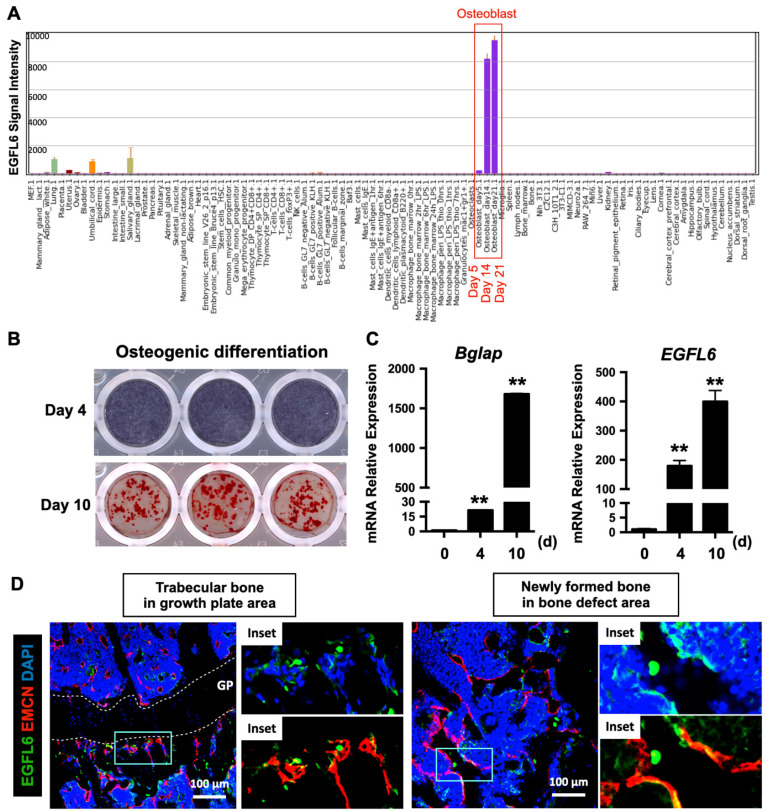
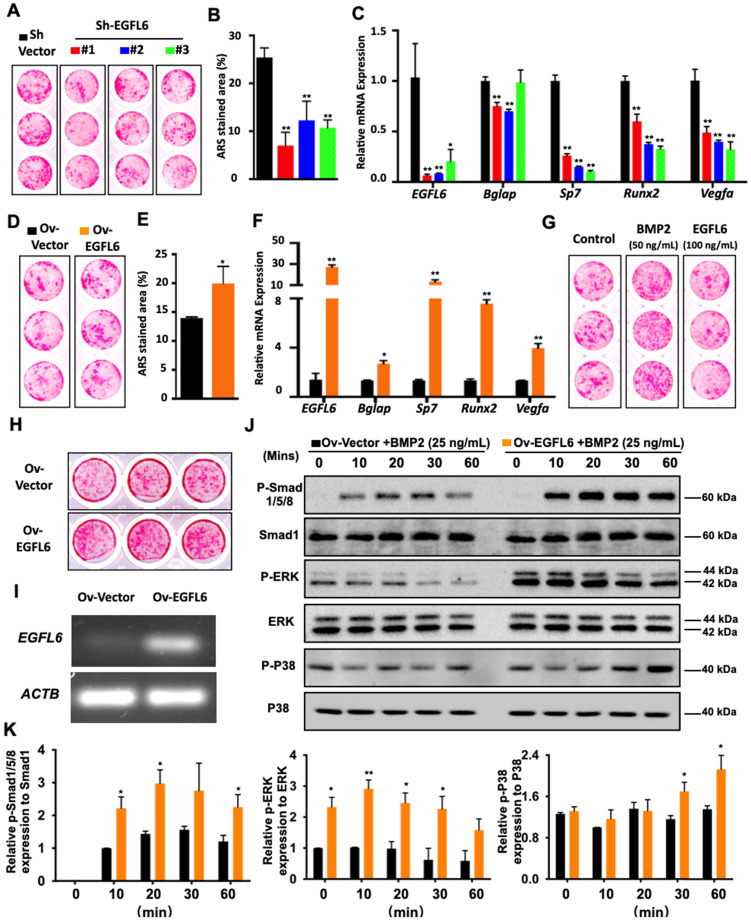
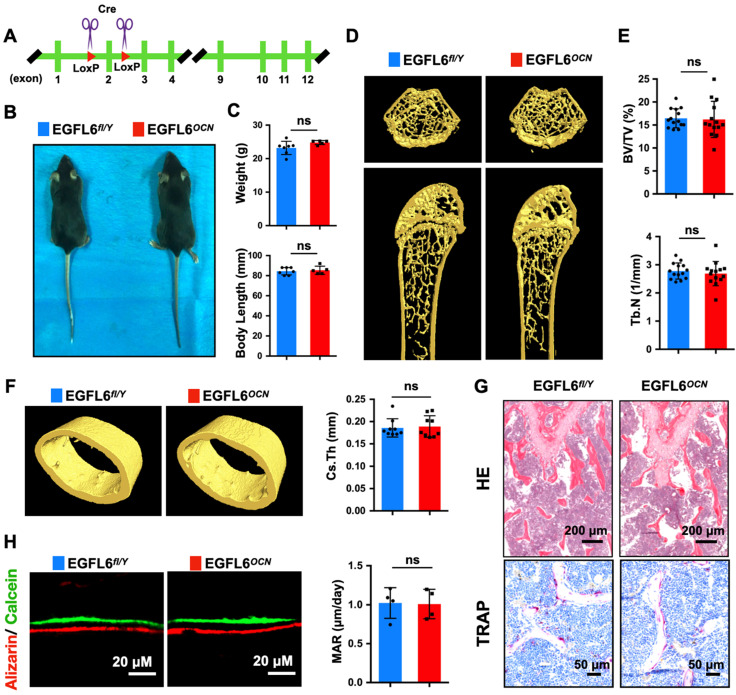
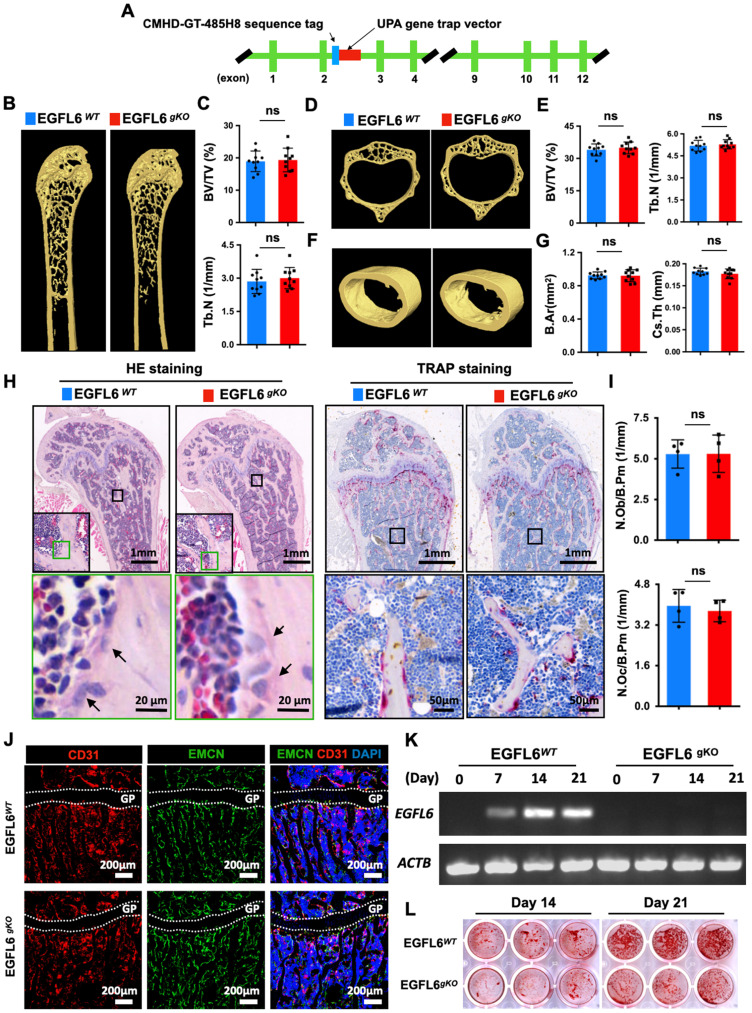
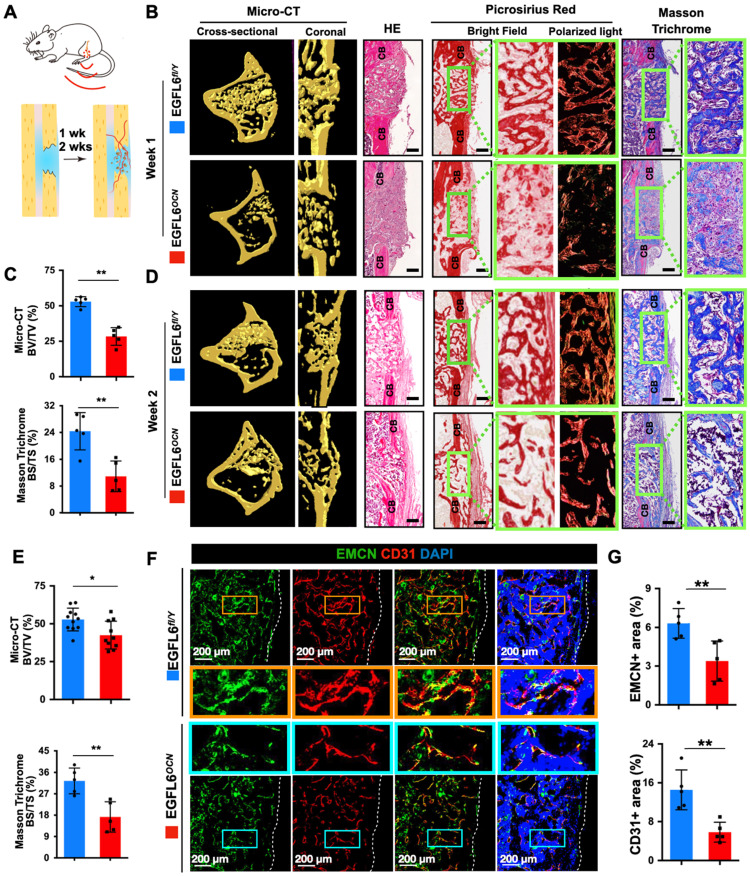
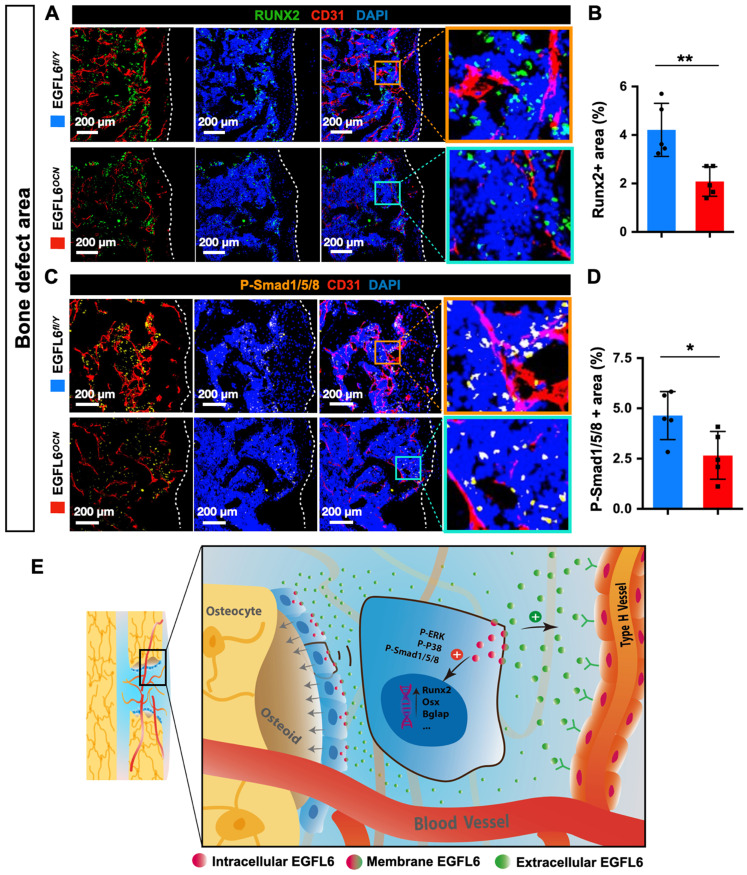
Rationale: Angiogenesis and osteogenesis are highly coupled processes which are indispensable to bone repair. However, the underlying mechanism(s) remain elusive. To bridge the gap in understanding the coupling process is crucial to develop corresponding solutions to abnormal bone healing. Epidermal growth factor-like protein 6 (EGFL6) is an angiogenic factor specifically and distinctively up-regulated during osteoblast differentiation. In contrast with most currently known osteoblast-derived coupling factors, EGFL6 is highlighted with little or low expression in other cells and tissues. Methods: In this study, primary bone marrow mesenchymal stem cells (MSCs) and osteoblastic cell line (MC3T3-E1) were transduced with lentiviral silencing or overexpression constructs targeting EGFL6. Cells were induced by osteogenic medium, followed by the evaluation of mineralization as well as related gene and protein expression. Global and conditional knockout mice were established to examine the bone phenotype under physiological condition. Furthermore, bone defect models were created to investigate the outcome of bone repair in mice lacking EGFL6 expression. Results: We show that overexpression of EGFL6 markedly enhances osteogenic capacity in vitro by augmenting bone morphogenic protein (BMP)-Smad and MAPK signaling, whereas downregulation of EGFL6 diminishes osteoblastic mineralization. Interestingly, osteoblast differentiation was not affected by the exogenous addition of EGFL6 protein, thereby indicating that EGFL6 may regulate osteoblastic function in an intracrine manner. Mice with osteoblast-specific and global knockout of EGFL6 surprisingly exhibit a normal bone phenotype under physiological conditions. However, EGFL6-deficiency leads to compromised bone repair in a bone defect model which is characterized by decreased formation of type H vessels as well as osteoblast lineage cells. Conclusions: Together, these data demonstrate that EGFL6 serves as an essential regulator to couple osteogenesis to angiogenesis during bone repair.

Keywords: EGFL6; angiogenesis; bone defect; bone repair; osteogenesis.


Conflict of interest statement

Competing Interests: The authors have declared that no competing interest exists.

Figures

Figure 1
Figure 1
EGFL6 is highly expressed during osteoblast differentiation and co-localizes with blood vessels in bone. (A) EGFL6 expression profiled from an array of normal tissues, organs, and cell lines in mice. Data is adapted from BioGPS (http://biogps.org/). Red box indicates the EGFL6 signal intensity in osteoblasts. (B) Alkaline phosphatase (ALP) staining and Alizarin Red S (ARS) staining showing the osteogenic differentiation of neonatal calvarial osteoblasts on day 4 and day 10 respectively. (C) qPCR analysis of osteogenic gene Bglap as well as EGFL6 during osteoblast differentiation (n = 3 per group). (D) Representative confocal images of the immunostaining of EGFL6 and endomucin (EMCN) in 12-week-old male mice tibiae and bone defect area. Growth plate (GP) is indicated with white dashed line. All data are presented as mean ± SD. **P < 0.01 relative to the control group. Differences are analyzed using Student's t-test.
Figure 2
Figure 2
EGFL6 mediates osteoblast differentiation through BMP-Smad and MAPK signaling pathways. (A) Alizarin Red S (ARS) staining of mesenchymal stem cells (MSCs) transduced with lentiviral EGFL6 shRNA or a vector control and induced osteogenic differentiation for 14 days. (B) Quantification of ARS-stained area of (A) (n = 3 per group). (C) qPCR analysis of mRNA expressions of EGFL6, Bglap (encoding osteocalcin), Sp7 (encoding osterix), Runx2, and Vegfa (n = 3 per group). (D) ARS staining of MSCs transduced with lentiviral EGFL6 overexpression vector or a vector control and induced osteogenic differentiation for 14 days. (E) Quantification of ARS-stained area of (D) (n = 3 per group). (F) qPCR analysis of mRNA expressions of EGFL6, Bglap, Sp7, Runx2, and Vegfa (n = 3 per group). (G) ARS staining of MSCs induced into mineralization in the absence or presence of BMP2 and EGFL6 protein. (H) ARS staining of the mineralization of MC3T3-E1 cells stably transduced with lentiviral EGFL6 overexpressing vector or a control vector (n = 3 per group). (I) Gel electrophoresis showing EGFL6 expression in MC3T3-E1 cells following osteogenic induction for 21 days. (J) Western Blot assay showing the proteins level of basal canonical (Smad) and non-canonical (MAPK) BMP signaling pathways including P-Smad 1/5/8, P-ERK, and P-P38 in MC3T3-E1 cells induced by BMP-2. (K) Quantifications of the band intensities of (J) (n = 3 per group). All bar graphs are presented as mean ± SD. *P < 0.05, **P < 0.01 relative to the control group. Differences are analyzed using Student's t-test.
Figure 3
Figure 3
Osteoblast-specific deletion of EGFL6 has no significant effect on bone phenotype. (A) Schematic illustration of the strategy used to generate the osteoblast - specific EGFL6 conditional knockout (cKO) mice. (B) Photographs of a 12-week-old male EGF6 conditional knockout mouse (EGFL6OCN) and its littermate control (EGFL6fl/Y). (C) Weight and body length of 12-week-old male EGFL6OCN mice (n = 5) and EGFL6fl/Y mice (n = 7). (D) Representative three-dimensional reconstructed micro-CT images showing the femurs 12-week-old male EGFL6OCN and EGFL6fl/Y mice. (E) Quantification of the trabecular bone parameters including bone volume per tissue volume (BV/TV) and trabecular number (Tb.N) (n = 14 per group). (F) Representative micro-CT images of cortical bone, and quantification of cross-sectional thickness (Cs.Th) of the cortical bone (n = 9 per group). (G) Representative hematoxylin-eosin (HE) and tartrate-resistant acid phosphatase (TRAP) staining of femurs. (H) Representative images of bone growth rates as determined by calcein and alizarin red labelling, and quantification of mineral apposition rate (MAR) (n = 4 per group). All bar graphs are presented as mean ± SD. ns, no significance. Differences are analyzed using Student's t-test.
Figure 4
Figure 4
EGFL6 global knockout (gKO) mice display normal bone phenotype. (A) Schematic illustration of the strategy used to generate the EGFL6 global knockout (gKO) mice. (B) Representative three-dimensional reconstructed micro-CT images showing the femurs of 24-week-old male EGFL6WT and EGFL6gKO mice. (C) Quantification of the trabecular bone parameters including bone volume per tissue volume (BV/TV) and trabecular number (Tb.N) (n = 10 per group). (D) Representative micro-CT images of lumbar 1 (L1) of EGFL6WT and EGFL6gKO mice, and (E) quantification of BV/TV and Tb.N of the trabecular bone (n = 10 per group). (F) Representative micro-CT images of cortical bone of EGFL6WT and EGFL6gKO mice, and (G) quantification of bone marrow area (B.Ar) and cross-sectional thickness (Cs.Th) of the cortical bone (n = 10 per group). (H) Representative hematoxylin-eosin (HE) and tartrate-resistant acid phosphatase (TRAP) staining of femurs of EGFL6WT and EGFL6gKO mice. Black arrows indicate osteoblasts. (I) Quantifications of number of osteoblast per bone perimeter (N.Ob/Pm) and number of osteoclast per bone perimeter (N.Oc/Pm). (J) Representative confocal images of type H vessel stained for CD31 (red) and EMCN (green) in tibia of EGFL6WT and EGFL6gKO mice. (K) EGFL6 gene expression in differentiating bone marrow mesenchymal stem cells (MSCs) derived from EGFL6WT and EGFL6gKO mice. (L) Alizarin red S (ARS) staining of mineralization of MSCs from EGFL6WT and EGFL6gKO mice. Growth plate is indicated with white dashed line. All bar graphs are presented as mean ± SD. ns, no significance. Differences are analyzed using Student's t-test.
Figure 5
Figure 5
Deletion of EGFL6 in osteoblasts leads to impaired bone repair characterized by reduced angiogenesis. (A) Schematic illustration of mono-cortical bone defect model. (B) Representative three-dimensional reconstructed micro-CT images of bone repair in EGFL6OCN and EGFL6fl/Y mice 1 week after surgical procedure, and bone histomorphometric analysis including hematoxylin-eosin (HE), picrosirius red (PSR), Masson trichrome staining of bone defect region. CB, cortical bone. Scale bar = 200 μm (C) Quantification of newly formed bone in defect region by micro-CT scanning and Masson trichrome staining (n = 5 per group). BV/TV, bone volume per tissue volume; BS/TS, bone surface and tissue surface. (D) Representative micro-CT and bone histomorphometric images of bone defect at week 2. Scale bar = 200 μm.(E) Quantification of the newly formed bone in defect region at week 2 by micro-CT scaning (WT, n = 11; cKO, n = 10) and Masson trichrome staining (n = 5 per group). (F) Representative confocal images of type H vessels stained for CD31 (red) and EMCN (green) in bone defect region of EGFL6OCN and EGFL6fl/Y mice at week 2. (G) Quantification of EMCN+ and CD31+ area in (F) (n = 5 per group). White dashed lines indicate the edge of bone tissue. All bar graphs are presented as mean ± SD. *P < 0.05, **P < 0.01 relative to the WT group. Differences are analyzed using Student's t-test.
Figure 6
Figure 6
EGFL6 deficiency reduced osteogenesis during bone repair. (A) Representative confocal images of immunofluorescence staining for Runx2 (green) and CD31 (red) in bone defect region of EGFL6OCN and EGFL6fl/Y mice at week 2. (B) Quantification of Runx2-positive area in (A) (n = 5 per group). (C) Representative confocal images of immunofluorescence staining for P-Smad1/5/8 (orange) and CD31 (red) in bone defect region. (D) Quantification of P-Smad1/5/8-positive area in (C) (n = 5 per group). (E) Schematic illustration of osteoblast derived EGFL6 which contributes to the coupling of osteogenesis and angiogenesis in bone repair. White dashed lines indicate the edge of bone tissue. *P < 0.05, **P < 0.01 relative to the WT group. Differences are analyzed using Student's t-test.

References

    1. Einhorn TA, Gerstenfeld LC. Fracture healing: mechanisms and interventions. Nat Rev Rheumatol. 2015;11:45–54. - PMC - PubMed
    1. Zura R, Xiong Z, Einhorn T, Watson JT, Ostrum RF, Prayson MJ. et al. Epidemiology of Fracture Nonunion in 18 Human Bones. JAMA Surg. 2016;151:e162775. - PubMed
    1. Gomez-Barrena E, Rosset P, Lozano D, Stanovici J, Ermthaller C, Gerbhard F. Bone fracture healing: cell therapy in delayed unions and nonunions. Bone. 2015;70:93–101. - PubMed
    1. Kusumbe AP, Ramasamy SK, Adams RH. Coupling of angiogenesis and osteogenesis by a specific vessel subtype in bone. Nature. 2014;507:323–8. - PMC - PubMed
    1. Ramasamy SK, Kusumbe AP, Wang L, Adams RH. Endothelial Notch activity promotes angiogenesis and osteogenesis in bone. Nature. 2014;507:376–80. - PMC - PubMed

Publication types

MeSH terms