. 2021 Oct 25;24(11):103337.
doi: 10.1016/j.isci.2021.103337. eCollection 2021 Nov 19.

Stabilin receptors clear LPS and control systemic inflammation

Affiliations

Stabilin receptors clear LPS and control systemic inflammation

Fatima Cabral et al. iScience. .

Abstract

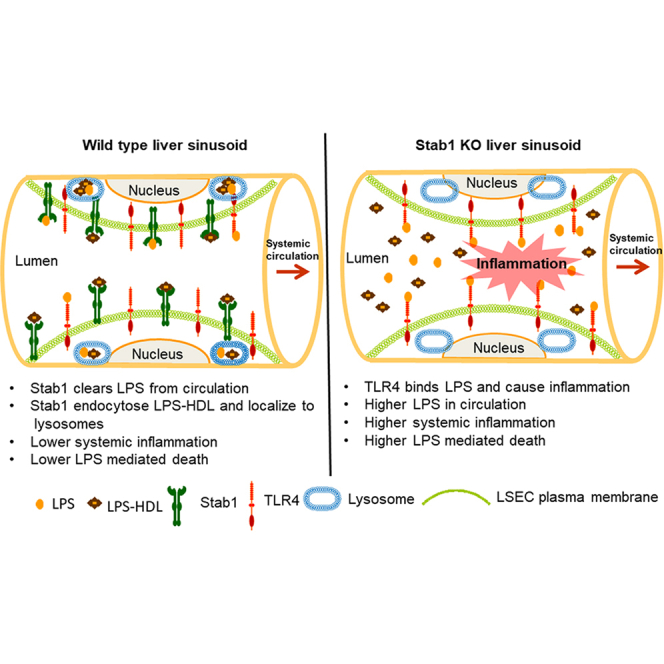
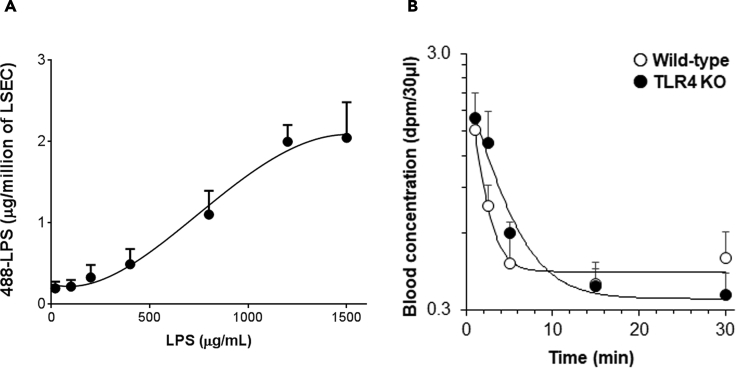
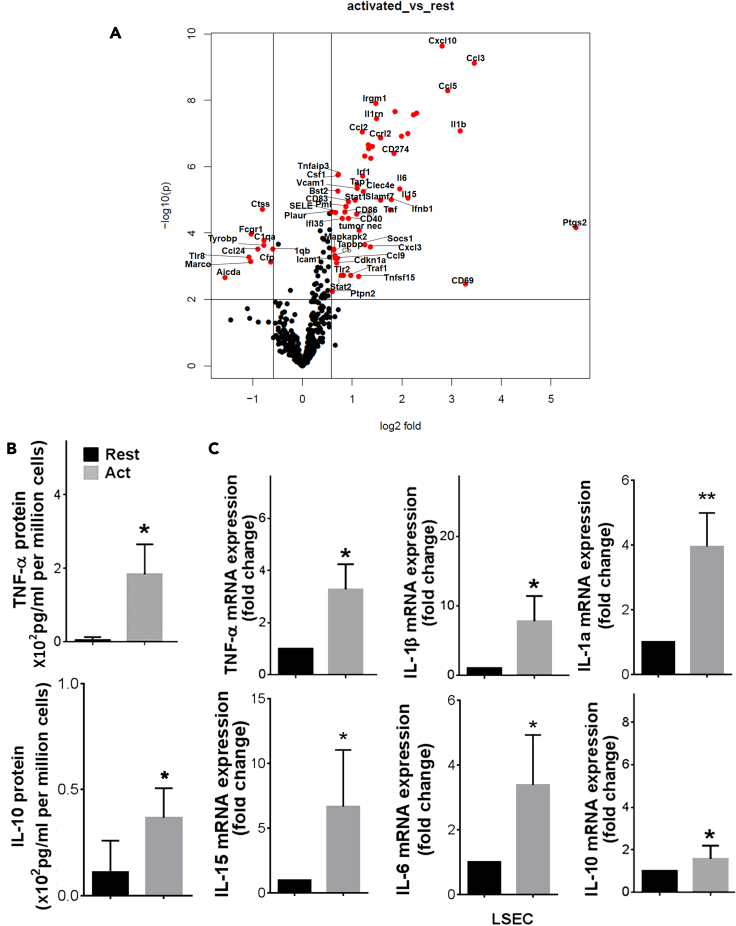
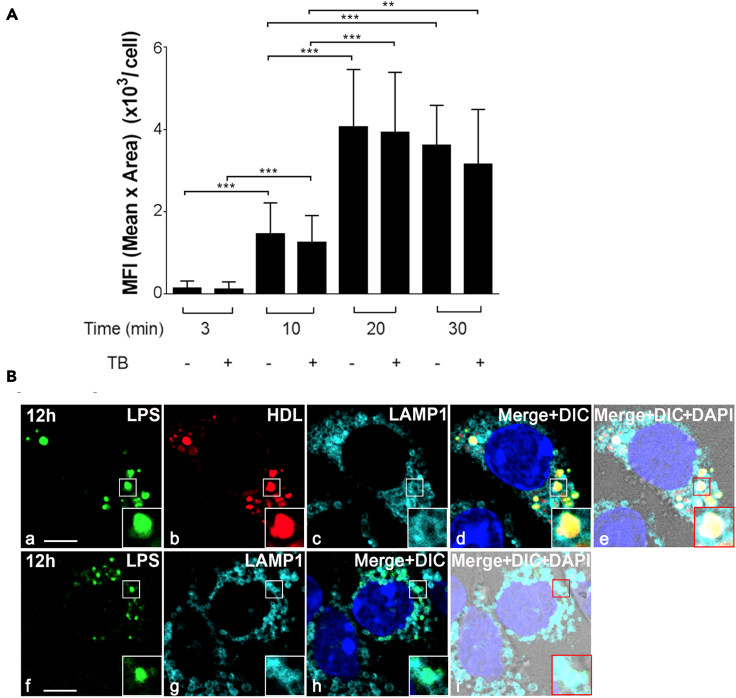
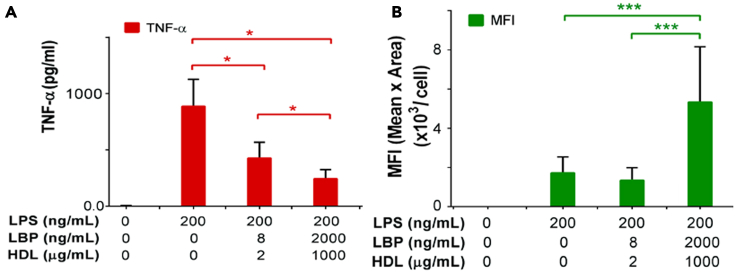
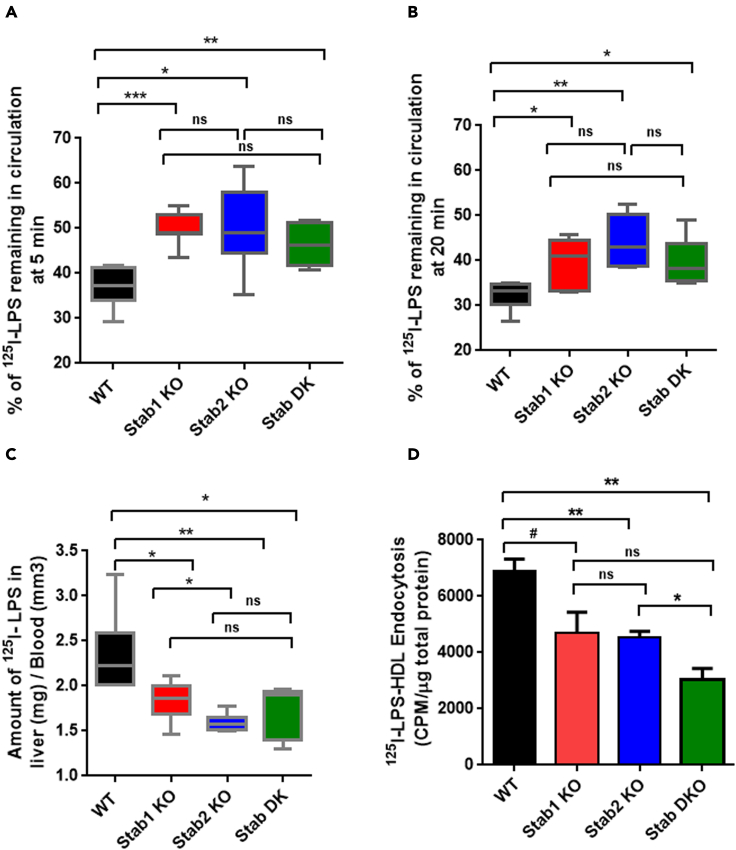
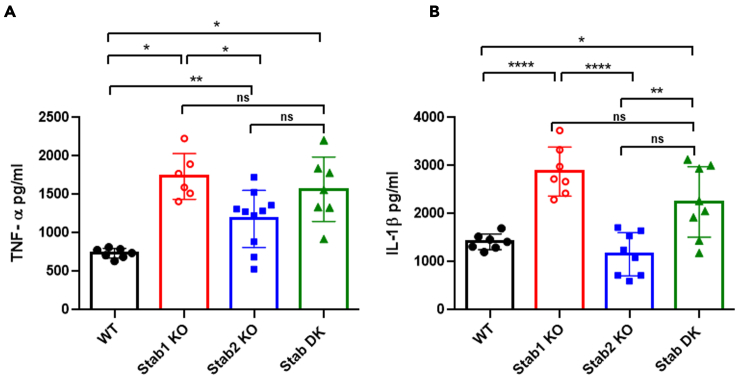
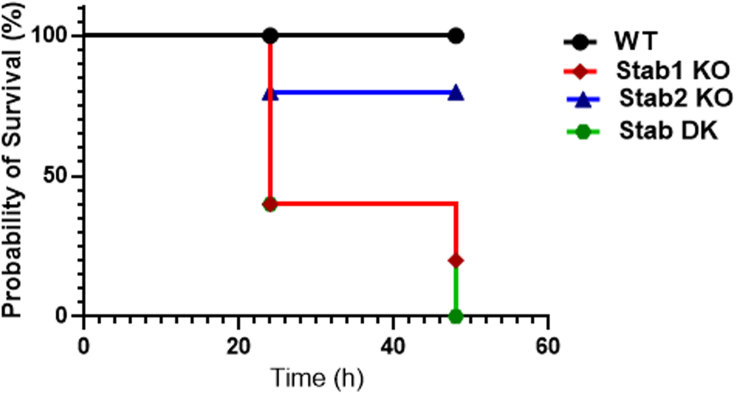
Lipopolysaccharides (LPSs) cause lethal endotoxemia if not rapidly cleared from blood circulation. Liver sinusoidal endothelial cells (LSEC) systemically clear LPS by unknown mechanisms. We discovered that LPS clearance through LSEC involves endocytosis and lysosomal inactivation via Stabilin-1 and 2 (Stab1 and Stab2) but does not involve TLR4. Cytokine production was inversely related to clearance/endocytosis of LPS by LSEC. When exposed to LPS, Stabilin double knockout mice (Stab DK) and Stab1 KO, but not Stab2 KO, showed significantly enhanced systemic inflammatory cytokine production and early death compared with WT mice. Stab1 KO is not significantly different from Stab DK in circulatory LPS clearance, LPS uptake and endocytosis by LSEC, and cytokine production. These data indicate that (1) Stab1 receptor primarily facilitates the proactive clearance of LPS and limits TLR4-mediated inflammation and (2) TLR4 and Stab1 are functionally opposing LPS receptors. These findings suggest that endotoxemia can be controlled by optimizing LPS clearance by Stab1.

Keywords: Biological sciences; Immune response; Molecular biology.


Conflict of interest statement

The authors declare no competing interests.

Figures

None
Graphical abstract
Figure 1
Figure 1
Clearance of LPS by LSEC is via a receptor-mediated mechanism; however, TLR4 is not involved in the rapid clearance of LPS by LSEC (A) Plot for 488-LPS bound to LSEC in a dose-dependent manner versus concentration of 488-LPS along with excess of unlabeled LPS, HDL, and LBP incubated at 37°C for 1 h. (B) The curve plots the remainder of 3H/14C double-labeled LPS in blood circulation versus time in WT C57BL/6 and TLR4-KO mice at various time points after intravenous (IV) infusion. Each data point represents the mean and SD of data from three mice/biological replicates. The figures represent two different experiments.
Figure 2
Figure 2
TLR4 is weakly expressed in the liver compared with all major internal organs, but LSEC and KC express TLR4 similar to professional macrophages (A) An ECL-developed immunoblot using rabbit anti-mouse TLR4 Ab showing TLR4 expression in spleen lysates of WT C57BL/6 and TLR4-KO mouse, RAW 264.7 and HEK cell line lysates prepared as described in materials and methods. (B) Reprobe of A showing ECL-developed immunoblot of mouse anti-GAPDH antibody as a loading control. (C) An ECL-developed immunoblot using rabbit anti-mouse TLR4 Ab showing TLR4 expression in major organ lysates of BALB/c mice and standard RAW cell lysates. (D) Bar graph expressing the means and SD of TLR4 expression distributed to each organ, shown in C, after factoring total weight of the organ. (E) An ECL-developed immunoblot using rabbit anti-mouse TLR4 Ab showing TLR4 expression in major organ lysates of C57BL/6 mice and standard RAW cell lysates. (F) Bar graph expressing the means and SD of TLR4 expression distributed to each organ, shown in E after factoring total weight of the organ. (G) An ECL-developed immunoblot using rabbit anti-mouse TLR4 Ab showing TLR4 expression in different liver cell lysates of C57BL/6 mice. (H) A reprobe of G showing the expression of GAPDH. The numbers depicted represent the MW for each respective band in kDa. Each figure is a representative image from three mice, and the bar graph compiles data from three mice. Values of all significant correlations are given with degree of significance manner versus concentration of 488-LPS along with indicated ∗p < 0.05.
Figure 3
Figure 3
LSEC produce both pro-inflammatory and anti-inflammatory cytokines in response to TLR4 (A) Volcano plot showing expression of differentially expressed transcript of purified mouse LSEC that were stimulated with LPS or left untreated for 6 h and the cell free culture supernatants were harvested and the cells were lysed in TRizol. Total RNA was extracted, and the mRNA samples were analyzed using NanoString assay on the mouse Pan cancer Immune panel, followed by data analysis in nSolver software. (B) The amount of TNF-α and IL10 cytokine levels in the supernatant were determined by ELISA. (C) The graphs shown are the fold change of TNF-α, IL-1β, IL-1α, IL-15, IL-6, and IL10 mRNA of untreated samples. Values of all significant correlations are given with degree of significance indicated. ∗p < 0.005.
Figure 4
Figure 4
LSEC endocytose the LPS-HDL complex and localize to lysosomes (A) Bar graph showing endocytosis of 488 LPS-HDL by LSEC over the course of time with and without trypan blue (TB). (B) Four-color fluorescence microscopic image of 488-LPS plus 594-HDL complex (top row) or 488 LPS (bottom row) endocytosed by LSEC at 12 h. (a) Green puncta identify 488-LPS particles. (b) Red puncta identify 594-HDL. (c) Blue rings are lysosomes marked with anti-LAMP1 antibody. (d) Merged panels a, b, c and DAPI (blue). (e) Merged image of d plus DIC. (f) Green puncta identify 488-LPS particles. (g) Blue rings are lysosomes marked with anti-LAMP1 antibody. (h) Merged panels f, g and DAPI (blue). (i) Merged image of h plus DIC. The scale bar in panels a and f represents 10 μm. The zoomed-in portion of LSEC is shown in the bottom right-hand portion as inset. Values of all significant correlations are given with degree of significance indicated. ∗∗p < 0.01, ∗∗∗p < 0.001 by Student t test.
Figure 5
Figure 5
HDL facilitates the endocytosis of LPS and inhibits the cytokine production by LSEC (A) Quantification of TNF-α concentration in the supernatant of LSEC that were incubated with different doses of LPS along with same concentration of LPS Binding Protein (LBP) and HDL for 6 h. The LSEC were incubated with two different concentrations of HDL and LBP. (B) Quantification of 488-LPS endocytosis with different doses of HDL/LBP from live-cell confocal fluorescence images by measuring the total pixel area and the mean fluorescence intensity of green puncta associated with LSEC. Values of all significant correlations are given with degree of significance indicated. ∗p < 0.05, ∗∗∗p < 0.001 by Student t-test.
Figure 6
Figure 6
Lack of Stabilin receptors results in diminished systemic LPS clearance, liver uptake of LPS, and endocytosis of LPS-HDL by LSEC. (A) The bar graph plots the remaining of 125I-labeled LPS in blood circulation in WT, Stab1, Stab2 KO, and Stab DK at 5 min after IV infusion. Each data point represents the mean and SD of data from five to seven mice/biological replicates. The figure represents three different experiments. (B) The bar graph plots the remaining of 125I-labeled LPS in blood circulation at 20 min after IV infusion. Each data point represents mean and SD of data from six to seven mice/biological replicates. The figure represents three different experiments. (C) The bar graph plots the amount of 125I-labeled LPS in the liver over blood in WT, Stab1, Stab2 KO, and Stab DK at 20 min. Each data point represents the mean and SD of data from six to seven mice/biological replicates. The figure represents three different experiments. (D) Quantification of 125I-LPS-HDL endocytosis by LSEC from C57BL/6 and Stab-1 and Stab-2 KO mice after 120 min. Values of all significant correlations are given with degree of significance indicated. ∗p < 0.05, ∗∗p < 0.01, ∗∗∗p < 0.001 by Student t-test. The # indicates p value of 0.06. The ns indicates non significant.
Figure 7
Figure 7
Lack of Stabilin receptors results in enhanced systemic inflammatory cytokine production The bar graph plots (A) Levels of cytokine TNF-α and (B). Levels of cytokine IL-1β in the serum of mice infused with 2 mg/kg LPS for 2 h and determined by ELISA. Each data point represents mean and SD of data from 6 to 10 mice/biological replicates. The figure represents two different experiments. Values of all significant correlations (p < 0.05) are given with degree of significance indicated. ∗p < 0.05, ∗∗p < 0.01, ∗∗∗p < 0.001, ∗∗∗∗p < 0.0001 and ns denotes non significant by Student t test.
Figure 8
Figure 8
Lack of Stab receptors leads to early mortality in mice infused with LPS Wild type (C57BL/6), Stab1, Stab2 KO, and Stab DK were challenged with 10 mg/kg LPS. The weight loss and survival of the mice were monitored every 6 h until 48 h. Results are expressed as Kaplan-Meier curves. Differences in survival between the two groups at a time were tested using the log-rank test. These data are representative of three independent experiments, which showed the same trend, and each line represents data from five to eight mice per group. The p value of the overall representative survival curve based on the log rank (Mantel-Cox) test is 0.043. In the representative survival curve, the p value between Stab1 and Stab2 was 0.117, between WT and Stab1 was 0.028, between WT and Stab2 was 0.3173, between WT and DK was 0.009, between Stab1 and DK was 0.601, and between Stab2 and DK was 0.045.

Similar articles

Cited by

References

    1. Aderem A., Ulevitch R.J. Toll-like receptors in the induction of the innate immune response. Nature. 2000;406:782–787. - PubMed
    1. Anwar M.A., Shah M., Kim J., Choi S. Recent clinical trends in toll-like receptor targeting therapeutics. Med. Res. Rev. 2018;39:1053–1090. - PMC - PubMed
    1. Aravindhan V., Mohan V., Arunkumar N., Sandhya S., Babu S. Chronic endotoxemia in subjects with type-1 diabetes is seen much before the onset of microvascular complications. PLoS One. 2015;10:e0137618. - PMC - PubMed
    1. Arias-Alpizar G., Koch B., Hamelmann N.M., Neustrup M.A., Paulusse J.M.J., Jiskoot W., Kros A., Bussmann J. Stabilin-1 is required for the endothelial clearance of small anionic nanoparticles. Nanomedicine. 2021;34:102395. - PubMed
    1. Berg R.D. The indigenous gastrointestinal microflora. Trends Microbiol. 1996;4:430–435. - PubMed