. 2021 Oct 30;24(11):103386.
doi: 10.1016/j.isci.2021.103386. eCollection 2021 Nov 19.

Noncanonical protease-activated receptor 1 regulates lymphatic differentiation in zebrafish

Affiliations

Noncanonical protease-activated receptor 1 regulates lymphatic differentiation in zebrafish

Daoxi Lei et al. iScience. .

Abstract

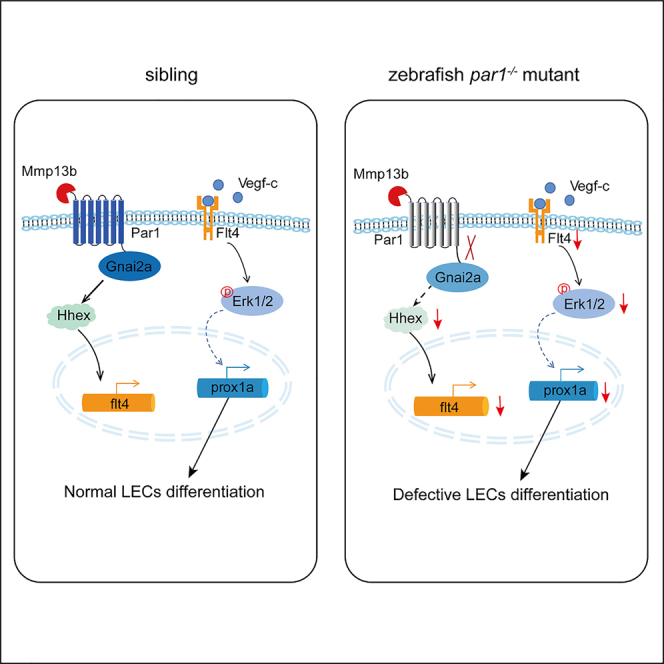
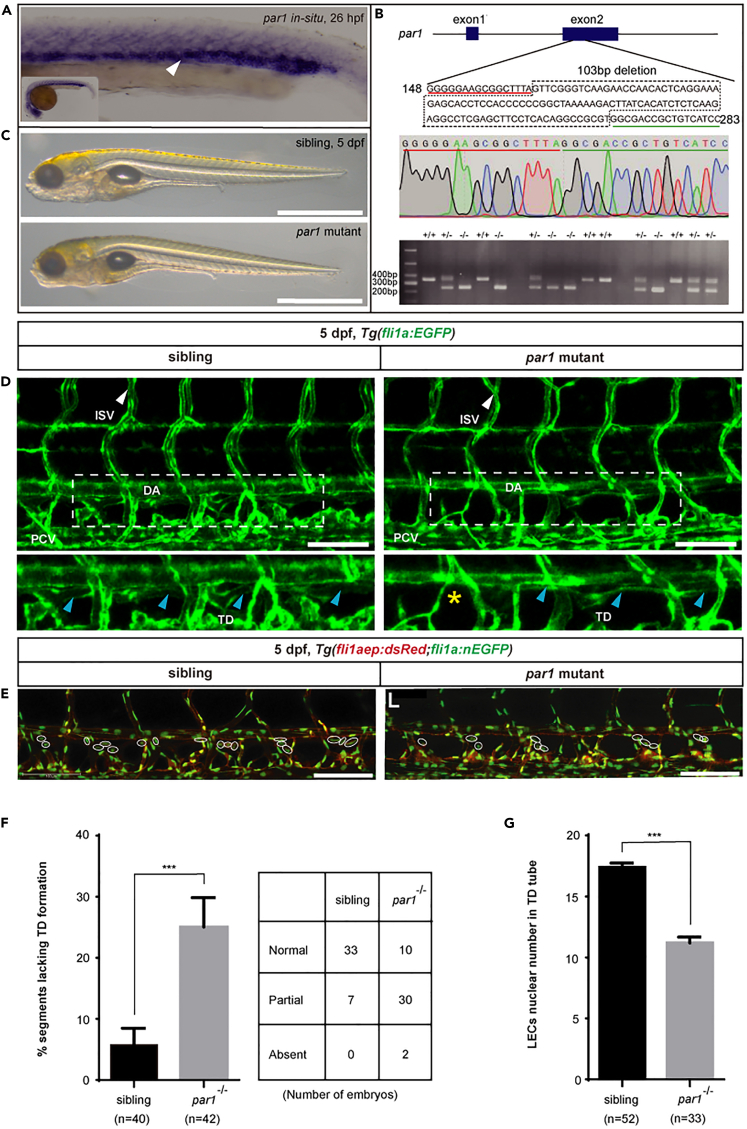
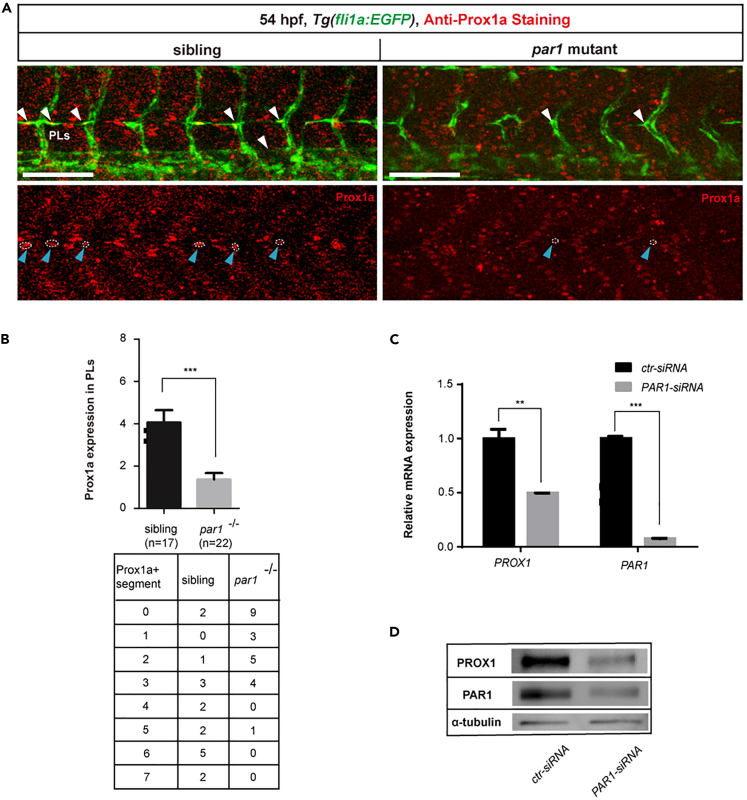
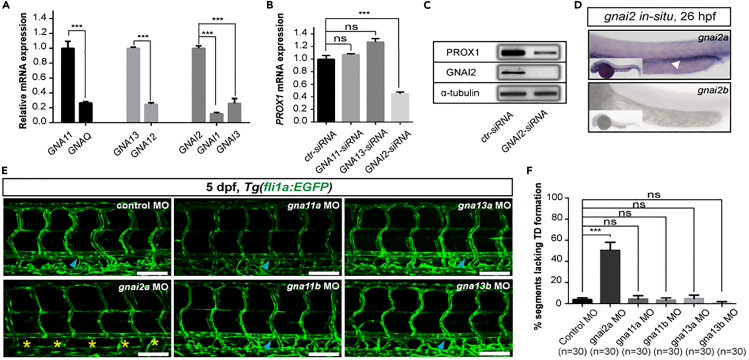
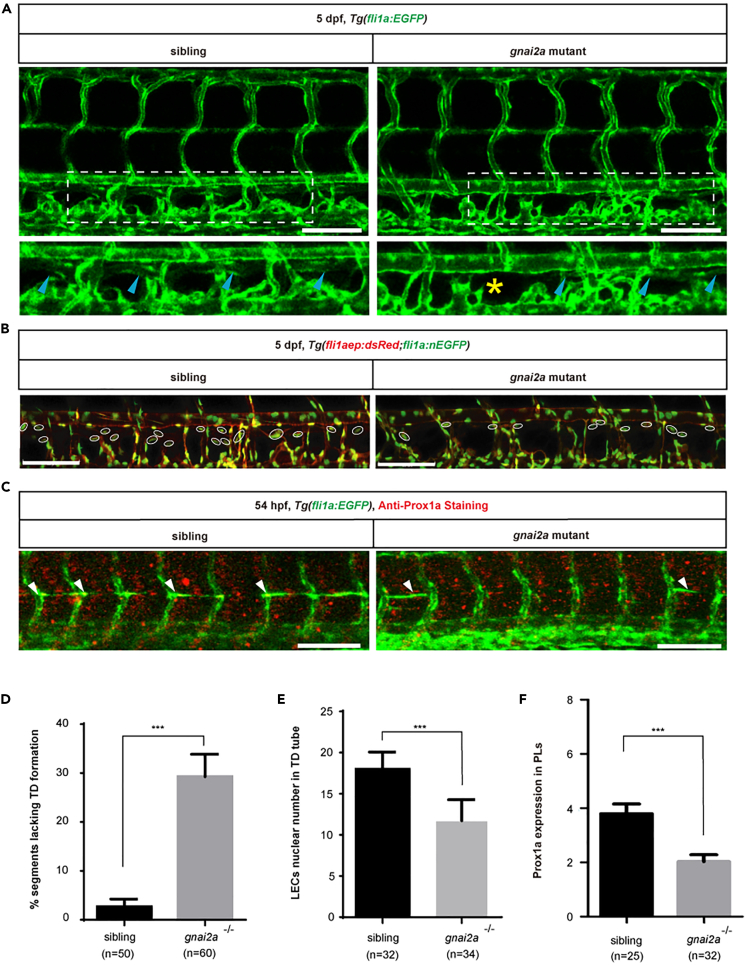
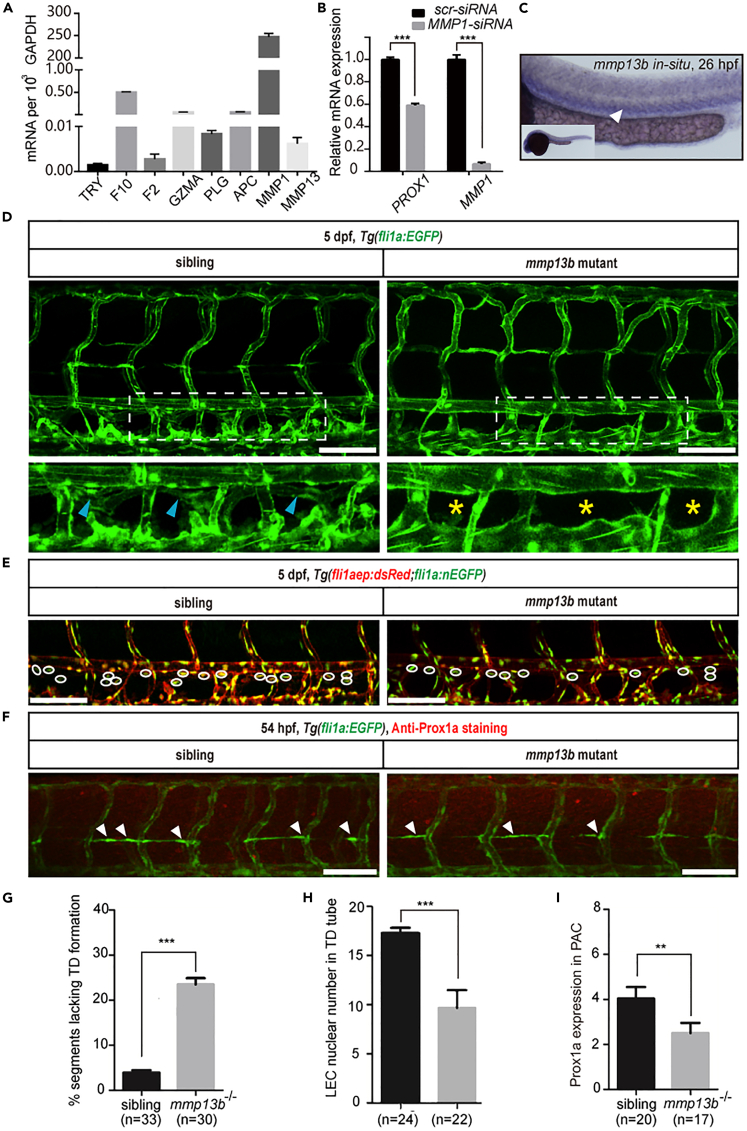
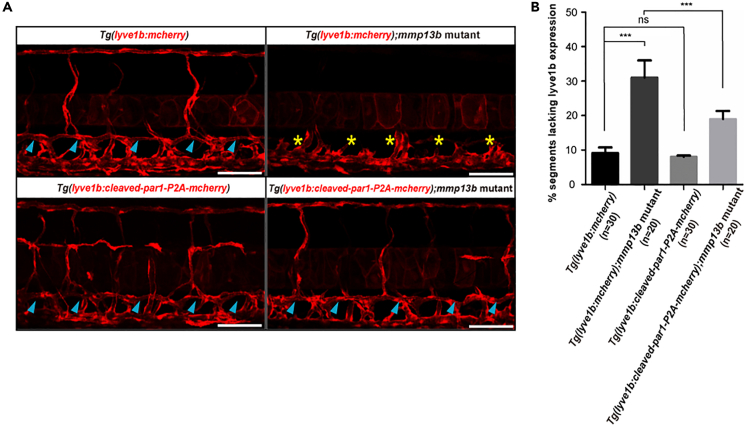
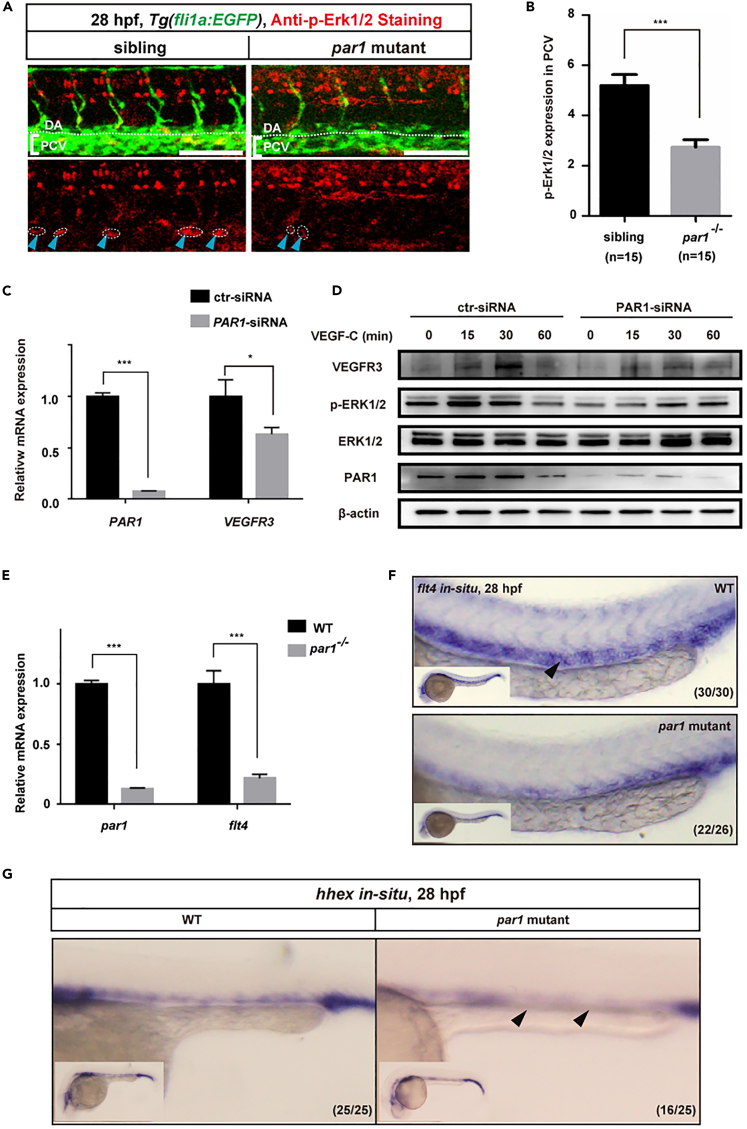
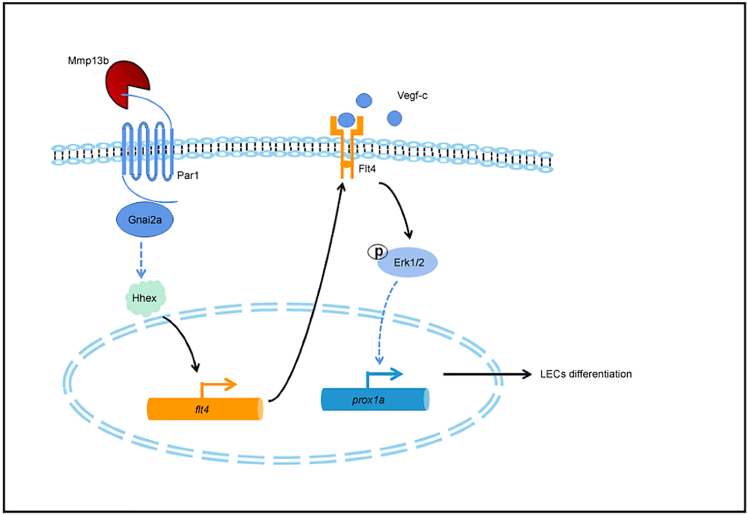
The differentiation of lymphatic progenitors is a crucial step in lymphangiogenesis. However, its underlying mechanism remains unclear. Here, we found that noncanonical protease-activated receptor 1 (par1) regulates the differentiation of lymphatic progenitors in zebrafish embryos. Loss of par1 function impaired lymphatic differentiation by downregulating prox1a expression in parachordal lymphangioblasts and caused compromised thoracic duct formation in zebrafish. Meanwhile, the G protein gnai2a, a par1 downstream effector, was selectively required for lymphatic development in zebrafish, and its mutation mimicked the lymphatic phenotype observed in par1 mutants. Interestingly, mmp13, but not thrombin, was required for lymphatic development in zebrafish. Furthermore, analyses of genetic interactions confirmed that mmp13b serves as a par1 upstream protease to regulate lymphatic development in zebrafish embryos. Mechanistically, par1 promotes flt4 expression and phospho-Erk1/2 activity in the posterior cardinal vein. Taken together, our findings highlight a function of par1 in the regulation of lymphatic differentiation in zebrafish embryos.

Keywords: Biological sciences; Immunology; Molecular biology.


Conflict of interest statement

The authors declare that there is no conflict of interest.

Figures

None
Graphical abstract
Figure 1
Figure 1
par1 mutant zebrafish embryos show defective TD formation (A) WISH of par1 gene expression in zebrafish embryos at 26 hpf. The white arrowhead indicates the expression of the par1 gene in the PCV. (B) Brightfield lateral views of sibling and par1 homozygous mutant zebrafish embryos at 5 dpf. Scale bars: 1 mm. (C) Top row, schematic representation of the generated par1 zebrafish mutant; middle, results of sequencing for validating par1 mutants; bottom, DNA gel results for genotyping wildtype (+/+), heterozygous (+/−), and homozygous mutant (−/−) embryos. (D) Confocal images showing TD formation of sibling and par1 homozygous mutants using the Tg(fli1a:EGFP) line at 5 dpf. Blue arrowheads indicate the presence of TD formation in each somite; yellow asterisks represent the absence of TD formation in each somite; DA and PCV areas are denoted. Scale bars: 100 μm. (E) Confocal images showing the nuclear numbers of LECs in the TD tube in Tg(fli1aep:dsRed;fli1:nEGFP) siblings and par1 zebrafish mutants at 5 dpf. White circles indicate the presence of LECs nuclear numbers in the TD tube. Scale bars: 100 μm. (F) Percentage of somites lacking TDs in siblings (n = 40 embryos) and par1 homozygous mutants (n = 42 embryos); 6 somites/embryos were used for quantification. Right is the table showing the number of embryos with normal TD, partial TD, and without TD, respectively. (G) LECs nuclear number in the TD tube of siblings (n = 52 embryos) and par1 homozygous mutants (n = 33 embryos); 6 somites/embryos were used for quantification. In (F) and (G), values represent means ± SEMs. ∗p ≤ 0.001 in the Student's t test. See also Figure S1.
Figure 2
Figure 2
par1 is required for lymphatic differentiation in zebrafish embryos (A) Immunostaining of prospero homeobox protein-1a (Prox1a) in Tg(fli1a:EGFP) siblings and par1 homozygous mutants at 54 hpf. White arrowheads indicate the presence of parachordal lymphangioblasts (PLs) sprouting in each somite; blue arrowheads with white dashed lines represent positive Prox1a staining in PLs. Scale bars: 100 μm. (B) Prox1a-positive PLs in siblings (n = 17 embyos) and par1 homozygous mutants (n = 22 embryos) at 54 hpf; 7 somites/embryos were used for quantification. Table shows the number of prox1a-positive segment per 7 somites in each embryo. (C) Relative mRNA expression of PROX1 and PAR1 in human dermal lymphatic endothelial cells (HDLECs) after ctr-siRNA (control) and PAR1-siRNA transfection. (D) Western blot analysis of PROX1 and PAR1 expression upon PAR1 knockdown in HDLECs. In (C and D), values represent means ± SEMs. ∗p ≤ 0.01, ∗∗p ≤ 0.001 in the Student's t test.
Figure 3
Figure 3
gnai2a is selectively required for lymphatic development in zebrafish embryos (A) Relative mRNA expression of different G-protein-coupled receptors in HDLECs. (B) Relative mRNA expression of PROX1 in HDLECs upon transfection with ctr-siRNA (control), GNA11-siRNA, GNA13-siRNA, and GNAI2-siRNA. (C) Western blot analysis of PROX1 and GNAI2 expression upon GNAI2 knockdown in HDLECs. (D) WISH of gnai2a gene expression (upper) and gnai2b gene expression (below) at 26 hpf in zebrafish embryos. The white arrowhead indicates the PCV area. (E) Confocal images showing TD formation in Tg(fli1a:EGFP) injected with 4 ng control MO, 4 ng gnai2a MO, 4 ng gnai11a MO, 4 ng gnai11b MO, 4 ng gna13a MO, and 4 ng gna13b MO at 5 dpf. Scale bars: 100 μm. (F) Percentage of somites lacking TD formation. For each group, 30 embryos were quantified, and 6 somites/embryo were used for quantification. In (A), (B), and (F), values represent means ± SEMs. ∗p ≤ 0.001; ns, not significant in Student's t test.
Figure 4
Figure 4
gnai2a mutant mimics the lymphatic phenotypes observed in the par1 mutant (A) Confocal images showing TD formation in Tg(fli1a:EGFP) siblings and gnai2a homozygous mutants at 5 dpf. Blue arrowheads indicate TD formation in each somite; yellow asterisks represent the absence of TD formation in each somite. Scale bars: 100 μm. (B) Confocal images showing LECs nuclear numbers in the TD tube of siblings and gnai2a homozygous mutants in the Tg(fli1aep:dsRed;fli1:nEGFP) line at 5 dpf. White circles indicate the presence of LECs nuclear numbers in the TD tube. Scale bars: 100 μm. (C) Immunostaining of Prox1a of siblings and gnai2a homozygous mutants in the Tg(fli1a:EGFP) line at 54 hpf. White arrowheads indicate positive Prox1a staining in PLs. Scale bars: 100 μm. (D) Percentage of somites lacking TD formation in siblings (n = 50) and gnai2a homozygous mutants (n = 60 embryos); 6 somites/embryos were used for quantification. (E) LEC nuclear number in the TD tube of siblings (n = 32) and gnai2a homozygous mutants (n = 34 embryos); 6 somites/embryos were used for quantification. (F) Prox1a-positive PLs of siblings (n = 25) and gnai2a homozygous mutants (n = 32 embryos) at 54 hpf; 7 somites/embryos were used for quantification. In (D–F), values represent means ± SEMs. ∗p ≤ 0.001 in the Student's t test. See also Figures S2–S4.
Figure 5
Figure 5
mmp13b mutant mimics the lymphatic phenotypes observed in the par1 mutant (A) Relative mRNA expression of different PAR1 proteases in HDLECs. (B) Relative mRNA expression of PROX1 and MMP1 in HDLECs after ctr-siRNA (control) and MMP1-siRNA transfection. (C) WISH of mmp13b gene expression in zebrafish at 26 hpf. The white arrowhead indicates the expression of the mmp13b gene in the PCV area. (D) Confocal images showing TD formation in Tg(fli1a:EGFP) siblings and mmp13b homozygous mutants at 5 dpf. Blue arrowheads indicate TD formation in each somite; yellow asterisks represent the absence of TD formation in each somite; DA and PCV areas are denoted. Scale bars: 100 μm. (E) Confocal images showing LECs nuclear numbers in the TD tube of siblings and mmp13b homozygous mutants in the Tg(fli1aep: dsRed;fli1:nEGFP) line at 5 dpf. White circles indicate the presence of LECs nuclear numbers in the TD tube. Scale bars: 100 μm. (F) Immunostaining of Prox1a of siblings and mmp13b homozygous mutants in the Tg(fli1a:EGFP) line at 54 hpf. White arrowheads indicate Prox1a-positive staining in the PLs. Scale bars: 100 μm. (G) Percentage of somites lacking TD formation in siblings (n = 33 embryos) and mmp13b homozygous mutants (n = 30 embryos); 6 somites/embryos were used for quantification. (H) LEC nuclear numbers in the TD tube of siblings (n = 24 embryos) and mmp13b homozygous mutants (n = 22 embryos); 6 somites/embryos were used for quantification. (I) Prox1a-positive PLs in siblings (n = 20 embryos) and mmp13b homozygous mutants (n = 17 embryos) at 54 hpf; 7 somites/embryos were used for quantification. In (G–I), values represent means ± SEMs. ∗p ≤ 0.01, ∗∗p ≤ 0.001 in Student's t test. See also Figures S5 and S6.
Figure 6
Figure 6
Overexpression of cleaved par1 recovers the lymphatic phenotypes observed in mmp13b zebrafish mutants (A) Confocal images showing TD formation of siblings and mmp13b homozygous mutants in the Tg(lyve1b:mcherry) line and Tg(lyve1b:cleaved-par1-P2A-mcherry) line at 5 dpf. Blue arrowheads indicate TD formation in each somite; yellow asterisks represent the absence of TD formation in each somite. Scale bars: 100 μm. (B) Percentage of somites lacking TD formation in siblings with the Tg(lyve1b:mcherry) line (n = 30 embryos), mmp13b homozygous mutants with the Tg(lyve1b:mcherry) line (n = 20 embryos), siblings with the Tg(lyve1b:cleaved-par1-P2A-mcherry) line (n = 30 embryos), and mmp13b homozygous mutants with the Tg(lyve1b:cleaved-par1-P2A-mcherry) line (n = 20 embryos); 6 somites/embryos were used for quantification. In (B), values represent means ± SEMs. ∗p ≤ 0.01, ∗∗p ≤ 0.001 in the Student's t test.
Figure 7
Figure 7
Loss of par1 function decreases p-Erk1/2 activity and flt4 expression in the PCV of zebrafish embryos (A) Immunostaining of phosphoErk1/2 (p-Erk1/2) activity in Tg(fli1a:EGFP) siblings and par1 homozygous mutants at 28 hpf. Blue arrowheads with white dashed lines indicate positive p-Erk1/2 staining; DA and PCV (in brackets) area are noted. Scale bars: 100 μm. (B) Quantification of p-Erk1/2 expression staining in the PCV of siblings (n = 15 embryos) and par1 mutants (n = 15 embryos); 8 somites/embryos were used for quantification. (C) Relative mRNA expression of VEGFR3 in HDLECs after ctr-siRNA (control) and PAR1-siRNA transfection. (D) Western blot analysis of p-ERK1/2 activity in HDLECs transfected with ctr-siRNA or PAR1-siRNA, followed by VEGFC treatment. (E) Relative mRNA expression of the flt4 gene in siblings and par1 homozygous zebrafish embryo mutants. (F) WISH of flt4 gene expression at 28 hpf in wild-type and par1 homozygous mutant embryos. The white arrowhead indicates the PCV area. (G) WISH of hhex gene expression at 28 hpf in wild-type and par1 mutant embryos. The white arrowhead indicates the PCV area. In (B, C, and, E), values represent means ± SEMs. ∗p ≤ 0.05, ∗∗p ≤ 0.001, ∗∗∗p ≤ 0.0001 in the Student's t test.
Figure 8
Figure 8
Work model The mmp13b-Par1-Gnai2a axis regulates flt4 expression in the PCV in early stage zebrafish embryos probably through hhex transcription factor, therefore indirectly regulating prox1a expression and promoting the differentiation of lymphatic trunk progenitors.

References

    1. Alberelli M.A., De Candia E. Functional role of protease activated receptors in vascular biology. Vascul. Pharmacol. 2014;62:72–81. doi: 10.1016/j.vph.2014.06.001. - DOI - PubMed
    1. Alitalo K. The lymphatic vasculature in disease. Nat. Med. 2011;17:1371–1380. doi: 10.1038/nm.2545. - DOI - PubMed
    1. Austin K.M., Nguyen N., Javid G., Covic L., Kuliopulos A. Noncanonical matrix metalloprotease-1-protease-activated receptor-1 signaling triggers vascular smooth muscle cell dedifferentiation and arterial stenosis. J. Biol. Chem. 2013;288:23105–23115. doi: 10.1074/jbc.M113.467019. - DOI - PMC - PubMed
    1. Cha Y.R., Fujita M., Butler M., Isogai S., Kochhan E., Siekmann A.F., Weinstein B.M. Chemokine signaling directs trunk lymphatic network formation along the preexisting blood vasculature. Dev. Cell. 2012;22:824–836. doi: 10.1016/j.devcel.2012.01.011. - DOI - PMC - PubMed
    1. Coughlin S.R. Protease-activated receptors in hemostasis, thrombosis and vascular biology. J. Thromb. Haemost. 2005;3:1800–1814. doi: 10.1111/j.1538-7836.2005.01377.x. - DOI - PubMed