. 2021 Sep 16;3(4):fcab215.
doi: 10.1093/braincomms/fcab215. eCollection 2021.

Lysosomal dysfunction impairs mitochondrial quality control and is associated with neurodegeneration in TBCK encephaloneuronopathy

Affiliations

Lysosomal dysfunction impairs mitochondrial quality control and is associated with neurodegeneration in TBCK encephaloneuronopathy

Jesus A Tintos-Hernández et al. Brain Commun. .

Abstract

Biallelic variants in the TBCK gene cause intellectual disability with remarkable clinical variability, ranging from static encephalopathy to progressive neurodegeneration (TBCK-Encephaloneuronopathy). The biological factors underlying variable disease penetrance remain unknown. Since previous studies had suggested aberrant autophagy, we tested whether mitophagy and mitochondrial function are altered in TBCK -/- fibroblasts derived from patients exhibiting variable clinical severity. Our data show significant accumulation of mitophagosomes, reduced mitochondrial respiratory capacity and mitochondrial DNA content, suggesting impaired mitochondrial quality control. Furthermore, the degree of mitochondrial dysfunction correlates with a neurodegenerative clinical course. Since mitophagy ultimately depends on lysosomal degradation, we also examined lysosomal function. Our data show that lysosomal proteolytic function is significantly reduced in TBCK -/- fibroblasts. Moreover, acidifying lysosomal nanoparticles rescue the mitochondrial respiratory defects in fibroblasts, suggesting impaired mitochondrial quality control secondary to lysosomal dysfunction. Our data provide insight into the disease mechanisms of TBCK Encephaloneuronopathy and the potential relevance of mitochondrial function as a biomarker beyond primary mitochondrial disorders. It also supports the benefit of lysosomal acidification strategies for disorders of impaired lysosomal degradation affecting mitochondrial quality control.

Keywords: intellectual disability; lysosome; mitochondria; mitophagy; neurodegeneration.


Figures

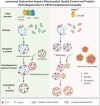
Graphical Abstract
Graphical Abstract
Figure 1
Figure 1
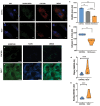
Mitophagy is upregulated in TBCKE fibroblasts. Confocal live imaging of human fibroblasts at baseline culture conditions, stained with Lysotracker red and Mitotracker green. Control (a) versus TBCKE (p.R126X) fibroblasts (b) are shown. TBCKE cells exhibit robust colocalization, a marker of mitophagy, scale bars =10 µm, inset 2 µm. Weighted colocalization coefficient (c) means plotted for fibroblast lines [2 controls, 3 TBCK p. R126X lines, Two-way ANOVA, F(1,85) = 33.72, P < 0.0001). Lysosomal content (d) was significantly increased, quantified as lysostracker positive particles per cell (nuclei) in live confocal images. Data obtained from in 3 independent experiments, analysed 2 plates per cell line, n ≥ 8 images per line analysed using ZenBlue (controls = 0969, 2037; TBCK = 126-2, 126-3, 126-5). Mean lysotracker positive particle area per cell line plotted [two-way ANOVA F(1,45) =14.48, P = 0.004). Analysing the lysotracker positive mean particle size using the same images is shown in e. Lysosomal size was significantly increased in TBCKE cells versus controls, Two-way ANOVA, F(1,46) = 5.699, P = 0.0211. LAMP1 immunostaining was also quantified as a marker of lysosomal content by flow cytometry (f), TBCKE cells had significantly increased LAMP1 mean fluorescence intensity compared to control cells n = 2 control lines and 3 TBCK lines, with 3 technical replicates per line [Two-way ANOVA, F(1,11) = 18.54, P = 0.0012).
Figure 2
Figure 2
TBCKE fibroblasts have reduced mitochondrial DNA and respiratory function. mtDNA copy number (a) in four independent patient-derived lines homozygous for theTBCK Boricua variant (p.R126X, 126-1, 126-3, 126-5) normalized to controls (n = 2 lines) show nearly 30% reduction in mtDNA copy number, (mean 73.1%, SD ± 6.13 nested two-tailed t-test, t3 = 4.41, P = 0.0216). (b) Expression of PGC1α, a key modulator of mitochondrial biogenesis is also decreased in TBCK−/− cells relative to controls (mean 0.55 SD ± 0.17, unpaired two-tailed t4 = 4.4, P = 0.0116, mean of 3 different experiments plotted). Seahorse assays (n ≥ 4 96-well plate assays) of TBCK−/− fibroblasts (p.R126X) normalized to controls show (c) reduced baseline mitochondrial respiration (mean 0.66 SD ± 0.19, unpaired two-tailed t-test, t12 = 4.56, P = 0.0007) as well as (d) reduced FCCP stimulated maximal respiratory capacity (mean 0.53 SD ± 0.14 controls, unpaired two-tailed t-test, t10 = 8.08, P < 0.0001).
Figure 3
Figure 3
Reduced mitochondrial respiratory capacity and mtDNA correlate with severity of neurologic phenotype in TBCKE. Mitochondrial oxygen consumption rate (OCR) of control compared to TBCK/ patient lines with mild (blue) versus severe (red) neurologic phenotypes. Both ‘mild’ and ‘severe’ groups included fibroblasts lines derived from at least 3 individual patients (see Supplementary Table 1 for details and genotypes). Panel a shows representative seahorse assay OCR tracing, plotted OCR values are mean ± SEM of minimum 10 wells per genotype. OCR values corresponding to mean for each cell line baseline respiration (b) and FCCP stimulated maximal respiratory capacity (c) are shown (n = 3 cell lines per genotype). Data analysed with two-way ANOVA with Tukey multiple comparisons test [For Baseline OCR F(2,108) = 86.13, P < 0.0001; for Maximal OCR F(2,108) = 278.9, P < 0.0001). mtDNA content (d), (normalized to nuclear gene B2M) also correlates with severity of neurologic phenotype, with mild TBCK patients exhibiting similar mtDNA copy number as controls while severe Boricua patients (p.R126X) have significantly decreased mtDNA copy number. Each qPCR sample was run in triplicate with n > 2 cell lines per genotype (except exon 21 del, only have 1 patient line available), in 2 independent experiments. Each value plotted represents mean of the technical triplicate for mtDNA copy number per cell line. Data analysed with one-way ANOVA with Dunnett’s multiple comparison’s test [F(3,21) = 10.58, P = 0.0002). Mitochondrial content per cell (e), assayed by immunostaining of mitochondrial outer membrane protein porin (VDAC) staining quantifed by flow cytometry, does not significantly differ in control versus TBCK−/− lines [One-way ANOVA, with Tukey’s multiple comparison’s test, F(2,4) = 0.3766, P = 0.7082] n ≥ 2 cell lines per genotype, mean fluorescence intensity for VDAC was assayed in a minimum of 10 000 cells per sample, each cell line in duplicate. No significant difference found between groups (One-way ANOVA with Tukey’s Multiple Comparisons test) Flow data analysed with FlowJo and plotted with Graphpad prism. Reactive oxygen species (ROS) elvels assayed by CellRox quantified by plate reader (f). n = 3 cell lines assayed per genotype, with 8 technical replicates each. Data analysed grouped per genotype, Two-way ANOVA with Tukey’s multiple comparison’s test [F(2, 63) = 24.70, P < 0.0001). Control versus Mild TBCK, P = 0.0005, Control versus TBCK severe P < 0.0001, TBCK mild versus TBCK severe P =0.0106.
Figure 4
Figure 4
Lysosomal dysfunction in TBCKE fibroblasts. Lysosomal proteolytic activity visualized by live confocal imaging of DQ-BSA treated control (a) versus TBCK−/− (b) fibroblasts suggest reduced proteolytic activity in patient cells (decreased green DQ-BSA fluorescence and reduced colocalization with lysosomes in red). DQ-BSA fluorescence is dependent on lysosomal proteolytic cleavage. Panel c shows quantification of DQ-BSA by flow cytometry, Mean Fluorescence Intensity per cell line plotted for n ≥ 2 cell lines per genotype (control, mild TBCK or severe TBCK). Each cell line assayed in triplicate and mean per cell line plotted [Two-way ANOVA with Tukey’s Multiple Comparison tests, F(2,4) = 6.357; control versus mild TBCK non-significant, control versus severe TBCK P = 0.0054, Mild versus Severe TBCK P < 0.0001]. Panel d shows quantification of cathepsin D enzyme activity using a fluorometric plate reader assay in control versus TBCK p. R126X (severe); n ≥ 2 independent cell lines per genotype (2 control lines and 4 TBCK lines), with each reaction ran in triplicate, mean per each cell line plotted [Two-way ANOVA, F(1,20) =7.578, P = 0.0123]. Neutral lipid (BODIPY493), green, and filipin (cyan) costain in control (e) versus TBCK−/− (p.R126X, f) cells showing increased lipid droplets and unesterified cholesterol accumulation in TBCKE fibroblasts. Scale bar = 10 µm. Quantification by plate reader for both filipin (g) and BODIPY493 (h). For filipin data, n = 2 cell lines per genotype, per experiment, with 6 technical replicates per line per plate. Data were normalized to protein content per well and mean signal intensity of control line (8400) per plate. Data shown from 3 independent experiments (plates), mean per cell line plotted for each experiment [Two-way ANOVA F(1,65) = 46.42, P < 0.0001]. For Neutral lipid quantification of BODIPY, data shown is for 2 independent experiments with n = 2 control and 2 TBCK lines per experiment (6 technical replicates per line) assayed by plate reader. Absorbance 493/503 nm was normalized to protein content per well and then normalized to mean control line signal per plate, mean per cell line per experiment plotted [Two-way ANOVA F(1,43) = 27.06, P < 0.001].
Figure 5
Figure 5
Lysosomal acidification rescues mitochondrial respiratory defects in TBCKE fibroblasts. Control and TBCK−/− fibroblasts were treated for 3 days with acidifying nanoparticles (NP, Penn nanoparticle core) and mitochondrial respiration assayed as previously using seahorse XF96 instrument. Mean oxygen consumption tracing as percent from baseline shown in a (left) for control lines (n = 2) versus TBCK fibroblasts (n = 3 lines). Each data point represents the mean OCR% for >4 wells per cell line and grouped per genotype. Right: Mean maximal OCR (as % of baseline, MAX OCR%) values for control lines showed no change in respiratory capacity after NP treatment, while maxOCR% in TBCK fibroblasts treated with NP was restored to control levels [One-way ANOVA with Tukey multiple comparisons test, F(3,56) = 5.69, P = 0.0018, for control versus TBCK P = 0.0273, for TBCK versus TBCK+NP P = 0.0067, control versus TBCK+NP P = 0.99]. Panel b shows control fibroblasts treated with nile-red nanoparticles (also from Penn nanoparticle core) colocalized with lysotracker green, verifying that NP are incorporated into the lysosomes (scale bar = 5 µm).

References

    1. Wallace DC. Bioenergetic origins of complexity and disease. Cold Spring Harb Symp Quant Biol. 2011;76:1. - PMC - PubMed
    1. Menzies FM, Fleming A, Rubinsztein DC.. Compromised autophagy and neurodegenerative diseases. Nat Rev Neurosci. 2015;16(6):345–357. - PubMed
    1. Whyte LS, Lau AA, Hemsley KM, Hopwood JJ, Sargeant TJ.. Endo-lysosomal and autophagic dysfunction: A driving factor in Alzheimer's disease? J Neurochem. 2017;140(5):703–717. - PubMed
    1. Schon E, Przedborski S.. Mitochondria: The next (neurode)generation. Neuron. 2011;70(6):1033–1053. - PMC - PubMed
    1. Chong JX, Caputo V, Phelps IG, et al. University of Washington Center for Mendelian Genomics. Recessive inactivating mutations in TBCK, encoding a Rab GTPase-activating protein, cause severe infantile syndromic encephalopathy. Am J Hum Genet. 2016;98(4):772–781. - PMC - PubMed

LinkOut - more resources