Meta-Analysis
. 2022 Feb;13(1):86-99.
doi: 10.1002/jcsm.12783. Epub 2021 Nov 23.

Global prevalence of sarcopenia and severe sarcopenia: a systematic review and meta-analysis

Affiliations
Meta-Analysis

Global prevalence of sarcopenia and severe sarcopenia: a systematic review and meta-analysis

Fanny Petermann-Rocha et al. J Cachexia Sarcopenia Muscle. 2022 Feb.

Abstract

Background: Sarcopenia is defined as the loss of muscle mass and strength. Despite the seriousness of this disease, a single diagnostic criterion has not yet been established. Few studies have reported the prevalence of sarcopenia globally, and there is a high level of heterogeneity between studies, stemmed from the diagnostic criteria of sarcopenia and the target population. The aims of this systematic review and meta-analysis were (i) to identify and summarize the diagnostic criteria used to define sarcopenia and severe sarcopenia and (ii) to estimate the global and region-specific prevalence of sarcopenia and severe sarcopenia by sociodemographic factors.

Methods: Embase, MEDLINE, and Web of Science Core Collections were searched using relevant MeSH terms. The inclusion criteria were cross-sectional or cohort studies in individuals aged ≥18 years, published in English, and with muscle mass measured using dual-energy x-ray absorptiometry, bioelectrical impedance, or computed tomography (CT) scan. For the meta-analysis, studies were stratified by diagnostic criteria (classifications), cut-off points, and instruments to assess muscle mass. If at least three studies reported the same classification, cut-off points, and instrument to measure muscle mass, they were considered suitable for meta-analysis. Following this approach, 6 classifications and 23 subgroups were created. Overall pooled estimates with inverse-variance weights obtained from a random-effects model were estimated using the metaprop command in Stata.

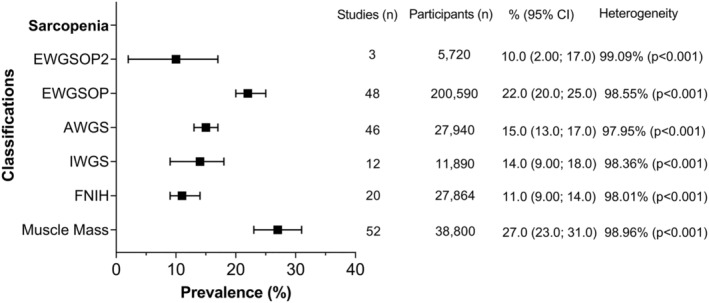
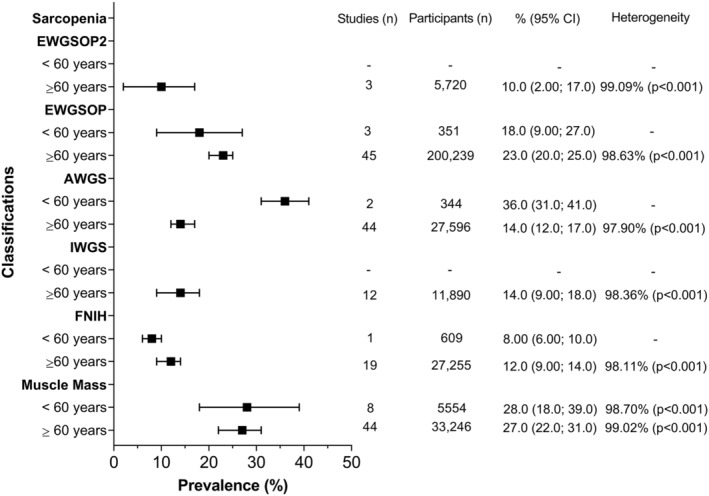
Results: Out of 19 320 studies, 263 were eligible for the narrative synthesis and 151 for meta-analysis (total n = 692 056, mean age: 68.5 years). Using different classifications and cut-off points, the prevalence of sarcopenia varied between 10% and 27% in the studies included for meta-analysis. The highest and lowest prevalence were observed in Oceania and Europe using the European Working Group on Sarcopenia in Older People (EWGSOP) and EWGSOP2, respectively. The prevalence ranged from 8% to 36% in individuals <60 years and from 10% to 27% in ≥60 years. Men had a higher prevalence of sarcopenia using the EWGSOP2 (11% vs. 2%) while it was higher in women using the International Working Group on Sarcopenia (17% vs. 12%). Finally, the prevalence of severe sarcopenia ranged from 2% to 9%.

Conclusions: The prevalence of sarcopenia and severe sarcopenia varied considerably according to the classification and cut-off point used. Considering the lack of a single diagnostic for sarcopenia, future studies should adhere to current guidelines, which would facilitate the comparison of results between studies and populations across the globe.

Keywords: Meta-analysis; Prevalence; Sarcopenia; Systematic review.


Conflict of interest statement

None to declare.

Figures

Figure 1
Figure 1
Preferred Reporting Items for Systematic Review and Meta‐Analysis (PRISMA) flow diagram.
Figure 2
Figure 2
Overall quality assessment of studies included. Studies were assessed using a modified version of Hoy et al. The questions were as follows: (1) Was the study's target population a close representation of the national population in relation to relevant variables, for example, age, sex, and occupation? (2) Was the sampling frame a true or close representation of the target population? (3) Was some form of random selection used to select the sample, OR was a census undertaken? (4) Was the likelihood of non‐response bias minimal? (5) Were data collected directly from the subjects (as opposed to proxy)? (6) Was an acceptable case definition used in the study? (7) Was the study instrument that measured the parameter of interest (e.g. prevalence of low back pain) shown to have reliability and validity (if necessary)? (8) Was the same mode of data collection used for all subjects? (9) Was the length of the shortest prevalence period for the parameter of interest appropriate? (10) Were the numerator(s) and denominator(s) for the parameter of interest appropriate? Summary item on the overall risk of study bias (overall).
Figure 3
Figure 3
Overall prevalence of sarcopenia according to the classification used. Data presented as prevalence (%) with their respectively 95% confidence intervals (CIs) by classification used. Overall pooled estimates with inverse‐variance weights obtained from a random‐effects model were estimated for the analyses using metaprop in Stata. Heterogeneity was assessed using the I 2 statistic (ranged from 0% to 100%). %, estimated prevalence; AWGS, Asian Working Group for Sarcopenia; EWGSOP, European Working Group on Sarcopenia in Older People; EWGSOP2, European Working Group on Sarcopenia in Older People 2; FNIH, Foundation for the National Institute of Health; IWGS, International Working Group on Sarcopenia.
Figure 4
Figure 4
Overall prevalence of sarcopenia by classification and region of origin. Data presented as prevalence (%) by classification used. Overall pooled estimates with inverse‐variance weights obtained from a random‐effects model were estimated for the analyses using metaprop in Stata. AWGS, Asian Working Group for Sarcopenia; EWGSOP, European Working Group on Sarcopenia in Older People; EWGSOP2, European Working Group on Sarcopenia in Older People 2; FNIH, Foundation for the National Institute of Health; IWGS, International Working Group on Sarcopenia.
Figure 5
Figure 5
Overall prevalence of sarcopenia by classification and age. Data presented as prevalence (%) with their respectively 95% confidence intervals (CIs) by classification used. Overall pooled estimates with inverse‐variance weights obtained from a random‐effects model were estimated for the analyses using metaprop in Stata. Heterogeneity was assessed using the I 2 statistic (ranged from 0% to 100%). Due to the low numbers of studies with people younger than 60 years, it was impossible to estimate heterogeneity for the EWGSOP, AWGS, and FNIH classifications. %, estimated prevalence; AWGS, Asian Working Group for Sarcopenia; EWGSOP, European Working Group on Sarcopenia in Older People; EWGSOP2, European Working Group on Sarcopenia in Older People 2; FNIH, Foundation for the National Institute of Health; IWGS, International Working Group on Sarcopenia.
Figure 6
Figure 6
Overall prevalence of sarcopenia by classification and sex. Data presented as prevalence (%) with their respectively 95% confidence intervals (CIs) by classification used. Overall pooled estimates with inverse‐variance weights obtained from a random‐effects model were estimated for the analyses using metaprop in Stata. Heterogeneity was assessed using the I 2 statistic (ranged from 0% to 100%). Due to the low numbers of studies with data available for women, it was impossible to estimate heterogeneity for the EWGSOP2. %, estimated prevalence; AWGS, Asian Working Group for Sarcopenia; EWGSOP, European Working Group on Sarcopenia in Older People; EWGSOP2, European Working Group on Sarcopenia in Older People 2; FNIH, Foundation for the National Institute of Health; IWGS, International Working Group on Sarcopenia.
Figure 7
Figure 7
Overall prevalence of severe sarcopenia. Data presented as prevalence (%) with their respectively 95% confidence intervals (CIs) by classification used. Overall pooled estimates with inverse‐variance weights obtained from a random‐effects model were estimated for the analyses using metaprop in Stata. Heterogeneity was assessed using the I 2 statistic (ranged from 0% to 100%). Due to the low numbers of studies, it was impossible to estimate heterogeneity in some cases. Panel (A) shows the overall prevalence of severe sarcopenia by classification, while panel (B) the overall prevalence by classification and sex. %, estimated prevalence; AWGS, Asian Working Group for Sarcopenia; EWGSOP, European Working Group on Sarcopenia in Older People; EWGSOP2, European Working Group on Sarcopenia in Older People 2; FNIH, Foundation for the National Institute of Health; IWGS, International Working Group on Sarcopenia.

References

    1. Cruz‐Jentoft AJ, Bahat G, Bauer J, Boirie Y, Bruyère O, Cederholm T, et al. Sarcopenia: revised European consensus on definition and diagnosis. Age Ageing 2019;48:16–31. - PMC - PubMed
    1. Cruz‐Jentoft AJ, Sayer AA. Sarcopenia. Lancet 2019;393:2636–2646. - PubMed
    1. Rosenberg IH. Sarcopenia: origins and clinical relevance. J Nutr 1997;127:990S–991S. - PubMed
    1. Falcon LJ, Harris‐Love MO. Sarcopenia and the new ICD‐10‐CM code: screening, staging, and diagnosis considerations. Fed Pract 2017;34:24–32. - PMC - PubMed
    1. Cruz‐Jentoft AJ, Baeyens JP, Bauer JM, Boirie Y, Cederholm T, Landi F, et al. Sarcopenia: European consensus on definition and diagnosis: report of the European Working Group on Sarcopenia in Older People. Age Ageing 2010;39:412–423. - PMC - PubMed

Publication types