. 2022 Jan 24;28(5):e202103420.
doi: 10.1002/chem.202103420. Epub 2021 Dec 10.

Understanding the Effects of Binders in Gas Sorption and Acidity of Aluminium Fumarate Extrudates

Affiliations

Understanding the Effects of Binders in Gas Sorption and Acidity of Aluminium Fumarate Extrudates

Miguel Rivera-Torrente et al. Chemistry. .

Abstract

Understanding the impact of shaping processes on solid adsorbents is critical for the implementation of MOFs in industrial separation processes or as catalytic materials. Production of MOF-containing shaped particles is typically associated with loss of porosity and modification of acid sites, two phenomena that affect their performance. Herein, we report a detailed study on how extrusion affects the crystallinity, porosity, and acidity of the aluminium fumarate MOF with clays or SiO2 gel binders. Thorough characterization showed that the clay binders confer the extrudates a good mechanical robustness at the expense of porosity, while silica gel shows an opposite trend. The CO2 selectivity towards CH4 , of interest for natural gas separation processes, is maintained upon the extrusion process. Moreover, probe FTIR spectroscopy revealed no major changes in the types of acid sites. This study highlights that these abundant and inexpensive clay materials may be used for scaling MOFs as active adsorbents.

Keywords: CO2/CH4; acidity; aluminium fumarate; metal-organic frameworks (MOFs); solids extrusion.


Conflict of interest statement

The authors declare no conflict of interest.

Figures

Figure 1
Figure 1
Preparation of the shaped bodies by extrusion of the water mixed paste consisting of aluminum fumarate MOF and binder (either montmorillonite, bentonite, or silica) and drying.
Figure 2
Figure 2
X‐ray diffraction (XRD) patterns showing the pure aluminum fumarate (black), the pure binder (blue) and the extrudate bodies (red); of (a) MOF/Mont, (b) MOF/Bent and (c) MOF/SiO2 shaped composites.
Figure 3
Figure 3
Hg porosimetry (a) intrusion and extrusion (empty circles represent the Hg extrusion cycle), (b) pore size distribution (PSD) curves, (c) N2 adsorption isotherms at 77 K; and (d) Barrett‐Joyner‐Halenda (BJH) PSDs from the desorption data of the (blue) MOF/Mont, (red) MOF/Bent and (yellow) MOF/SiO2 after 18 h and (green) MOF/SiO2 after 5 h of calcination extrudates.
Figure 4
Figure 4
SEM micrographs of (a,b) aluminum fumarate at different magnification levels. Images of the side‐view (c) and (d) cross‐section after FIB‐sectioning of a MOF/Bent extrudate. Arrows in (d) highlight the MOF and extrudate grains compacted together.
Figure 5
Figure 5
SEM micrographs of the (a,b) side‐view a MOF/Mont extrudate at different magnifications, as well as an EDX map of micrograph (c,d) showing Si (blue), Al (pink) and C (yellow) dispersed throughout the material within the cracks observed. Micrographs of the indentations created by the Ga+ beam on the longitudinal cross‐section at different magnifications (e) and (f), revealing the pores probed by Hg porosimetry. The triangles in the inset schemes indicate the position that was imaged by the electron beam.
Figure 6
Figure 6
Skeletal density values of the MOF, MOF/binder and pure binder extrudates determined by He pycnometry at 313 K.
Figure 7
Figure 7
Single‐component adsorption isotherms of (a–c) CO2 and (d–f) CH4 at 303 K with the experimental data (filled diamonds, ) in the p=1–10 bar range and the fitted curves to a 3‐site Jensen‐Seaton (doted lines, ‐ ‐ ‐ ) model isotherm.
Figure 8
Figure 8
Different regions of the FTIR spectra with increasing CO pressures (dark blue to brown) at 85 K of (a, b) the pure MOF, (d, e) MOF/Mont and (g, h) MOF/Bent extrudate materials. FTIR spectra of (c) the MOF, (f) MOF/Mont and (i) MOF/Bent extrudates after saturation with CD3CN (blue), vacuum evacuation at 298 (green), 323 (red) and 423 K (yellow).
Figure 9
Figure 9
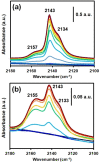
CO‐probe FTIR spectra at 85 K and increasing pressures of the MOF/SiO2 extrudates after calcination at 573 K for (a) 5 h and (b) 18 h in air flow.

References

    1. Furukawa H., Cordova K. E., O'Keeffe M., Yaghi O. M., Science 2013, 341, 6149. - PubMed
    1. Zhou H.-C., Long J. R., Yaghi O. M., Chem. Rev. 2012, 112, 673–674. - PubMed
    1. Tagliabue M., Rizzo C., Millini R., Dietzel P. D. C., Blom R., Zanardi S., J. Porous Mater. 2011, 18, 289–296.
    1. Castro-Gonzales L., Kimmerle K., Schippert E., Fickinger D., ChemistrySelect 2016, 1, 2834–2841.
    1. Chanut N., Wiersum A. D., Lee U. H., Hwang Y. K., Ragon F., Chevreau H., Bourrelly S., Kuchta B., Chang J.-S., Serre C., Llewellyn P. L., Eur. J. Inorg. Chem. 2016, 4416–4423.

LinkOut - more resources