. 2022 Jan 3;219(1):e20202490.
doi: 10.1084/jem.20202490. Epub 2021 Nov 24.

Blood stem cell PU.1 upregulation is a consequence of differentiation without fast autoregulation

Affiliations

Blood stem cell PU.1 upregulation is a consequence of differentiation without fast autoregulation

Nouraiz Ahmed et al. J Exp Med. .

Abstract

Transcription factors (TFs) regulate cell fates, and their expression must be tightly regulated. Autoregulation is assumed to regulate many TFs' own expression to control cell fates. Here, we manipulate and quantify the (auto)regulation of PU.1, a TF controlling hematopoietic stem and progenitor cells (HSPCs), and correlate it to their future fates. We generate transgenic mice allowing both inducible activation of PU.1 and noninvasive quantification of endogenous PU.1 protein expression. The quantified HSPC PU.1 dynamics show that PU.1 up-regulation occurs as a consequence of hematopoietic differentiation independently of direct fast autoregulation. In contrast, inflammatory signaling induces fast PU.1 up-regulation, which does not require PU.1 expression or its binding to its own autoregulatory enhancer. However, the increased PU.1 levels induced by inflammatory signaling cannot be sustained via autoregulation after removal of the signaling stimulus. We conclude that PU.1 overexpression induces HSC differentiation before PU.1 up-regulation, only later generating cell types with intrinsically higher PU.1.


Conflict of interest statement

Disclosures: The authors declare no competing interests exist.

Figures

Figure 1.
Figure 1.
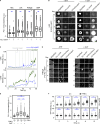
Inducible PU.1-ERT2 mouse line to quantify PU.1 autoregulation. (A) Alleles of the PYGC reporter mouse line with an additional (randomly integrated) inducible PU.1-ERT2 fusion transgene. Gray exons, white introns. (B) Spi1 mRNA levels are elevated as expected in PYGCPU.1-ERT2 mice. Quantitative PCR data, normalized (Norm) to PU.1 levels in PYGC LSK cells (three independent experiments, error bars = SD of mean Spi1 mRNA). (C) PU.1-ERT2 activation elongates HSC cell cycle length. PYGC ± PU.1-ERT2 HSCs were cultured ± OHT, imaged, and tracked until first cell division. Mean first cell division time ± SD. Cell numbers −/+OHT: PYGC: 90/93; PYGCPU.1-ERT2: 95/98. Three independent experiments. (D–F) PU.1-ERT2 activation reprograms MegE to the GM lineage. (D) Experimental scheme. PreMegEs (P.MegE) from PYGC ± PU.1-ERT2 mice were cultured ± OHT and imaged once every day. Scale bar: 50 µm. (E) Representative day 6 images of PreMegEs ± OHT. Scale bar: 50 µm. MegE versus GM colonies detected by morphology and GATA1mCherry versus PU.1eYFP and CD16/32-A647 expression (see Fig. S1 D). (F) Mean ± SD percent of day 7 colony types. Colony numbers −/+OHT: PYGC: 457/248; PYGCPU.1-ERT2: 294/589. Three independent experiments. Wilcoxon rank sum test; ***, P < 0.001. a.u., arbitrary unit.
Figure S1.
Figure S1.
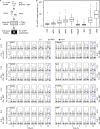
PU.1 up-regulation upon PU.1 activation is a later consequence of differentiation and not of direct autoregulation (related to Fig 1 and Fig. 2). (A) PU.1-ERT2 protein is expressed at a very low level compared with endogenous PU.1. Quantitative immunostaining against total PU.1 in HSPCs ± PU.1-ERT2 transgene. Box and whisker plots with median absolute PU.1 intensity. Data relative to LSK. Cell numbers HSC/LSK/PreMegE/GMP: WT: 801/4,252/2,003/4,490; PU.1-ERT2: 861/4,459/2,464/5,218. Two independent experiments. (B and C) PU.1-ERT2 activation rapidly induces CD16/32, but not PU.1eYFP expression in HSCs. PYGCPU.1-ERT2 HSCs were cultured ± OHT followed by time-lapse imaging up to 5 d. (B) Representative brightfield, PU.1eYFP, and CD16/32–Alexa Fluor 647 fluorescence images of PYGCPU.1-ERT2 HSCs ± OHT at days 0, 1, 2, 3, and 4. Scale bar: 10 µm. (C) Representative single-cell traces of PU.1eYFP (blue) and CD16/32 (green) levels in PYGCPU.1-ERT2 HSCs ± OHT. Data indicate fluorescence intensity of PU.1eYFP and CD16/32–Alexa Fluor 647 per cell. CD16/32–Alexa Fluor 647 quantification by live antibody staining. Vertical gray lines indicate cell divisions. Only one cell per generation is shown. Arrows indicate up-regulation of PU.1eYFP (blue) and CD16/32 (green). See Fig. 2, E and F. Three independent experiments. (D) Endogenous PU.1eYFP is up-regulated only during later stages of reprogramming. PYGC ± PU.1-ERT2 PreMegEs were cultured in media ± OHT and imaged once every day. Representative images of PreMegEs from Fig. 1 E at different time intervals. Arrows in right panel indicate onset of PU.1eYFP and CD16/32-A647 at day 3 in response to PU.1-ERT2 activation (see Fig. 1, D–F). Three independent experiments. Scale bar, 20 µm. (E) PU.1-ERT2 activation does not increase endogenous WT PU.1 expression. Quantitative immunostaining against total PU.1 in PU.1-ERT2 HSCs with unmodified endogenous WT Spi1 locus. Box and whisker plots with median absolute PU.1 intensity. Data relative to HSCs at 0-h time point. Cell numbers 0 h: 494; 12 h: control/+TNFα/+OHT: 538/662/521; secondary control: 79. Four independent experiments. (F) TNFα does not nonspecifically increase YFP fluorescence. HSCs from PYGC or GATA2Venus mice were cultured ± TNFα followed by time-lapse imaging. Box and whisker plots with median YFP fluorescence intensity of PU.1eYFP and GATA2Venus HSCs. HSCs across all time points −/+TNFα: PU.1eYFP: 2,336/2,408; GATA2Venus: 2,881/2,698. Three mice per genotype measured separately in two independent experiments. Wilcoxon rank sum test; ***, P < 0.001; *, P < 0.05. A647, CD16/32–Alexa Fluor 647; P.MegE, preMegE.
Figure 2.
Figure 2.
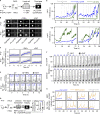
PU.1 up-regulation is a consequence of HSPC differentiation without direct fast autoregulation. (A) Experimental scheme. HSCs from PYGC ± PU.1-ERT2 mice were cultured either with TNFα or OHT followed by time-lapse imaging. (B–D) PU.1-ERT2 activation does not increase PU.1eYFP in HSCs. (B) Representative brightfield and fluorescence HSC images. Scale bar: 20 µm. (C) Single-cell traces of HSC PU.1eYFP levels. Blue traces represent means. Three independent experiments. Tracked HSCs control/+TNFα/+OHT: PYGC: 48/33/48; PYGCPU.1-ERT2: 44/43/44. (D) PU.1eYFP fold-change in HSCs ± treatment. Data relative to 0-h levels. Box and whisker plots with median PU.1 intensity. HSCs across all time points control/+TNFα/+OHT: PYGC: 2,295/2,657/2,381; PYGCPU.1-ERT2: 2,677/3,014/2,957. Three independent experiments. (E and F) PU.1-ERT2 activation rapidly induces CD16/32, but not PU.1eYFP in HSCs. (E) Representative single-cell traces of PU.1eYFP (blue) and CD16/32 (green) levels in PYGCPU.1-ERT2 HSCs ± OHT (see also Fig. S1, B and C). Fluorescence intensities per cell. CD16/32 detection by live antibody staining. Arrows indicate up-regulation of PU.1eYFP (blue) and CD16/32 (green). (F) PU.1eYFP and CD16/32 quantification in PYGCPU.1-ERT2 HSCs ± OHT. Box and whisker plots with median PU.1 and CD16/32 intensity per cell. Three independent experiments. −/+OHT: 34,623/30,924 cells across all time points. (G and H) Overexpression of WT PU.1 does not up-regulate PU.1eYFP in HSCs. (G) Experimental scheme. PU.1-T2A-iRFPnucmem was overexpressed in PYGC HSCs by lentiviral transduction. Time-lapse imaging was started 24 h after infection. (H) Representative single-cell traces of PU.1eYFP (blue) and iRFP (orange) in PYGC HSCs ± WT PU.1 overexpression. Vertical gray lines in E and H: cell divisions. Two independent experiments. Wilcoxon rank sum test; ***, P < 0.001; **, P < 0.01; *, P < 0.05. a.u., arbitrary unit.
Figure S2.
Figure S2.
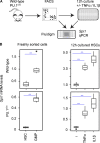
PU.1 binding to its autoregulatory −14-kb URE site is not required for Spi1 mRNA up-regulation. (A and B) PU.1 binding to −14-kb URE is not required for Spi1 mRNA up-regulation during myeloid differentiation or by inflammatory stimulation. (A) Experimental scheme. HSCs and GMPs from WT or PU.1ki/ki mice were sorted, cultured with TNFα or IL-1β followed by qRT-PCR using Fluidigm. (B) qRT-PCR of Spi1 mRNA in freshly sorted HSCs and GMPs (left panel) and HSCs treated for 12 h with TNFα and IL-1β (right panel) from PU.1ki/ki mice and WT littermates. mRNA levels are shown. Eight mice per genotype measured separately at the same day. Student’s t test; ***, P < 0.001.
Figure S3.
Figure S3.
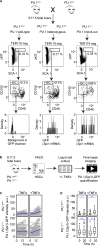
PU.1 protein is not required for fetal liver HSC Spi1 expression or up-regulation by inflammatory signaling. (A) PU.1wt/G mice with heterozygous GFP knock-in in exon 1 of Spi1 locus were crossed, and E17.5 fetal livers were harvested and genotyped by FACS (data not shown). GFP expression (transcription of Spi1 locus) in CD48neg, CD150hi HSCs from all three genotypes. Note GFP expression in homozygous PU.1 knockout HSCs. Fetal liver numbers WT/PU.1wt/G/PU.1G/G: 2/4/3. (B–D) PU.1 protein is not required for fetal liver HSC Spi1 up-regulation by inflammatory signaling. (B) Experimental scheme. HSCs from indicated genotypes were cultured ± TNFα followed by time-lapse imaging. (C) Single-cell dynamics of PU.1(Spi1)-GFP fluorescence intensities in HSCs. Blue traces represent means. (D) Box and whisker plots with median PU.1(Spi1)-GFP intensity per cell. Three fetal livers per genotype measured separately at the same day. Cell numbers −/+TNFα: PU.1wt/G: 145/152; PU.1G/G: 100/86. Wilcoxon rank sum test; ***, P < 0.001; *, P < 0.05. a.u., arbitrary unit.
Figure 3.
Figure 3.
PU.1 cannot self-sustain its increased levels induced by inflammatory signaling in HSCs. (A) Experimental scheme. PYGC HSCs were cultured in a microfluidics device, treated with continuous or transient TNFα and IL-1β stimulation followed by time-lapse imaging. (B–D) Increased PU.1 cannot sustain its increased expression in HSCs. (B) Representative HSC fluorescence images. Scale bar: 10 µm. (C) PU.1eYFP quantification in single HSCs until first cell division. Mean pixel intensity per cell. Blue traces represent population average. Blue shade: TNFα presence. Three independent experiments. Tracked HSCs −/TNFα/transient TNFα: 36/24/39. (D and E) Snapshot quantification of PU.1eYFP levels in HSCs cultured with transient TNFα (D) or IL-1β (E) stimulation. Box and whisker plots with median PU.1eYFP intensity per cell. (D) Three independent experiments. −/TNFα/transient TNFα: 2,712/2,712/2,537 cells across all time points. (E) Two independent experiments. −/IL1β/transient IL1β: 1,378/2,946/1,663 cells across all time points. Wilcoxon rank sum test; ***, P < 0.001; **, P < 0.01; *, P < 0.05.
Figure 4.
Figure 4.
PU.1 TF does not directly autoregulate its expression in different HPC types. (A) Experimental scheme. PYGC ± PU.1-ERT2 HPCs were cultured with TNFα or OHT followed by time-lapse imaging. (B) Different PU.1eYFP levels in different HPCs. Box and whisker plots with median PU.1 intensity relative to GMPs. Three independent experiments. (C) PU.1-ERT2 activation does not rapidly induce endogenous PU.1eYFP levels in HPCs. PU.1eYFP fold-changes relative to 0 h. Box and whisker plots with median PU.1eYFP fold-change. Three independent experiments, >150 starting cells per condition across all replicates. Wilcoxon rank sum test; ***, P < 0.001; **, P < 0.01; *, P < 0.05. P.MegE, preMegE.

References

    1. Ahmed, N., Kunz L., Hoppe P.S., Loeffler D., Etzrodt M., Ortega G.C., Hilsenbeck O., Anastassiadis K., and Schroeder T.. 2020. A Novel GATA2 Protein Reporter Mouse Reveals Hematopoietic Progenitor Cell Types. Stem Cell Reports. 15:326–339. 10.1016/j.stemcr.2020.06.008 - DOI - PMC - PubMed
    1. Akashi, K., Traver D., Miyamoto T., and Weissman I.L.. 2000. A clonogenic common myeloid progenitor that gives rise to all myeloid lineages. Nature. 404:193–197. 10.1038/35004599 - DOI - PubMed
    1. Alon, U. 2007. Network motifs: theory and experimental approaches. Nat. Rev. Genet. 8:450–461. 10.1038/nrg2102 - DOI - PubMed
    1. Back, J., Dierich A., Bronn C., Kastner P., and Chan S.. 2004. PU.1 determines the self-renewal capacity of erythroid progenitor cells. Blood. 103:3615–3623. 10.1182/blood-2003-11-4089 - DOI - PubMed
    1. Bouchoucha, Y.X., Reingruber J., Labalette C., Wassef M.A., Thierion E., Desmarquet-Trin Dinh C., Holcman D., Gilardi-Hebenstreit P., and Charnay P.. 2013. Dissection of a Krox20 positive feedback loop driving cell fate choices in hindbrain patterning. Mol. Syst. Biol. 9:690. 10.1038/msb.2013.46 - DOI - PMC - PubMed

Publication types

MeSH terms