. 2022 Feb 7;221(2):e202107070.
doi: 10.1083/jcb.202107070. Epub 2021 Nov 24.

Reconstitution of human atlastin fusion activity reveals autoinhibition by the C terminus

Affiliations

Reconstitution of human atlastin fusion activity reveals autoinhibition by the C terminus

Daniel Crosby et al. J Cell Biol. .

Abstract

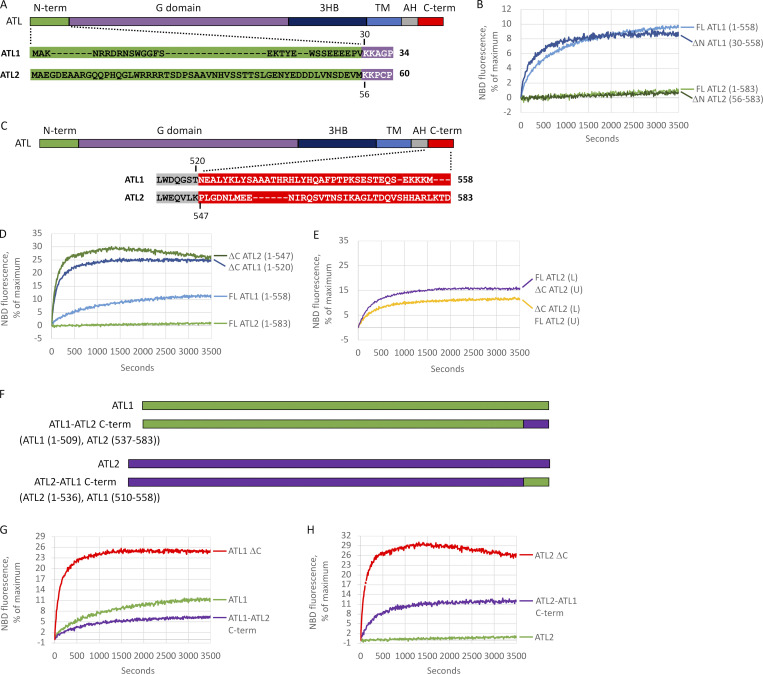
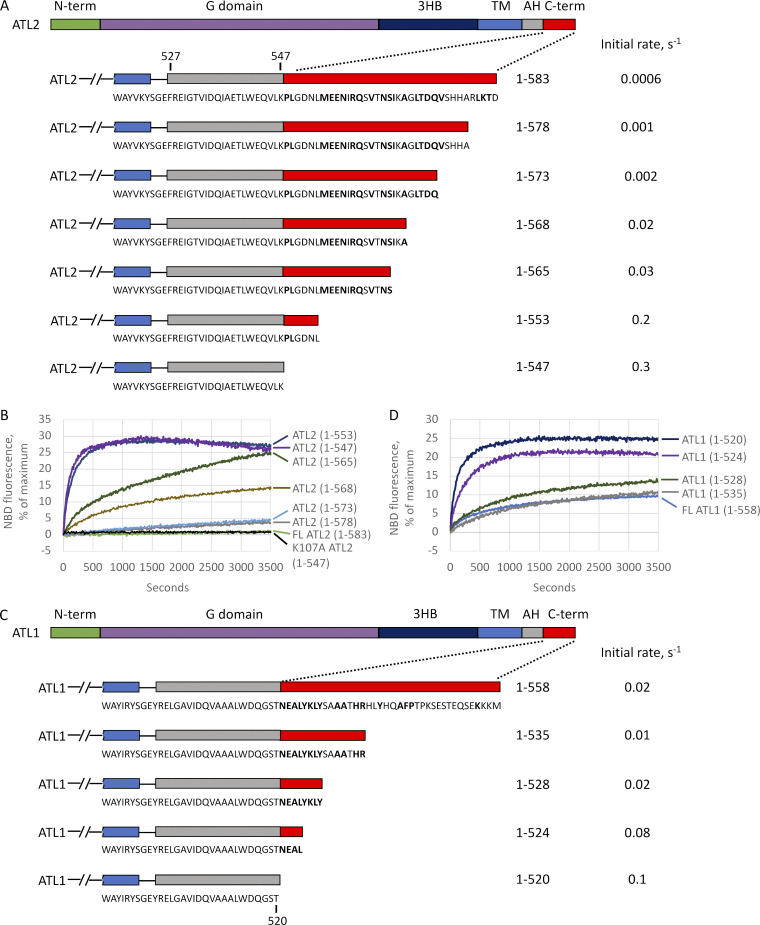
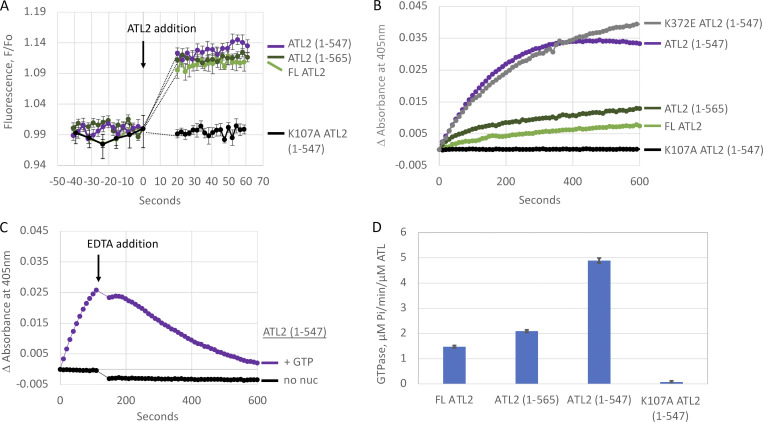
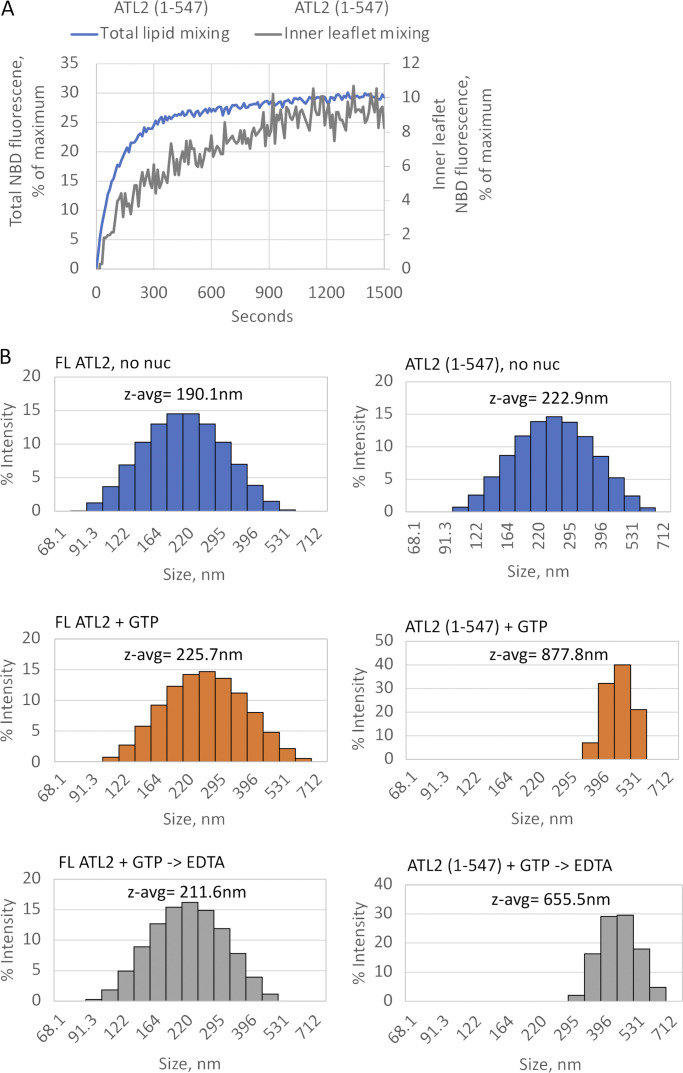
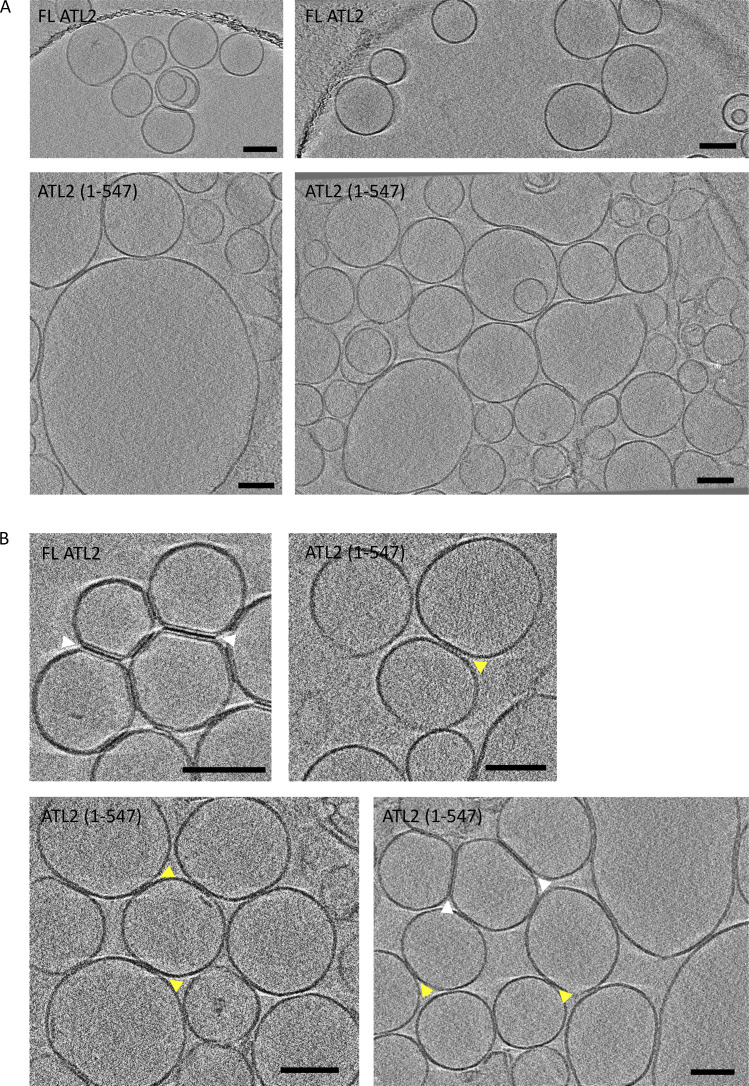
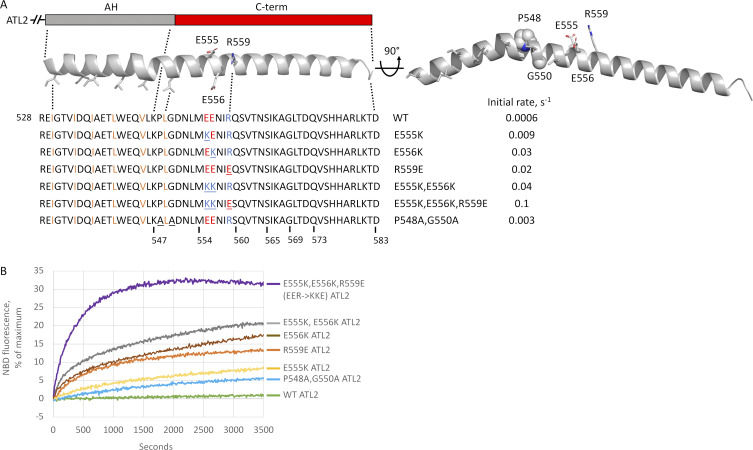
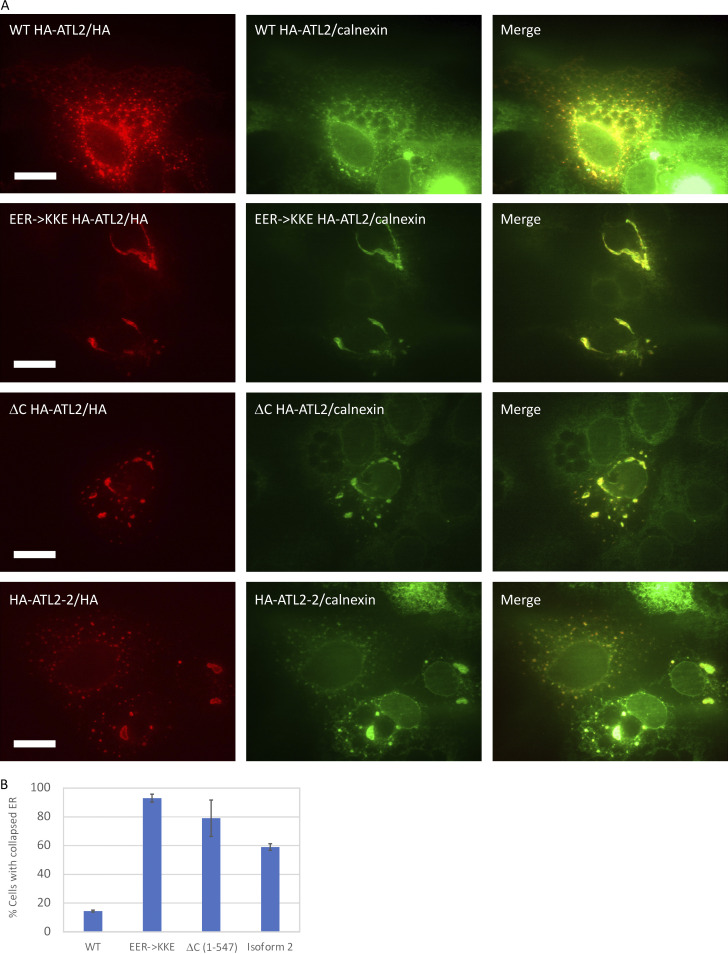
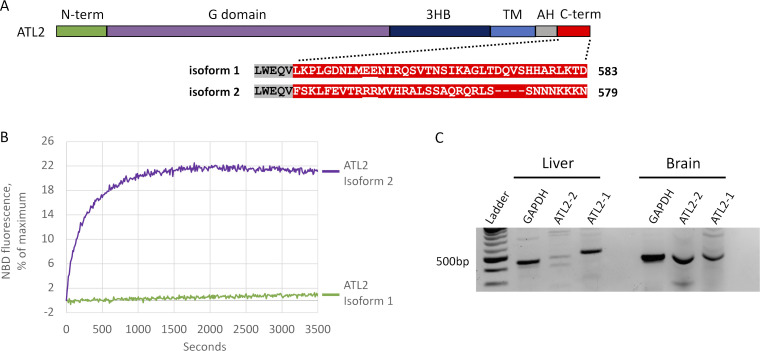
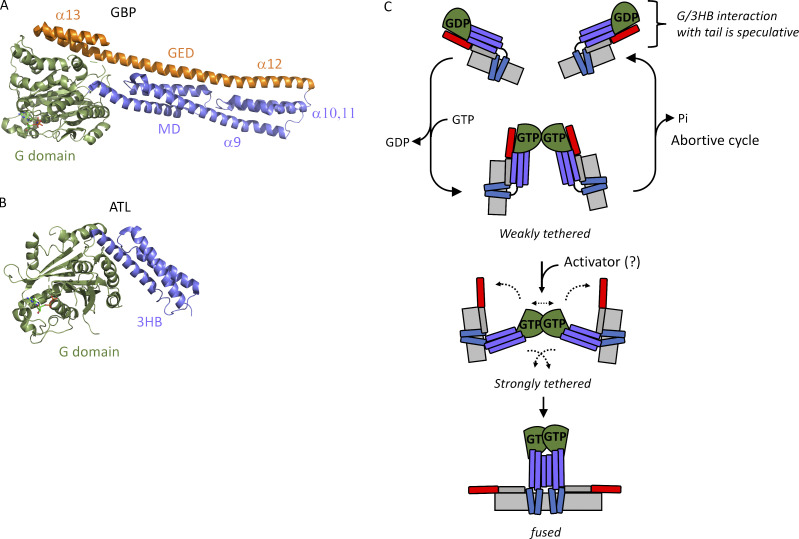
ER network formation depends on membrane fusion by the atlastin (ATL) GTPase. In humans, three paralogs are differentially expressed with divergent N- and C-terminal extensions, but their respective roles remain unknown. This is partly because, unlike Drosophila ATL, the fusion activity of human ATLs has not been reconstituted. Here, we report successful reconstitution of fusion activity by the human ATLs. Unexpectedly, the major splice isoforms of ATL1 and ATL2 are each autoinhibited, albeit to differing degrees. For the more strongly inhibited ATL2, autoinhibition mapped to a C-terminal α-helix is predicted to be continuous with an amphipathic helix required for fusion. Charge reversal of residues in the inhibitory domain strongly activated its fusion activity, and overexpression of this disinhibited version caused ER collapse. Neurons express an ATL2 splice isoform whose sequence differs in the inhibitory domain, and this form showed full fusion activity. These findings reveal autoinhibition and alternate splicing as regulators of atlastin-mediated ER fusion.


Figures

Figure 1.
Figure 1.
Human ATL1 has fusion activity. (A) His-tagged ATL1 fractions eluted from a Ni+2 column and resolved on SDS-PAGE. AH, amphipathic helix. (B) ATL1 was reconstituted into donor and acceptor vesicles (1:2 donor/acceptor), and fusion was monitored during the dequenching of NBD-labeled lipid present in the donor vesicles over time at 37°C after addition of 2 mM GTP or buffer (no nuc). Loss of NBD fluorescence without GTP was attributed to photobleaching, because it mimicked NBD loss from protein-free liposomes (pf no nuc). (C) Lipid mixing by DATL from E. coli with or without GTP performed as in B. (D) ATL1 lipid mixing after reconstitution at varying protein/lipid ratios. (E) Lipid mixing by WT, R77E, Δtail ATL1(1–496), and I507D showing a requirement for GTP binding, the amphipathic helix, and the nonpolar face of the amphipathic helix. (F) Comparison of ATL1 HSP mutant variants H258R, R239C, and R217Q to WT. All lipid mixing was performed at a 1:1,000 protein/lipid ratio unless otherwise stated. The data are the average of at least two independent traces.
Figure S1.
Figure S1.
Phosphorylation does not account for ATL1 fusion activity. (A) Intensity of singly and doubly phosphorylated TYEWSSEEEEPVKK peptides and the unmodified counterpart. (B) Lipid mixing by WT ATL1 and phosphomutant S22A, S23A. (C) Lipid mixing by DATL purified from HEK cells is faster than by DATL purified from E. coli. All lipid mixing was performed at a 1:1,000 protein/lipid ratio, and the data are the average of at least two individual traces.
Figure S2.
Figure S2.
Comparison of fusion rates for all ATL variants in this study. Initial lipid mixing rates (as the percentage of maximum lipid mixing possible per second) observed for all ATL variants in this study.
Figure S3.
Figure S3.
ATL1 and ATL2 protein purity. Peak Ni2+-NTA fractions of all His-tagged ATL1 and ATL2 variant proteins in this study are shown after resolving on SDS-PAGE and staining with SYPRO ruby.
Figure S4.
Figure S4.
cyt-ATL2 has single turnover kinetics of dimerization and crossover formation similar to those of cyt-ATL1 and cyt-DATL. (A) Schematic of FRET as cyt-ATL monomers labeled with a FRET donor and acceptor on the G domain (i) undergo G domain dimerization (G-G FRET; ii). (B) Comparison of G-G acceptor FRET for cyt-ATL2, cyt-ATL1, and cyt-DATL after GTP addition under stopped flow. norm., normalized. (C) Schematic of Cy3 fluorescence enhancement as Cy3-labeled cyt-ATL2, cyt-ATL1, and cyt-DATL (i) undergo dimer formation and crossover (C/O PIFE; ii). (D) Comparison of crossover PIFE for cyt-ATL2, cyt-ATL1, and cyt-DATL after GTP addition under stopped flow. All reactions contained 15 µM cyt-ATL and 7.5 µM GTP (final) and were at 25°C. All traces are the average of three to five individual traces and normalized (initial value = 0; maximum value = 1).
Figure 2.
Figure 2.
ATL1 and ATL2 are autoinhibited by a variable C-terminal extension. (A) Alignment of ATL1 and ATL2 N-terminal extensions. (B) Lipid mixing by full-length (FL) ATL1, ΔN ATL1(30–558), FL ATL2, and ΔN ATL2(56–583). (C) Alignment of ATL1 and ATL2 C-terminal extensions. (D) Lipid mixing by FL ATL1, ΔC ATL1(1–520), FL ATL2, and ΔC ATL2(1–547). (E) Lipid mixing between FL and DC ATL2 in trans. DC ATL2 in labeled liposomes (L) were mixed with FL ATL2 in unlabeled liposomes (UL) at a 1:2 ratio or vice versa. (F) Schematic of ATL1/2 chimeras. (G) Lipid mixing by ATL1 WT, ΔC ATL1, and ATL1-ATL2 C-terminal chimera. (H) Lipid mixing by ATL2 WT, ΔC ATL2, and ATL2-ATL1 C-terminal chimera. All proteins were incorporated at a 1:1,000 protein/lipid ratio, and the data are the average of at least two independent traces.
Figure 3.
Figure 3.
Mapping the ATL2 C-terminal inhibitory domain. (A) Schematic of serial truncations of the ATL2 C-terminal extension. C-terminal residues identical in D. rerio ATL2 are in bold. Initial fusion rates were calculated from the data shown in B. AH, amphipathic helix. (B) Lipid mixing by the ATL2 truncations shown in A. (C) Schematic of serial truncations of the ATL1 C-terminal extension. C-terminal residues identical in D. rerio ATL1 in bold. Fusion rates were calculated from the data shown in D. (D) Lipid mixing by the ATL1 truncations shown in C. All proteins were incorporated at a 1:1,000 protein/lipid ratio, and the data are the average of at least two independent traces.
Figure 4.
Figure 4.
ATL2 C-terminus impairs G domain–mediated tethering and GTP hydrolysis, but not GTP binding. (A) Mant-GTP binding by FL ATL2, ATL2(1–565), ATL2(1–547), and K107A ATL2(1–547). Baseline fluorescence was established for 40 s followed by addition of ATL2 with the first reading after 20 s, an average of ≥5 individual traces (±SEM). (B) Tethering monitored as the change in 405-nm absorbance after the addition of 2 mM GTP. (C) Reversibility of GTP-dependent tethering by ATL2(1–547). 120 s after the initial addition of buffer or GTP as in B, EDTA was added to 18 mM. (D) Steady-state GTPase activity. Average (±SEM) of at least three independent measurements. All assays used ATL2 proteins incorporated at a 1:1,000 protein/lipid ratio.
Figure 5.
Figure 5.
ATL2(1–547) catalyzes full fusion. (A) ATL2(1–547) catalyzes both outer and inner leaflet lipid mixing. Inner leaflet mixing was measured after first quenching NBD in the outer leaflet with the membrane-impermeable compound sodium dithionite. For reference, the data are plotted relative to total lipid mixing by the same variant. (B) Dynamic light scattering of FL ATL2 liposomes (left) or ATL2(1–547) liposomes (right) incubated at 37°C with buffer (upper panels, no nuc), 2 mM GTP for 10 min (middle panels), or 2 mM GTP for 10 min followed by 10-min EDTA treatment (18 mM final concentration).
Figure 6.
Figure 6.
Cryo-ET analysis of tethering and fusion. FL ATL2 and ATL2(1–547) were reconstituted into liposomes, incubated with GTP for 30 s, and processed for cryo-EM. (A) FL ATL2 liposomes remained at the starting size of 100–300 nm, while ATL2(1–547) liposomes were substantially larger. (B) FL ATL2 liposomes were predominantly tethered by tight zippers (white arrows), whereas ATL2(1–547) liposomes appeared to be attached by both tight zippers (white arrows) and more diffuse zippers (yellow arrows). Scale bars, 100 nm.
Figure 7.
Figure 7.
Charge reversal in predicted C-terminal α-helix activates ATL2. (A) AlphaFold structure prediction (Jumper et al., 2021) of the ATL2 tail rendered in cartoon form in PyMOL. Nonpolar residues of the amphipathic helix shown as sticks and highlighted in orange. Inhibitory domain residues selected for charge reversal also shown as sticks and highlighted in red (acidic) or blue (basic). Charge reversal variants tested in B and initial fusion rates for each variant are indicated, and residues substituted in each variant are underlined. Also shown is a rotated view of the helix to highlight the slight bend in the helix predicted by AlphaFold, residues P548 and G550 that may mediate the bend highlighted as spheres, and the P548A/G550A variant designed as a possible test of the role of the predicted helical bend. AH, amphipathic helix. (B) Lipid mixing by each of the indicated variants in A. All proteins were incorporated at a 1:1,000 protein/lipid ratio, and the data are the average of at least two independent traces.
Figure 8.
Figure 8.
Overexpression of ATL2 C-terminal charge-reversal variants collapses the ER. (A) COS-7 cells overexpressing WT HA-ATL2, EER->KKE (E555K, E556K, R559E) HA-ATL2, DC HA-ATL2(1–547), or HA-ATL2 isoform 2 (see Fig. 9), fixed and costained with antibodies against HA or calnexin. Scale bar, 10 µm. (B) Quantification of cells with collapsed ER, average (± SD), >200 cells per experiment, n = 3.
Figure 9.
Figure 9.
The neuronal ATL2-2 splice variant lacks C-terminal autoinhibition. (A) Alignment of C-terminal extensions of ATL2-1 and ATL2-2. Isoform 2 contains arginine residues (underlined) in the identical location as glutamic acid residues (E555 and E556) of isoform 1 (Fig. 6). AH, amphipathic helix. (B) Lipid mixing performed after reconstitution of each isoform at 1:1,000 protein/lipid ratio. The data are the average of at least two individual traces. (C) RT-PCR from total RNA showing ATL2-1 and ATL2-2 expression in human liver and brain.
Figure 10.
Figure 10.
Speculative model for C-terminal autoinhibition of ATL2. (A and B) Crystal structures of GBP1 (Protein Data Bank accession no. 1F5N; A) and ATL1 (Protein Data Bank accession no. 3Q5E; B) rendered in cartoon in PyMOL. (C) Speculative model for C-terminal autoinhibition. GTP binding by ATL promotes weak G-domain dimerization in trans. In absence of a hypothetical activator, tethering is weak, and an abortive cycle results when GTP is hydrolyzed. If a hypothetical activator is present to overcome C-terminal autoinhibition, dimerization and tethering are strong, resulting in crossover formation and productive fusion. Note that the interactions depicted between the tail amphipathic helix (AH) and 3HB, as well as between the C terminus and the G domain, are speculative and have not been experimentally validated.

Similar articles

Cited by

References

    1. Anwar, K., Klemm R.W., Condon A., Severin K.N., Zhang M., Ghirlando R., Hu J., Rapoport T.A., and Prinz W.A.. 2012. The dynamin-like GTPase Sey1p mediates homotypic ER fusion in S. cerevisiae. J. Cell Biol. 197:209–217. 10.1083/jcb.201111115 - DOI - PMC - PubMed
    1. Betancourt-Solis, M.A., Desai T., and McNew J.A.. 2018. The atlastin membrane anchor forms an intramembrane hairpin that does not span the phospholipid bilayer. J. Biol. Chem. 293:18514–18524. 10.1074/jbc.RA118.003812 - DOI - PMC - PubMed
    1. Bian, X., Klemm R.W., Liu T.Y., Zhang M., Sun S., Sui X., Liu X., Rapoport T.A., and Hu J.. 2011. Structures of the atlastin GTPase provide insight into homotypic fusion of endoplasmic reticulum membranes. Proc. Natl. Acad. Sci. USA. 108:3976–3981. 10.1073/pnas.1101643108 - DOI - PMC - PubMed
    1. Blackstone, C. 2012. Cellular pathways of hereditary spastic paraplegia. Annu. Rev. Neurosci. 35:25–47. 10.1146/annurev-neuro-062111-150400 - DOI - PMC - PubMed
    1. Byrnes, L.J., and Sondermann H.. 2011. Structural basis for the nucleotide-dependent dimerization of the large G protein atlastin-1/SPG3A. Proc. Natl. Acad. Sci. USA. 108:2216–2221. 10.1073/pnas.1012792108 - DOI - PMC - PubMed

Publication types