. 2021 Nov 26;7(48):eabj1826.
doi: 10.1126/sciadv.abj1826. Epub 2021 Nov 24.

Ligands binding to the prion protein induce its proteolytic release with therapeutic potential in neurodegenerative proteinopathies

Affiliations

Ligands binding to the prion protein induce its proteolytic release with therapeutic potential in neurodegenerative proteinopathies

Luise Linsenmeier et al. Sci Adv. .

Abstract

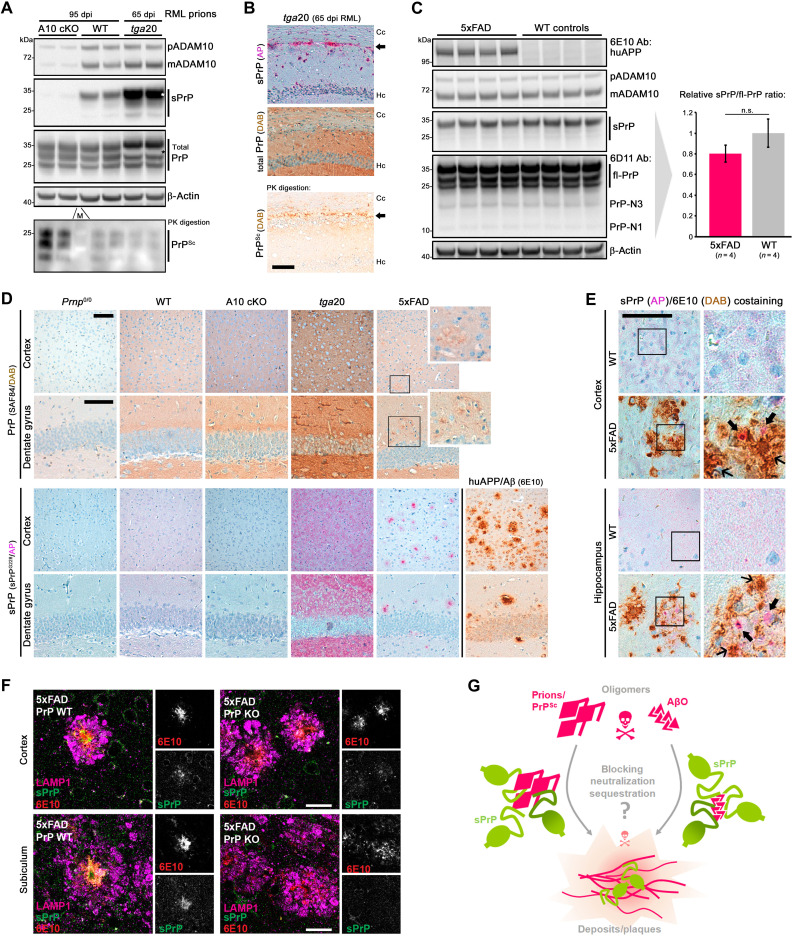
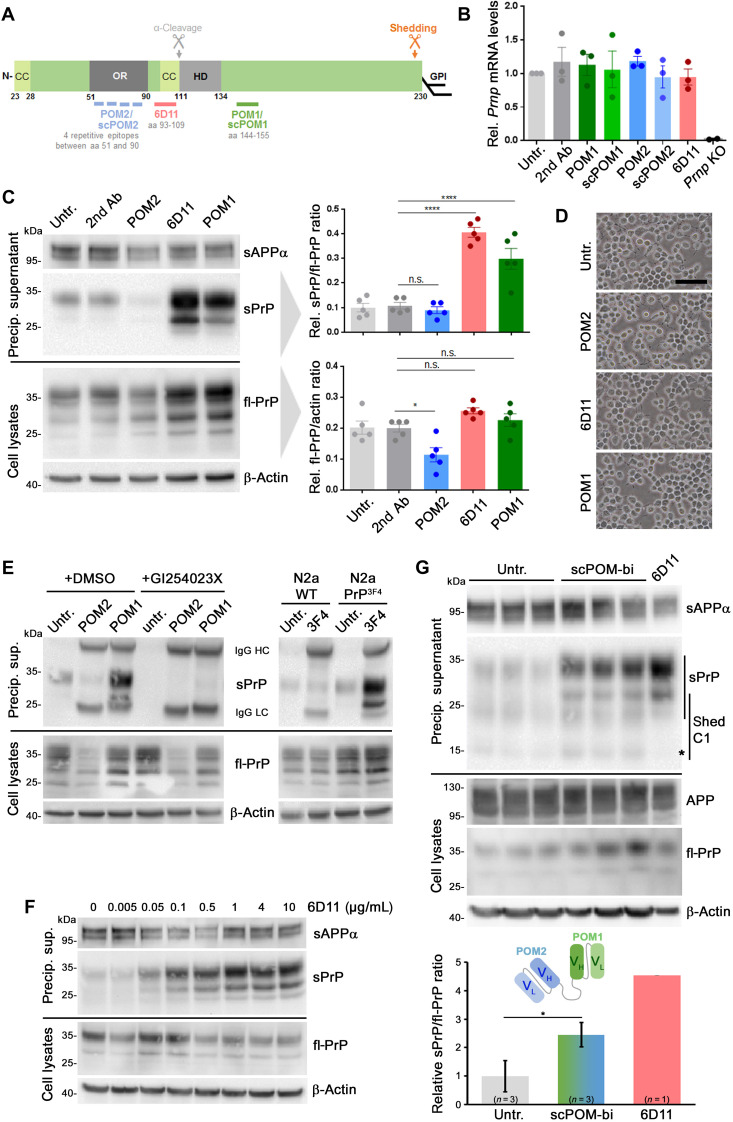
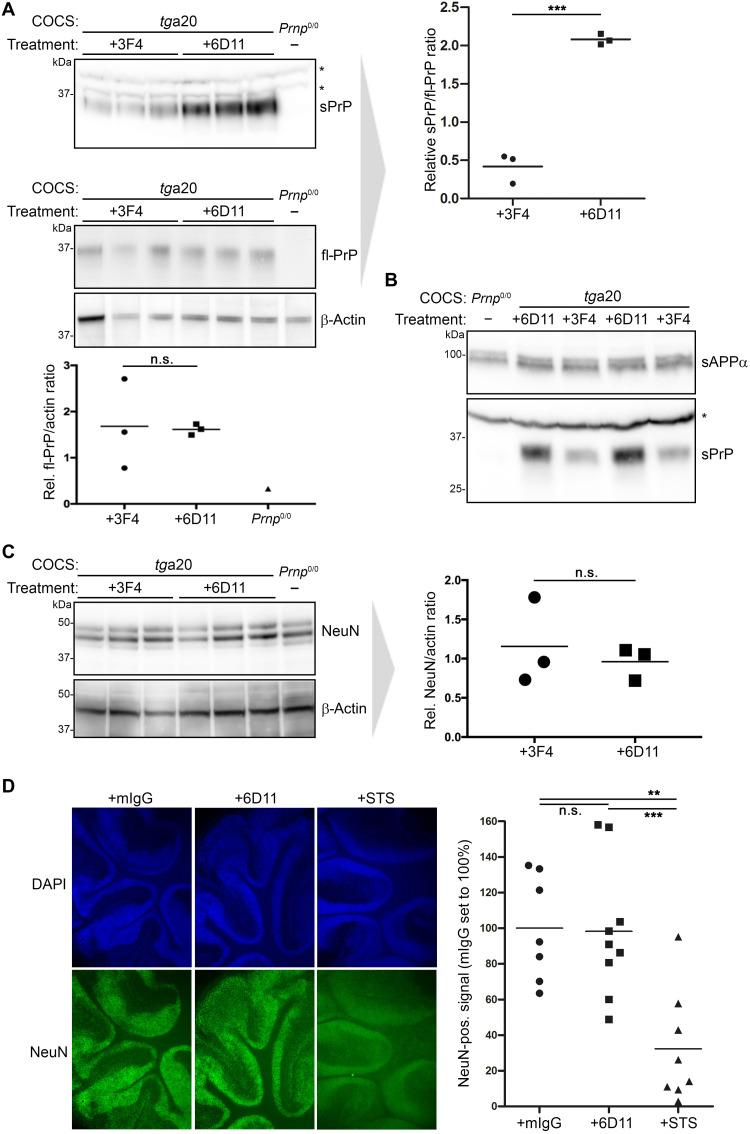
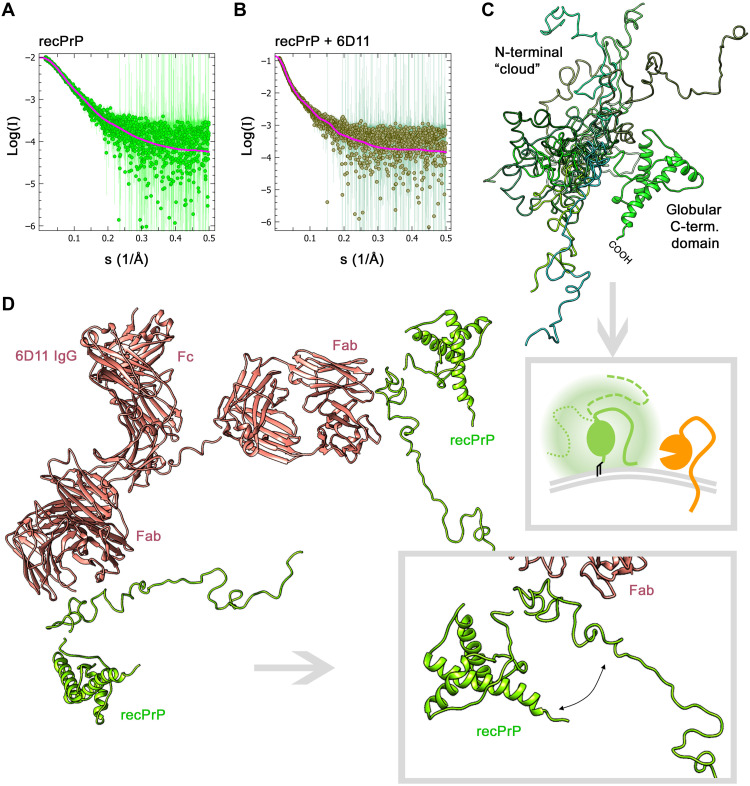
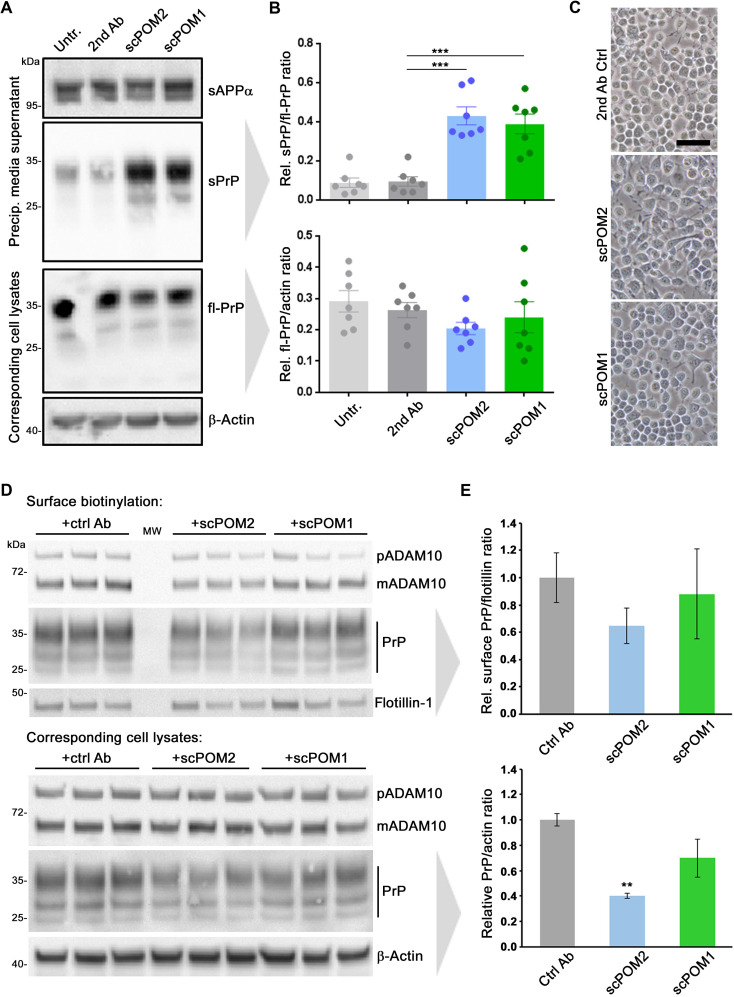
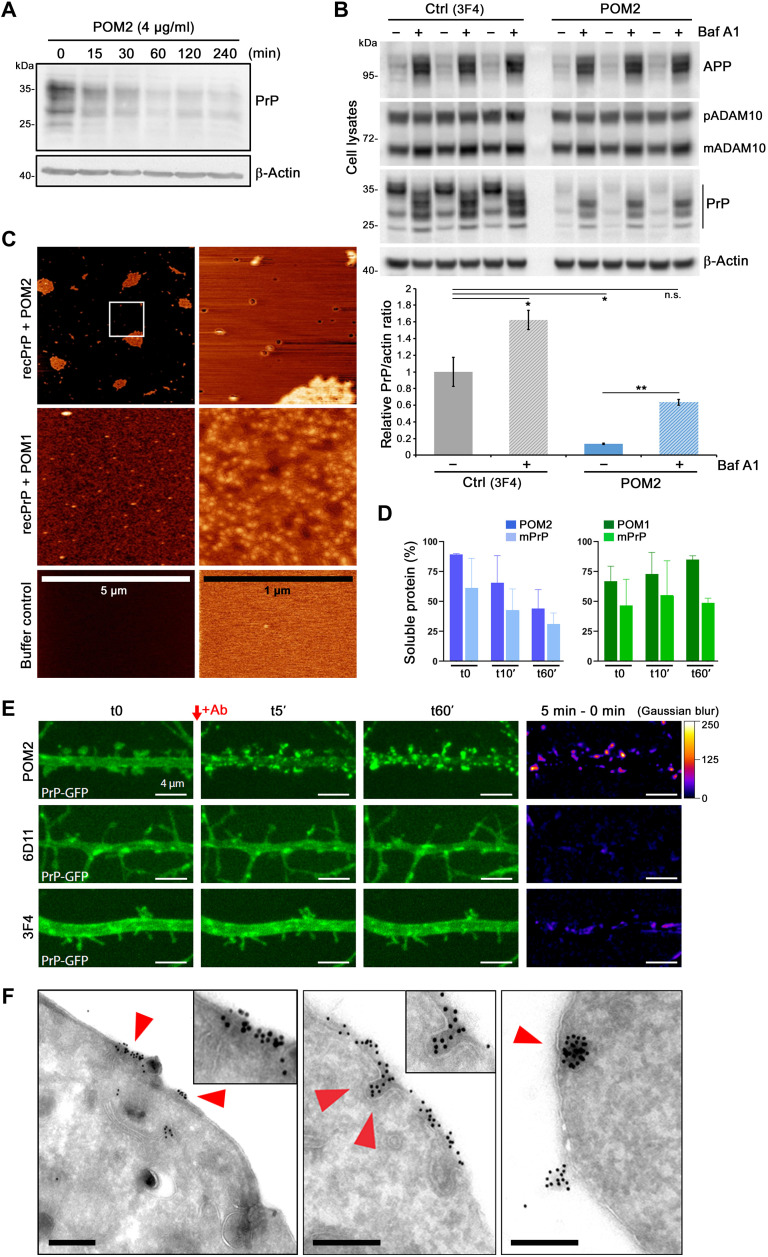
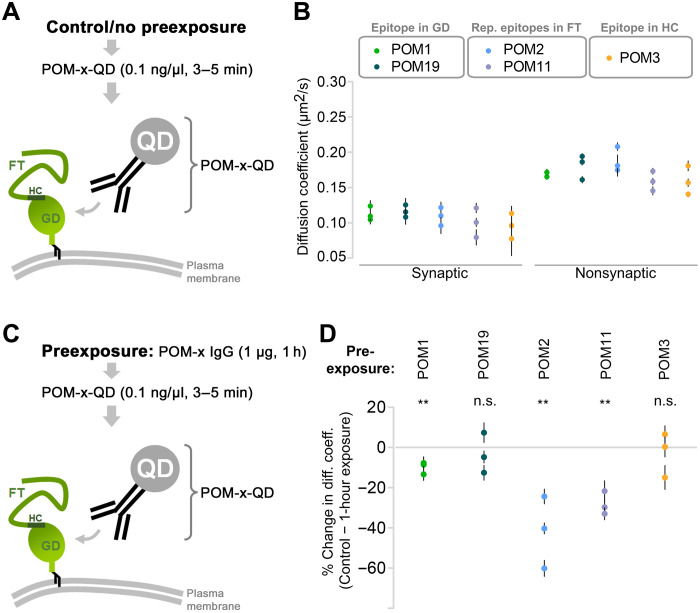
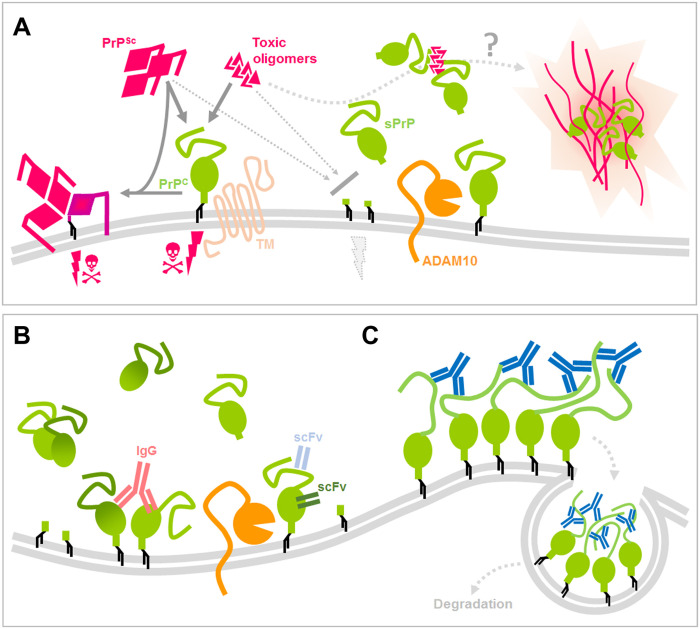
The prion protein (PrPC) is a central player in neurodegenerative diseases, such as prion diseases or Alzheimer’s disease. In contrast to disease-promoting cell surface PrPC, extracellular fragments act neuroprotective by blocking neurotoxic disease-associated protein conformers. Fittingly, PrPC release by the metalloprotease ADAM10 represents a protective mechanism. We used biochemical, cell biological, morphological, and structural methods to investigate mechanisms stimulating this proteolytic shedding. Shed PrP negatively correlates with prion conversion and is markedly redistributed in murine brain in the presence of prion deposits or amyloid plaques, indicating a sequestrating activity. PrP-directed ligands cause structural changes in PrPC and increased shedding in cells and organotypic brain slice cultures. As an exception, some PrP-directed antibodies targeting repetitive epitopes do not cause shedding but surface clustering, endocytosis, and degradation of PrPC. Both mechanisms may contribute to beneficial actions described for PrP-directed ligands and pave the way for new therapeutic strategies against currently incurable neurodegenerative diseases.


Figures

Fig. 1.
Fig. 1.. sPrP may interfere with toxic oligomers in neurodegenerative diseases.
(A) Immunoblots of premature and mature ADAM10, sPrP, and total PrP in frontal brain of prion-infected ADAM10 knockout (A10 cKO), WT [both 95 days post-infection (dpi)], and tga20 mice (terminal disease; 65 dpi). Loading control: β-actin. Corresponding PrPSc shown in lower blot. Asterisks: overexposed sPrP signals (in tga20) caused white area upon reprobing. M, protein marker. (B) IHC of sPrP [pink, alkaline phosphatase (AP)], total PrP (brownish, DAB), and PrPSc in hippocampus (Hc) and corpus callosum (Cc) of a prion-diseased tga20 mouse. Arrows indicate PrPSc deposition (bottom) and similarly clustered sPrP (top) contrasting with diffuse sPrP in noninfected mice [see (D) for reference]. (C) ADAM10, sPrP, and PrP (including N-terminal fragments resulting from other cleavages) in brains of 6-month-old 5xFAD mice and WT littermates. Actin detected as loading control; human APP [huAPP; 6E10 antibody (Ab)] for genotype confirmation. Quantified sPrP shows no significant (n.s.) differences (mean ± SE; P > 0.05, Student’s t test). (D) PrP (top) and sPrP (bottom) in Prnp0/0, WT, A10 cKO, tga20, and 5xFAD mice. Plaque-like structures are vaguely perceived with pan-PrP staining (magnifications for 5xFAD). No sPrP detected in Prnp0/0 and A10 cKO. Diffuse sPrP (WT and tga20) is converted to a clustered pattern in 5xFAD similar to amyloid plaques detected by 6E10 antibody. (E) Costaining of sPrP and amyloid in WT and 5xFAD. Again, diffuse sPrP changes to clustered signals in 5xFAD. Bold arrows: sPrP in diffuse Aβ deposits. In dense plaques, sPrP is masked by strong brownish signal (thin arrows). Scale bars, 100 μm. (F) Immunofluorescently stained sPrP, Aβ plaques (6E10), and LAMP1 (dystrophic neurites marker) in 5xFAD brains with (PrP-WT) and without PrP expression (PrP-KO). Note that sPrP colocalizes with Aβ plaques, whereas only background is detected in the negative controls. Scale bars, 30 μm. (G) Scheme showing potential neurotoxicity-lowering binding of sPrP to and sequestration of harmful extracellular oligomers.
Fig. 2.
Fig. 2.. PrP-directed antibodies cause increased ADAM10-mediated PrP shedding in N2a cells.
(A) PrP scheme showing important domains (CC, charged cluster; OR, octameric repeat region; HD, hydrophobic domain), GPI anchor position, shedding, and α-cleavage sites, plus epitopes for antibodies used here. aa, amino acids. (B) Prnp mRNA levels in cells either untreated or treated for 16 hours with indicated antibodies or single-chain (sc) derivates. Negative controls: PrP-depleted cells (Prnp KO). n = 3 independent experiments (n = 2 for Prnp KO) with three technical replicas each. No significant differences in Prnp mRNA levels were found among different treatments and untreated controls. (C) Representative immunoblot analysis of fl-PrP in lysates (bottom) and sPrP in precipitated medium (top) after 16 hours of incubation with different PrP-directed IgGs. Loading controls: β-actin (lysates) and sAPPα (medium). fl-PrP levels were reduced (P ≤ 0.05) only in POM2-treated cells compared to secondary antibody controls, whereas significantly increased sPrP/fl-PrP ratios were observed for 6D11 and POM1 treatment (P ≤ 0.0001). Data show means ± SEM of n = 5 independent experiments; statistical significance was estimated with analysis of variance (ANOVA) followed by Bonferroni’s multiple comparisons test. (D) Microscopy of untreated and treated cells showing no alterations in density or overall morphology (scale bar, 100 μm). (E) Treatment with POM2 or POM1 in the presence (+GI254023X) or absence [+DMSO (dimethyl sulfoxide), as diluent control] of an ADAM10 inhibitor (left). Right: N2a WT or N2a stably expressing murine PrP with the human 3F4 epitope (N2a PrP3F4) treated or not with 3F4 antibody targeting that motif. Shedding only increased in PrP3F4-expressing cells. (F) Ascending concentrations of 6D11 reveal a dose dependency of the shedding-stimulating effect (reaching saturation at ~1 μg/ml). (G) The bispecific immunotweezer (scPOM-bi; fused complementarity-determining regions VH/VL of POM2 and POM1; see scheme) increases shedding compared to untreated controls. Quantification with controls set to 1 (mean ± SE; *P = 0.024, Student’s t test). Positive control: 6D11 treatment [reduced levels of sPrP-C1 fragment (asterisk) possibly due to 6D11 sterically hindering α-cleavage before shedding]. *P < 0.05 and ****P < 0.0001.
Fig. 3.
Fig. 3.. Stimulated shedding and lack of toxicity in antibody-treated murine organotypic brain slice cultures.
(A) Cerebellar COCS prepared from tga20 mice (or a Prnp0/0 mouse as negative control) and exposed to either 3F4 IgG (as negative control treatment) or 6D11 antibody. Western blot analysis showing levels of PrP in COCS homogenates (bottom panel including quantification; actin was used as loading control) and sPrP in the culture medium (top panel with quantification on the right). (B) Biochemical assessment of sPrP and sAPPα in culture medium after treatment as above. Asterisks in (A) and (B) indicate the presence of unspecific bands (note the presence in Prnp0/0 samples) detected with the sPrPG228 antibody in COCS medium. (C) Levels of the neuronal marker NeuN in abovementioned COCS homogenates and densitometric quantification (actin used as reference). (D) Morphological analysis of antibody-treated COCS sections prepared from WT mice. Non–PrP-directed mouse antibodies (mIgG) were used as negative control, whereas STS was used to induce toxicity and neuronal loss. DAPI (4′,6-diamidino-2-phenylindol) staining (blue) reveals nuclei of all cells, while NeuN staining indicates the presence of neuronal nuclei. Representative sections are shown. Quantifications of the NeuN-positive signal are presented on the right (mIgG, n = 7; 6D11, n = 9; STS, n = 8). Significance was assessed using unpaired two-tailed Student’s t test (A and C) and one-way ANOVA with Dunnett’s post hoc test (D).
Fig. 4.
Fig. 4.. SAXS curves and modeling for recPrP (23–230) and the recPrP/6D11 antibody complex.
Experimental SAXS profiles (dots) and fits (solid lines) for the best-fitting model of recPrP; data source: SASBDB accession code: SASDHV9 (χ2 = 0.85) (A) and the complex of two recPrP bound to 6D11 IgG (χ2 = 0.83) (B). (C) Overlay of recPrP models resulting from SAXS measurements and showing multiple possible conformations of the flexible N-terminal tail (different shades of green) flanking the structured C-terminal domain. Framed scheme below outlines that movement of the flexible tail may create a cloud (shadowy corona) surrounding the globular domain and partially shielding PrP (green) from being shed by ADAM10 (orange), depending on the actual positioning and potential membrane interactions of the flexible tail (solid versus intermitted lines). (D) Model of the recPrP (23–230)/6D11 IgG complex. The magnified view (framed box) highlights an extended conformation of the flexible N-terminal region and an increased angle and distance to the C-terminal domain (as required to form a complex consistent with the SAXS data). Note that posttranslational modifications such as N-glycans and the GPI anchor are lacking in these analyses using recPrP.
Fig. 5.
Fig. 5.. Single-chain antibodies induce shedding without causing PrP surface retention.
(A) Representative Western blot analysis showing levels of sPrP (and sAPPα as loading control) in precipitated medium and fl-PrP (and actin as loading control) in respective lysates of N2a cells treated with single-chain variable fragments of POM2 (scPOM2) and POM1 (scPOM1) antibodies. Untreated (Untr.) and anti-mouse secondary antibody–treated (2nd Ab) cells served as controls. (B) Densitometric quantification of sPrP (top diagram) and cell-associated PrP levels (bottom diagram). Plotted data show means ± SEM for n = 7 independent repetitions. One-way ANOVA and Bonferroni’s multiple comparisons test were used to calculate significances. Relative sPrP/fl-PrP level was found to be increased in both scPOM-treated cells in comparison to that of secondary antibody controls (P ≤ 0.001). (C) Microscopic assessment of cell density and morphology (scale bar, 50 μm). (D) Cell surface biotinylation assay (top) revealing membrane levels of ADAM10, PrP, and flotillin. Total levels of ADAM10 and PrP in respective cell lysates are shown below. Actin served as loading control in lysates. Note the relative shift toward diglycosylated PrP and mature ADAM10 in biotinylated samples (compared to lysates) as these forms are thought to primarily locate at the cell surface. MW, lane used for molecular weight ladder. (E) Densitometric quantification of PrP levels presented in (D). Plotted data show means ± SEM for n = 3 technical replicas [shown in (D)]. Significance was assessed using Student’s t test (**P < 0.005).
Fig. 6.
Fig. 6.. POM2 IgG treatment results in strong (surface) clustering, uptake, and degradation of PrP.
(A) Time course experiment showing cell-associated PrP levels in N2a cells lysed at different time points after treatment with POM2. (B) Western blot showing cellular levels of PrP, APP, and ADAM10 upon treatment with POM2 or control antibody (3F4) in the presence (+) or absence (−) of the lysosomal inhibitor bafilomycin (Baf A1). Densitometric quantification (below) shows mean (untreated controls set to 1) ± SE; Student’s t test results are considered significant at *P < 0.05 and **P < 0.005. Actin served as loading control in (A) and (B). (C) AFM of recPrP incubated with POM2 or POM1 antibody in overview (left column; scale is indicated) and fivefold further magnification (right column). Bottom: Mica surface treated with protein-free buffer only. (D) Quantification of a solubility assay of a mixture of mouse recPrP (mPrP) with either POM2 (blue graphs) or POM1 (green graphs). Recovery of respective antibodies or PrP alone in solution immediately (t0), 10 min (t10′), or 60 min (t60′) after mixture was set to 100%. (E) Individual frames of confocal time-lapse imaging showing dendrites of rat hippocampal neurons expressing GFP-tagged PrP (green) taken directly before (t0) and at several indicated time points after treatment with POM2, 6D11, or 3F4 antibody (for a complete overview, refer to fig. S10A and movie S1). Right lane: Subtraction image of time point 5 min minus “before treatment” in pseudocolor scale (right) to visualize changes in PrP-GFP localization. Scale bars, 4 μm. (F) Representative electron microscopy pictures of N2a cells after 5 min (left) or 30 min (middle and right) of treatment with POM2 antibody showing clustering and uptake of PrP-directed immunogold particles. Scale bars, 250 nm.
Fig. 7.
Fig. 7.. Slowdown in the lateral diffusion of endogenous PrPC by IgGs directed against repetitive epitopes within the flexible tail.
(A) SPT-QD to quantify the diffusion coefficient of endogenous PrPC and using QD precoupled to anti-PrPC antibodies (POM-x-QD). (B) Under control conditions (no preexposure to high concentration of antibodies), similar diffusion coefficient values of PrPC were obtained using various antibodies [globular domain (GD)–directed IgGs: POM1 and POM19; flexible tail (FT)–directed IgGs: POM2 and POM11; or hydrophobic core (HC)–directed: POM3]. Synapses were identified using FM4-64 labeling. Plotted data show means ± SEM values for three independent experiments, and one-way ANOVA test was performed with no significant difference. (C) SPT-QD of PrPC using POM-x-QD antibody following preexposure (1 hour) to a high concentration (1 μg) of POM-x antibodies. (D) Only preexposure to FT-directed IgGs, but not to the others, greatly (>20%) reduced the diffusion coefficient of PrPC. Plotted data show means ± SEM for three independent experiments. Paired t test was performed to compare the difference from control condition [no preexposure, (B)]. Data for all QDs analyzed are shown in table S2.
Fig. 8.
Fig. 8.. Scheme summarizing potential protective roles of sPrP and effects of PrP-directed ligands.
(A) PrP (green) expressed at the cell surface is a central player in neurodegenerative diseases, as it serves as a substrate for prion conversion and PrPSc (pink) production in prion diseases and (in complex with certain transmembrane proteins) acts as a receptor for toxic protein conformers (pink), such as Aβ in AD, initiating toxic signaling (pink thunderbolts and skulls). As supported by several published reports, mechanisms that lower PrP levels at the plasma membrane, such as the endogenous shedding mediated by ADAM10 (orange), are considered neuroprotective. In addition, several studies have shown that released forms or fragments of PrP interfere with toxic proteins in the extracellular space. Our data suggest that sPrP inversely correlates with PrPSc formation and colocalizes with deposits of PrPSc and Aβ, indicating a blocking and possible sequestrating activity of sPrP toward harmful conformers. As a consequence, stimulated shedding may represent a promising therapeutic option. (B) Regarding the latter, we here provide evidence that several PrP-directed ligands binding to different epitopes cause an increased ADAM10-mediated shedding. While cross-linking may be involved (as in the case of IgGs), it at least is not a prerequisite for this action (scFv). (C) One exception to this shedding-stimulating effect was found for IgGs directed against several (repetitive) epitopes within the disordered and flexible N-terminal half of PrP (e.g., POM2; blue). These ligands rather cause a strong surface clustering [possibly by multimeric cross-linking (as indicated in this scheme) or other structural alterations facilitating tight molecular interaction] followed by fast endocytosis and (lysosomal) degradation of PrP (which may likewise be beneficial against neurodegenerative processes).

References

    1. Aguzzi A., Haass C., Games played by rogue proteins in prion disorders and Alzheimer’s disease. Science 302, 814–818 (2003). - PubMed
    1. Vaquer-Alicea J., Diamond M. I., Propagation of protein aggregation in neurodegenerative diseases. Annu. Rev. Biochem. 88, 785–810 (2019). - PubMed
    1. Checler F., Vincent B., Alzheimer’s and prion diseases: Distinct pathologies, common proteolytic denominators. Trends Neurosci. 25, 616–620 (2002). - PubMed
    1. Benilova I., De Strooper B., Prion protein in Alzheimer’s pathogenesis: A hot and controversial issue. EMBO Mol. Med. 2, 289–290 (2010). - PMC - PubMed
    1. Lauren J., Gimbel D. A., Nygaard H. B., Gilbert J. W., Strittmatter S. M., Cellular prion protein mediates impairment of synaptic plasticity by amyloid-β oligomers. Nature 457, 1128–1132 (2009). - PMC - PubMed