. 2021 Nov 24;13(621):eabg2612.
doi: 10.1126/scitranslmed.abg2612. Epub 2021 Nov 24.

Oxidative damage and delayed replication allow viable Mycobacterium tuberculosis to go undetected

Affiliations

Oxidative damage and delayed replication allow viable Mycobacterium tuberculosis to go undetected

Kohta Saito et al. Sci Transl Med. .

Abstract

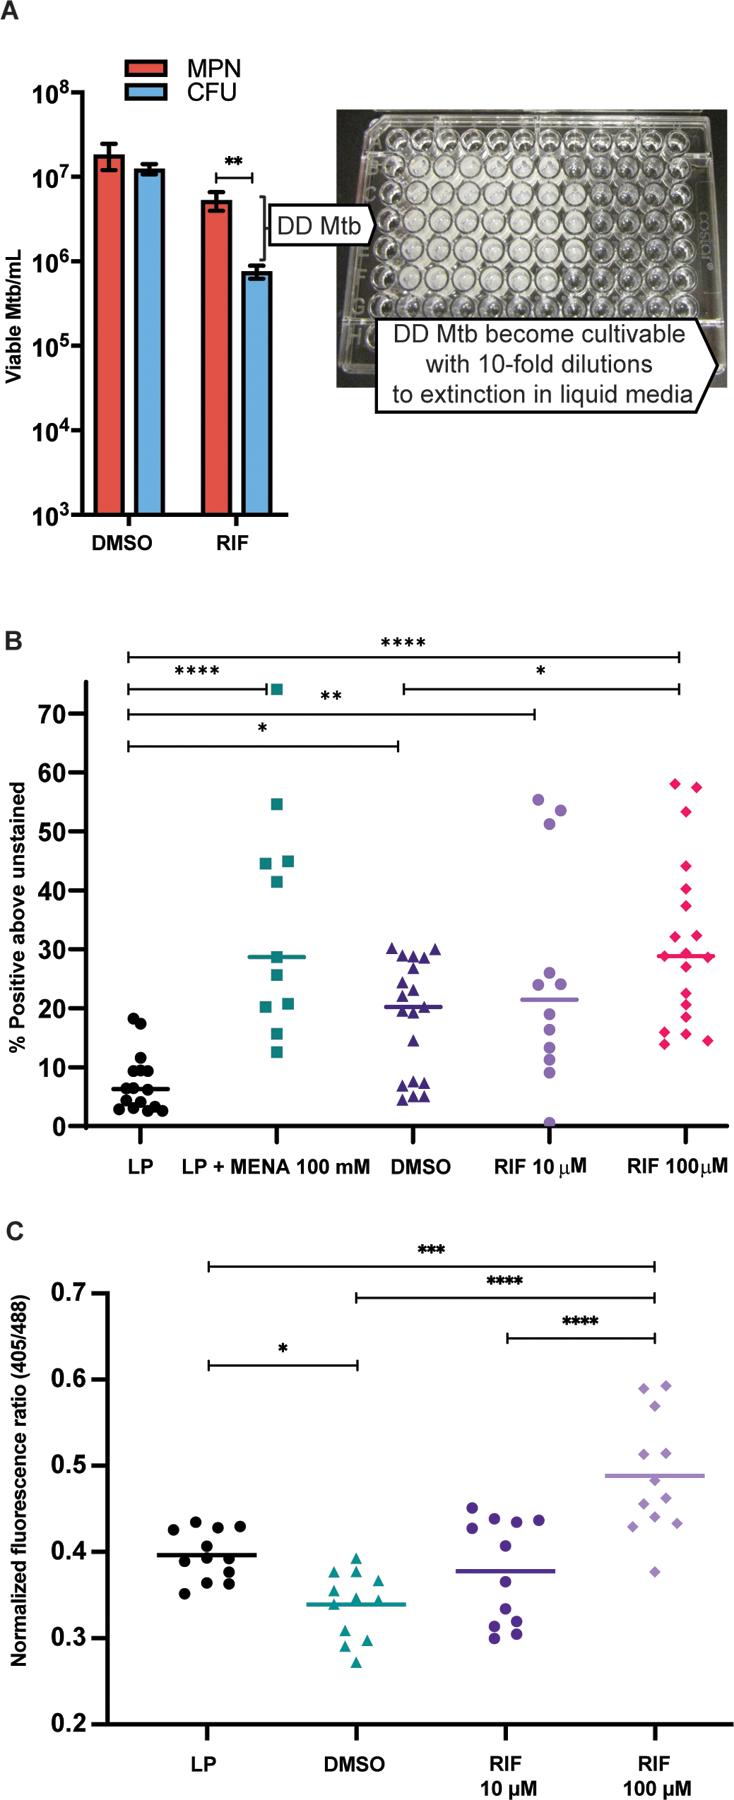
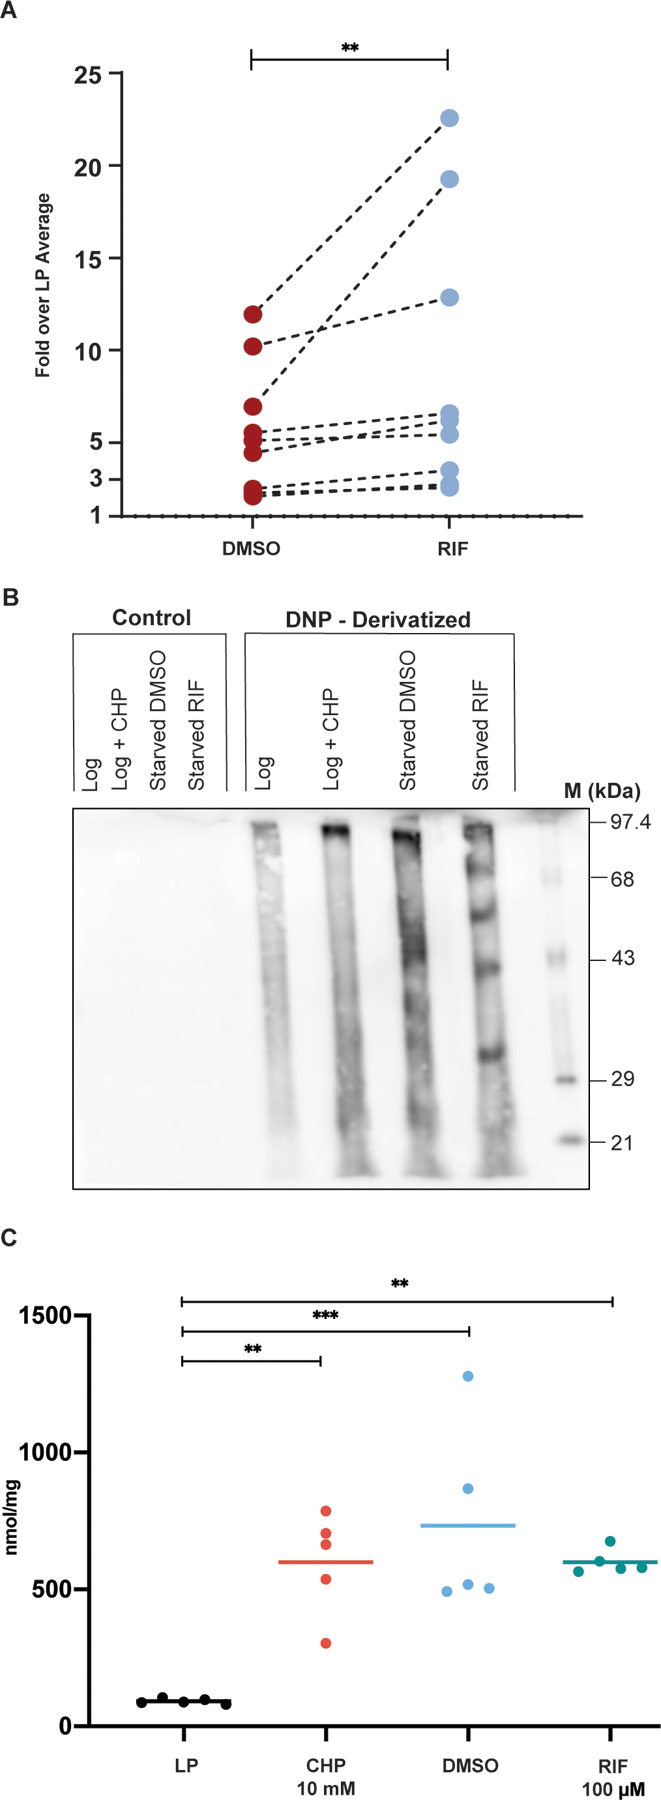
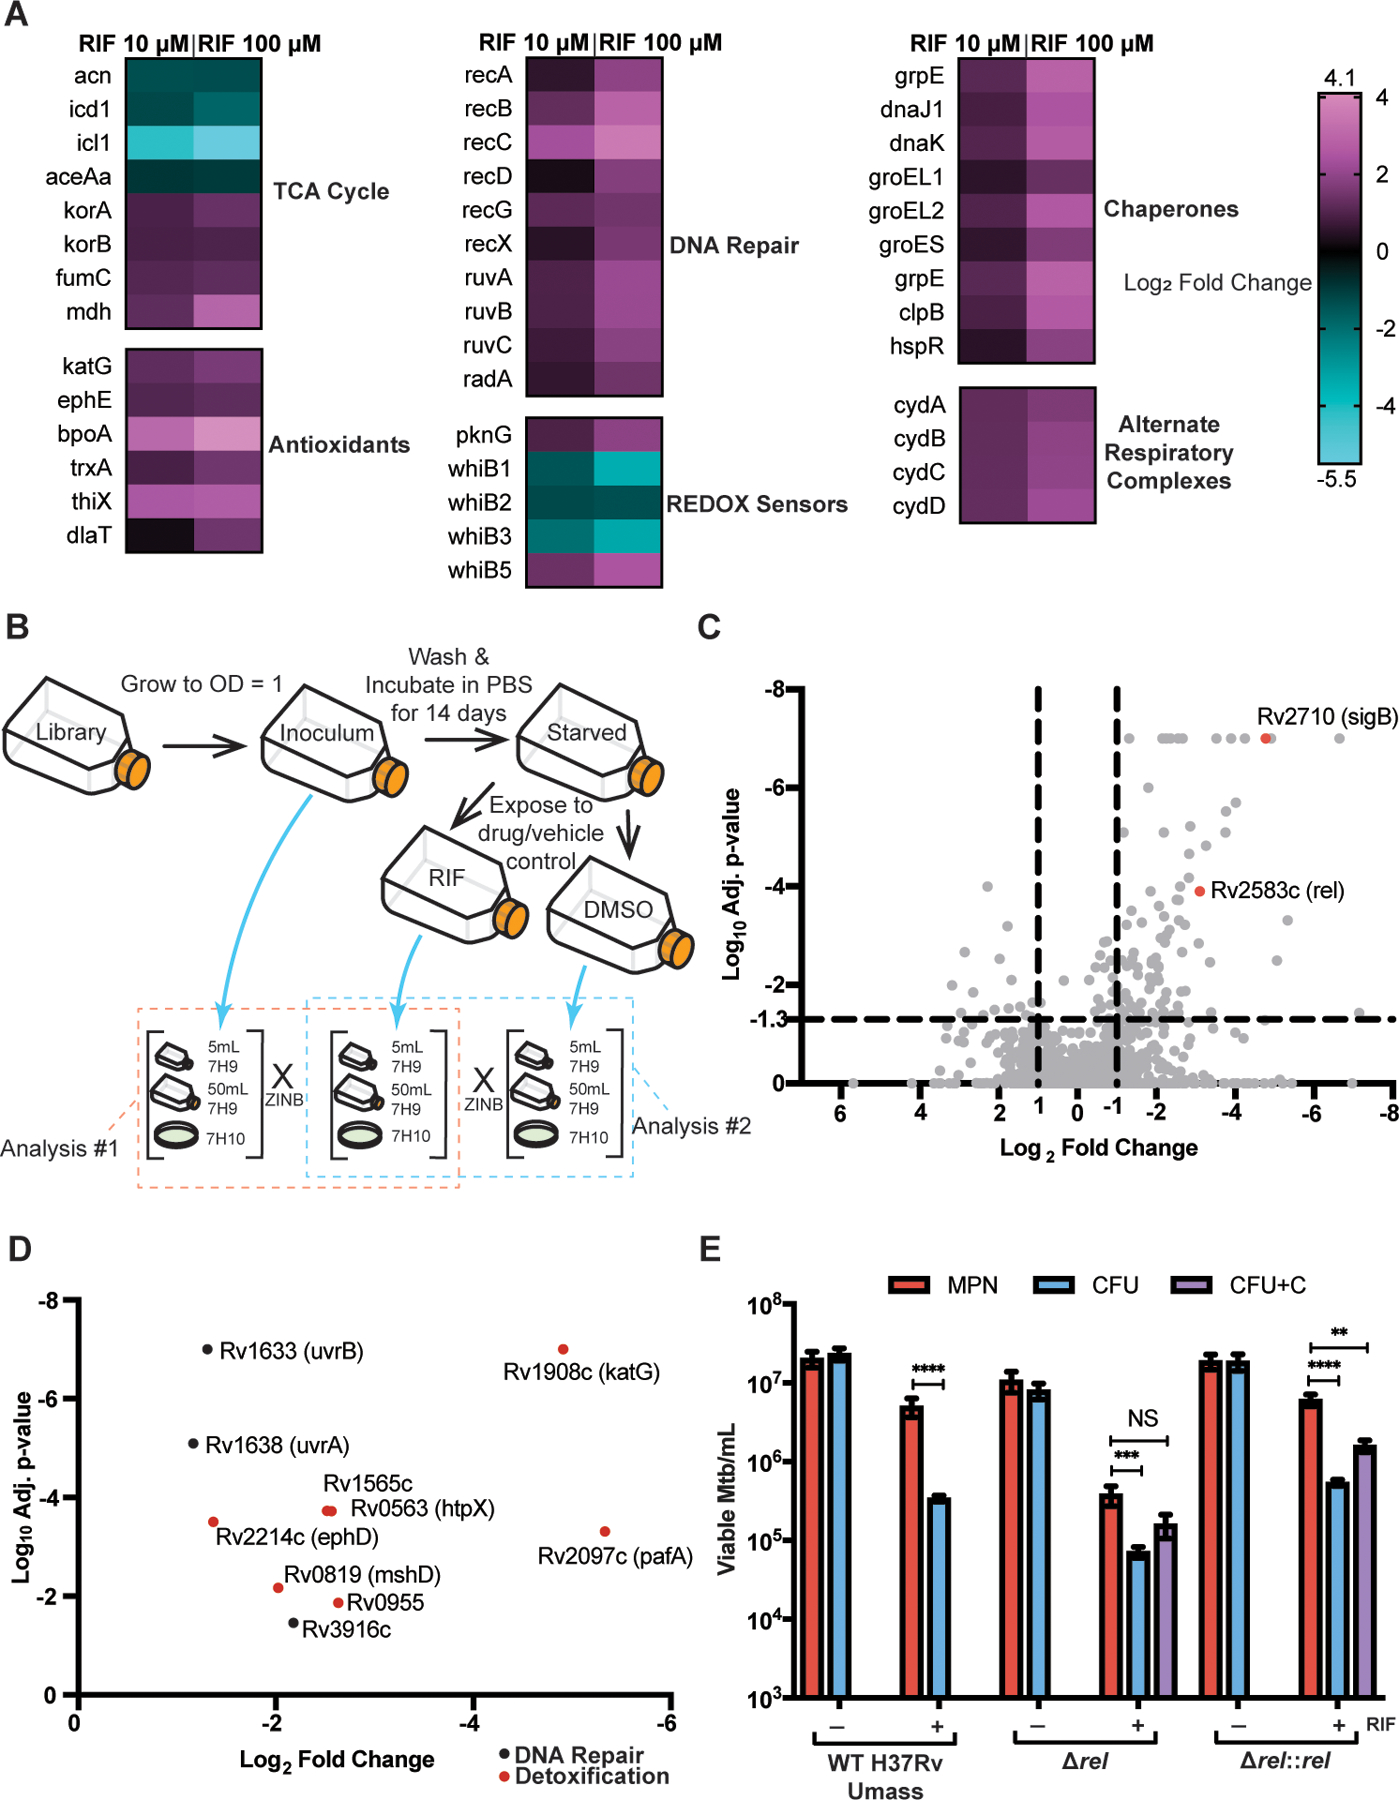
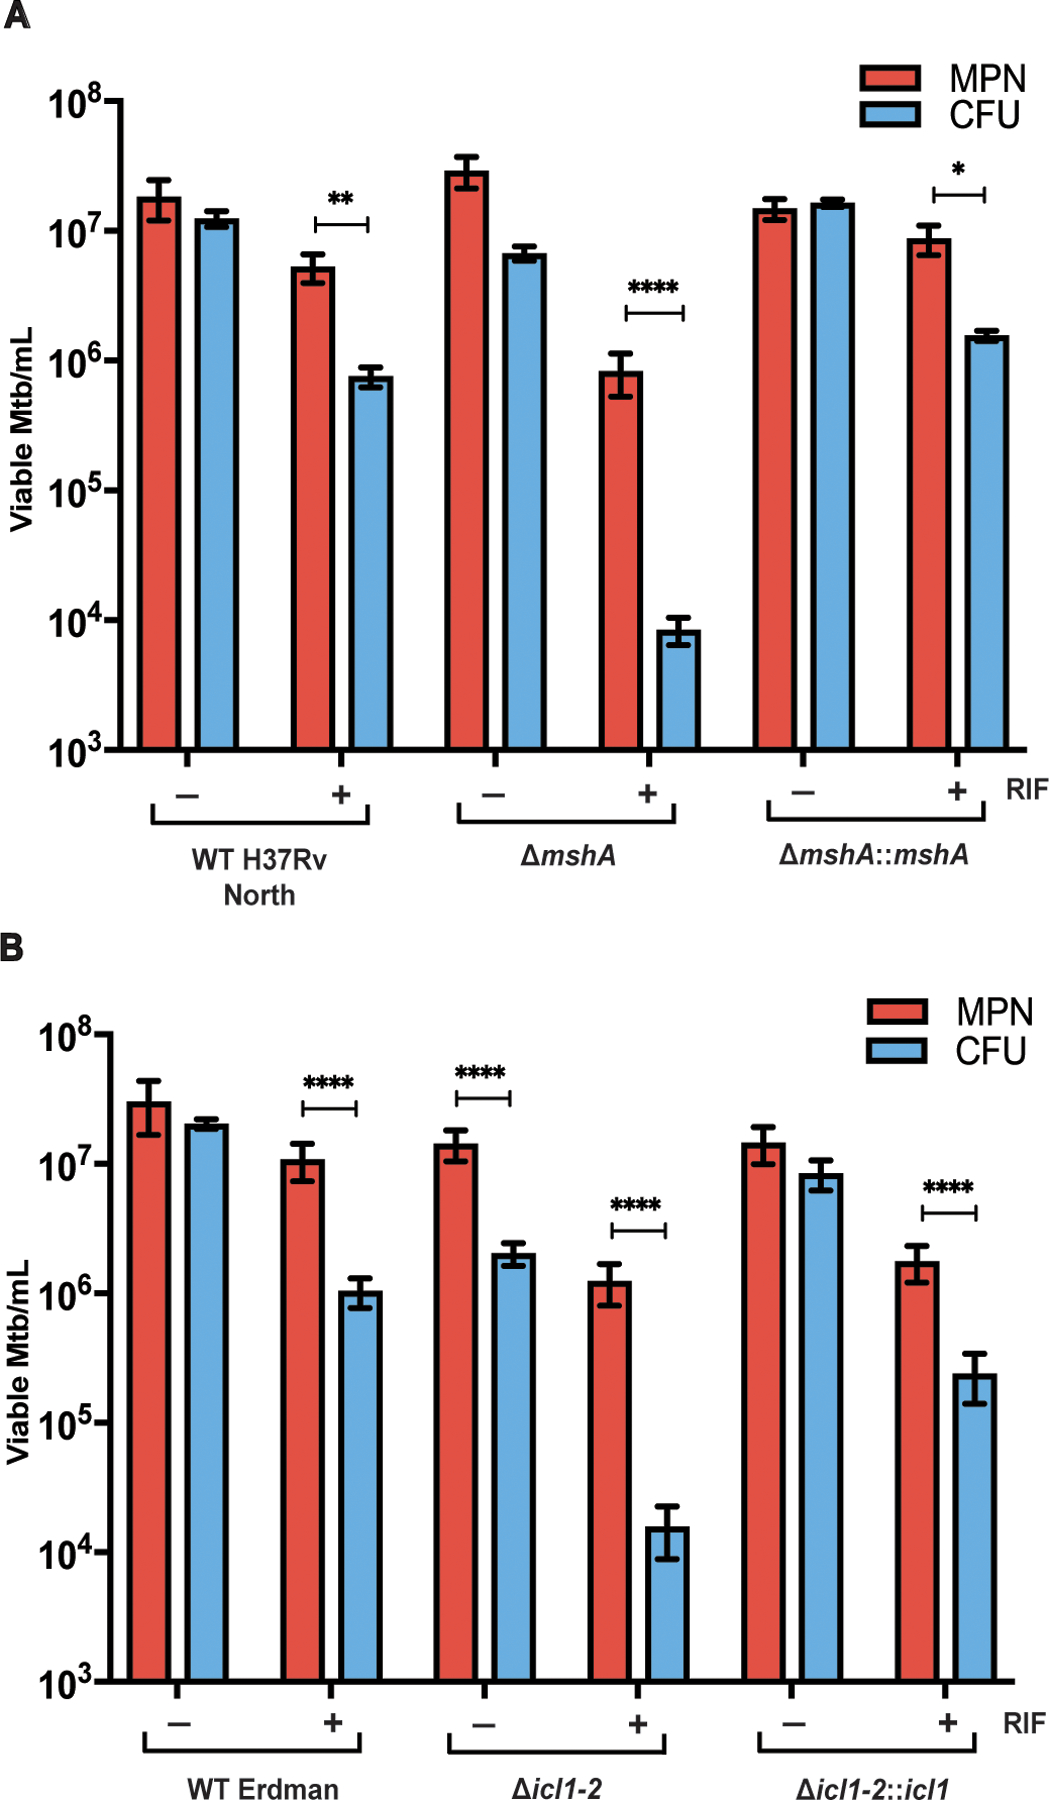
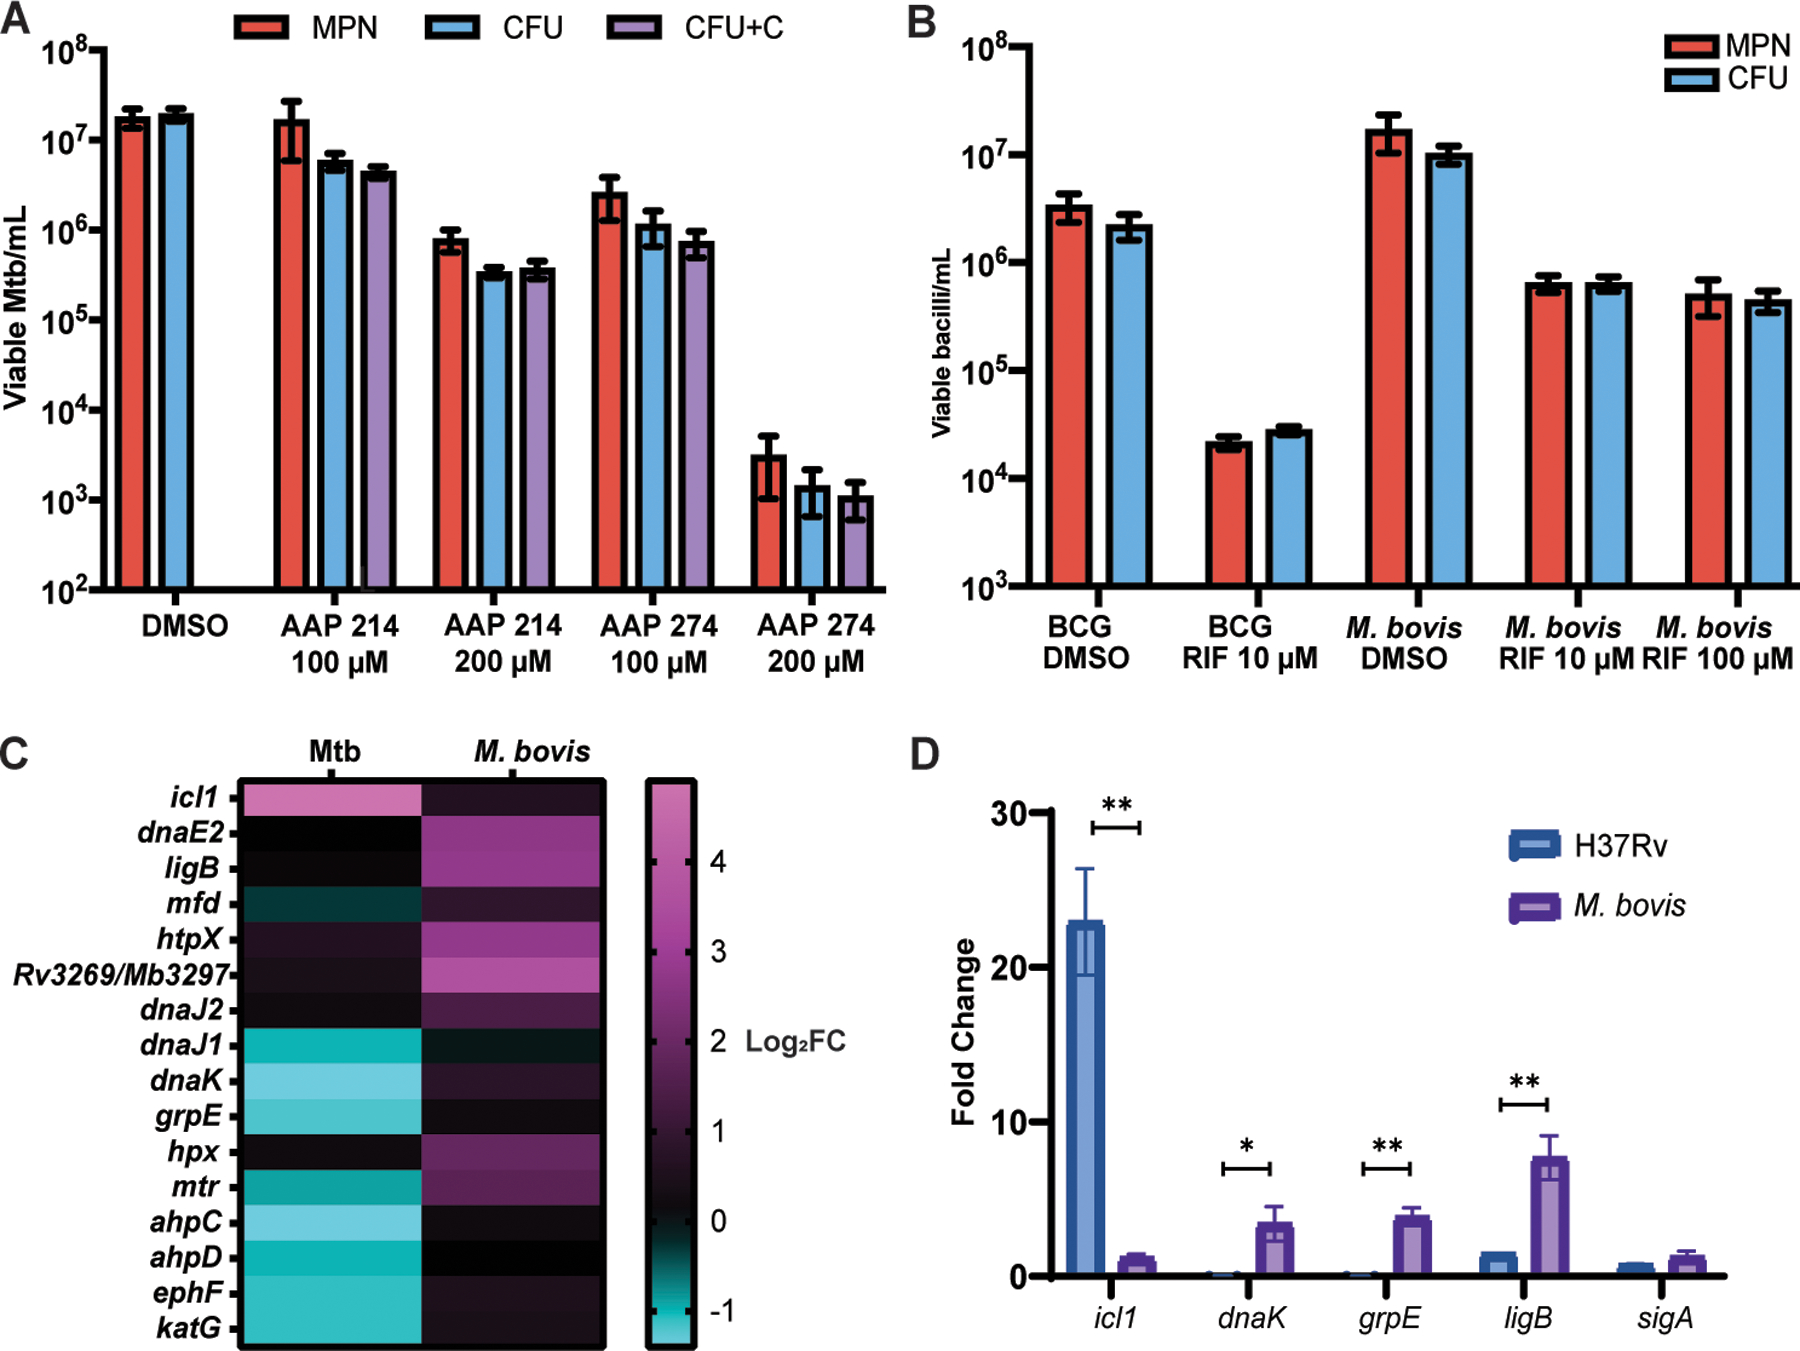
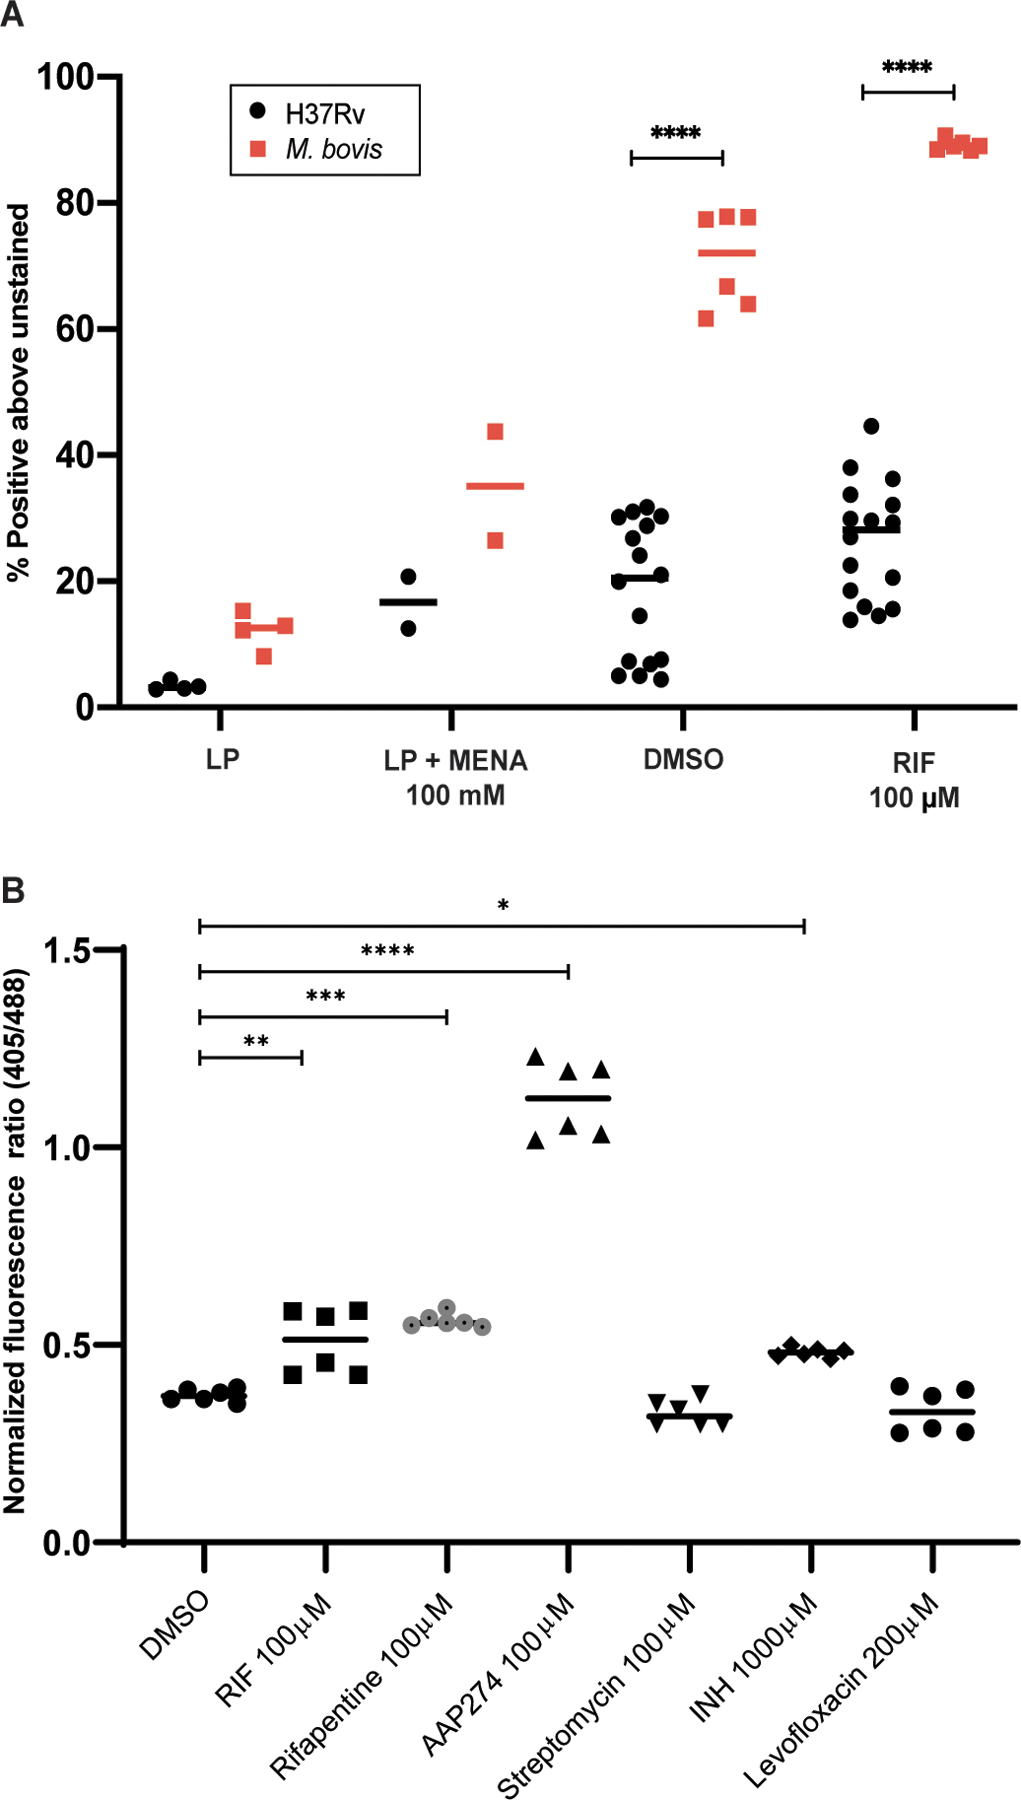
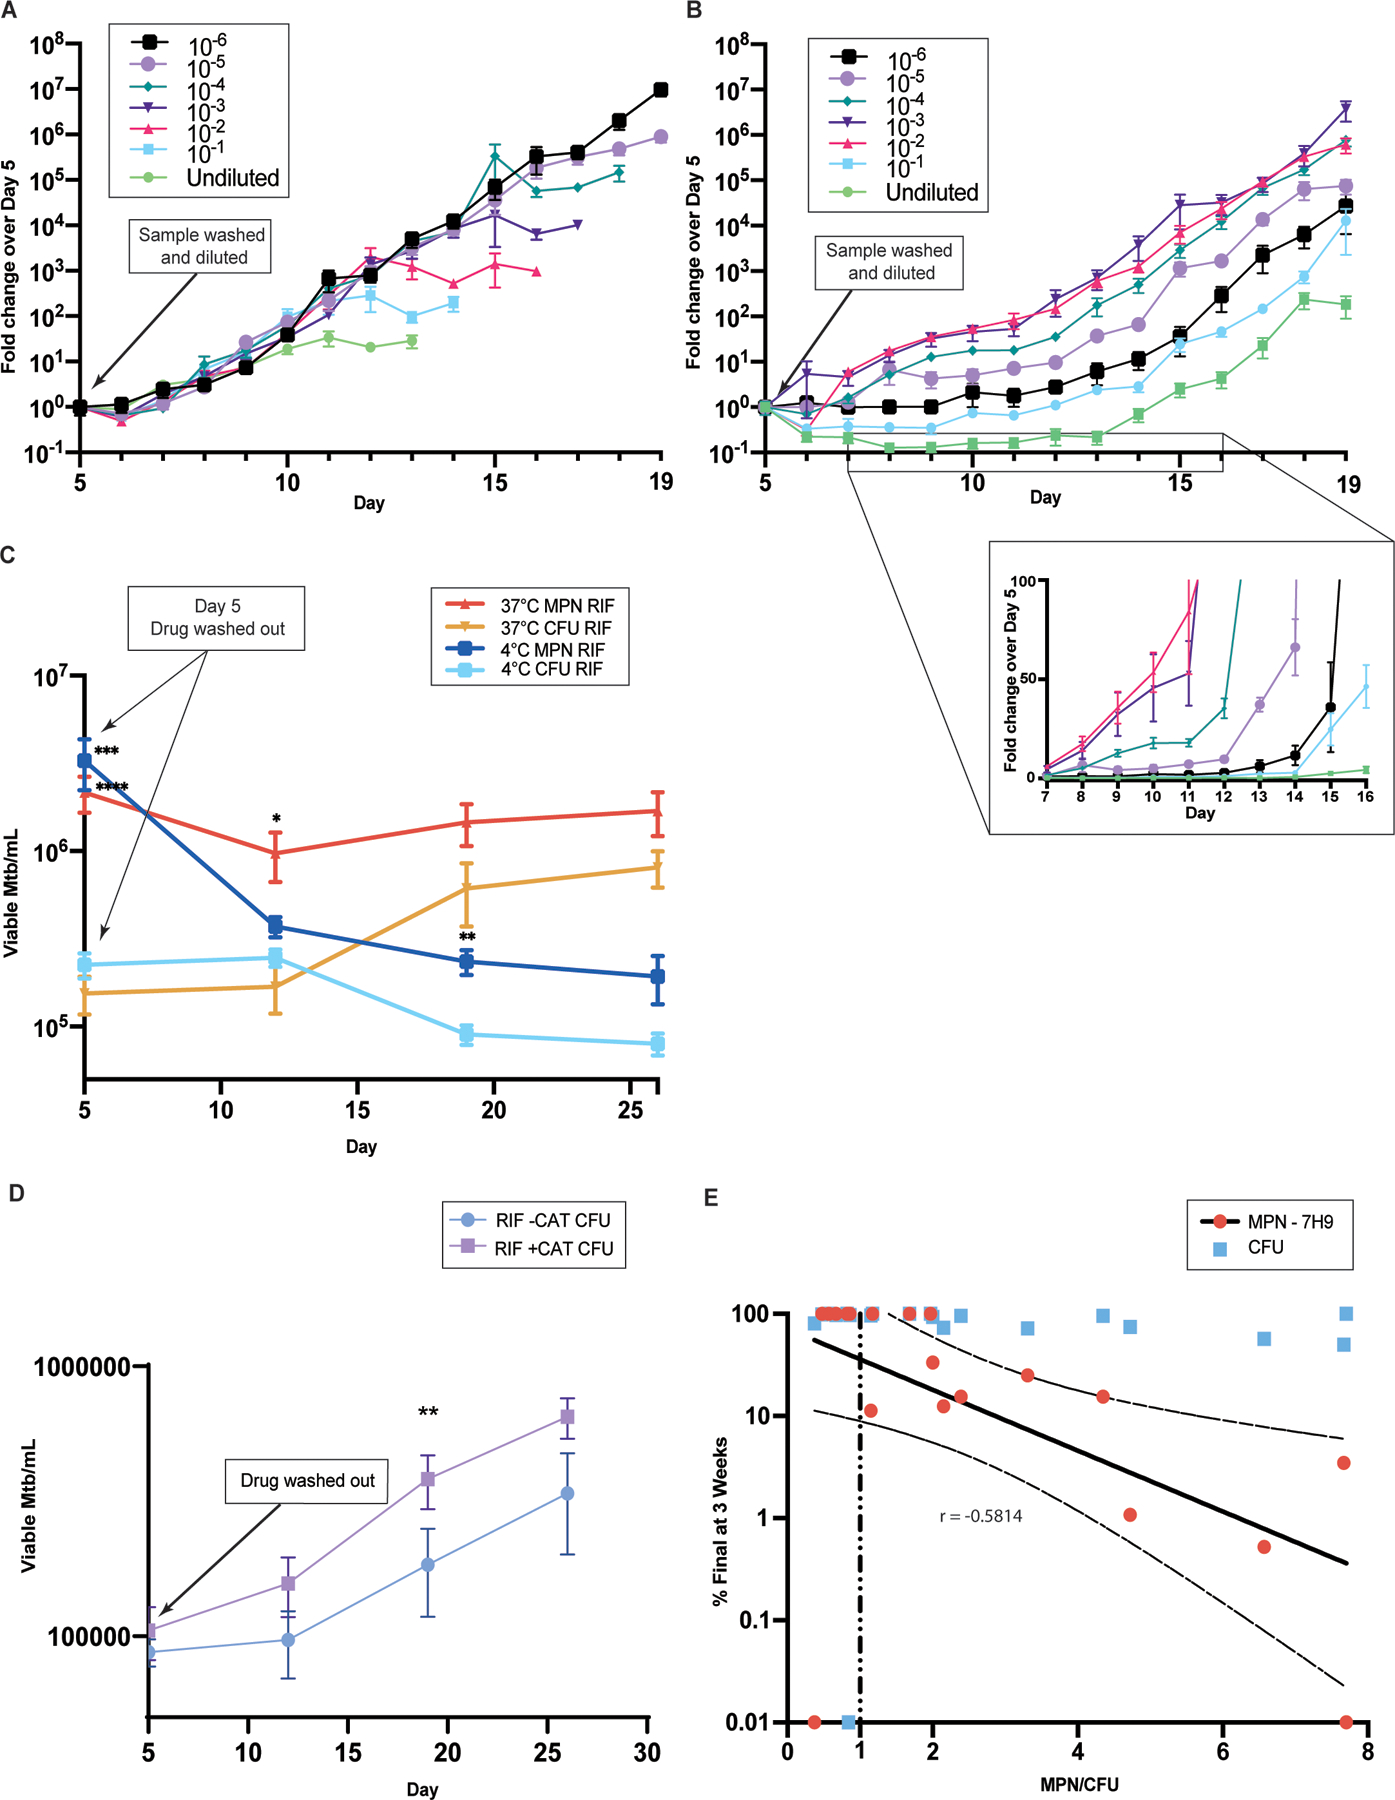
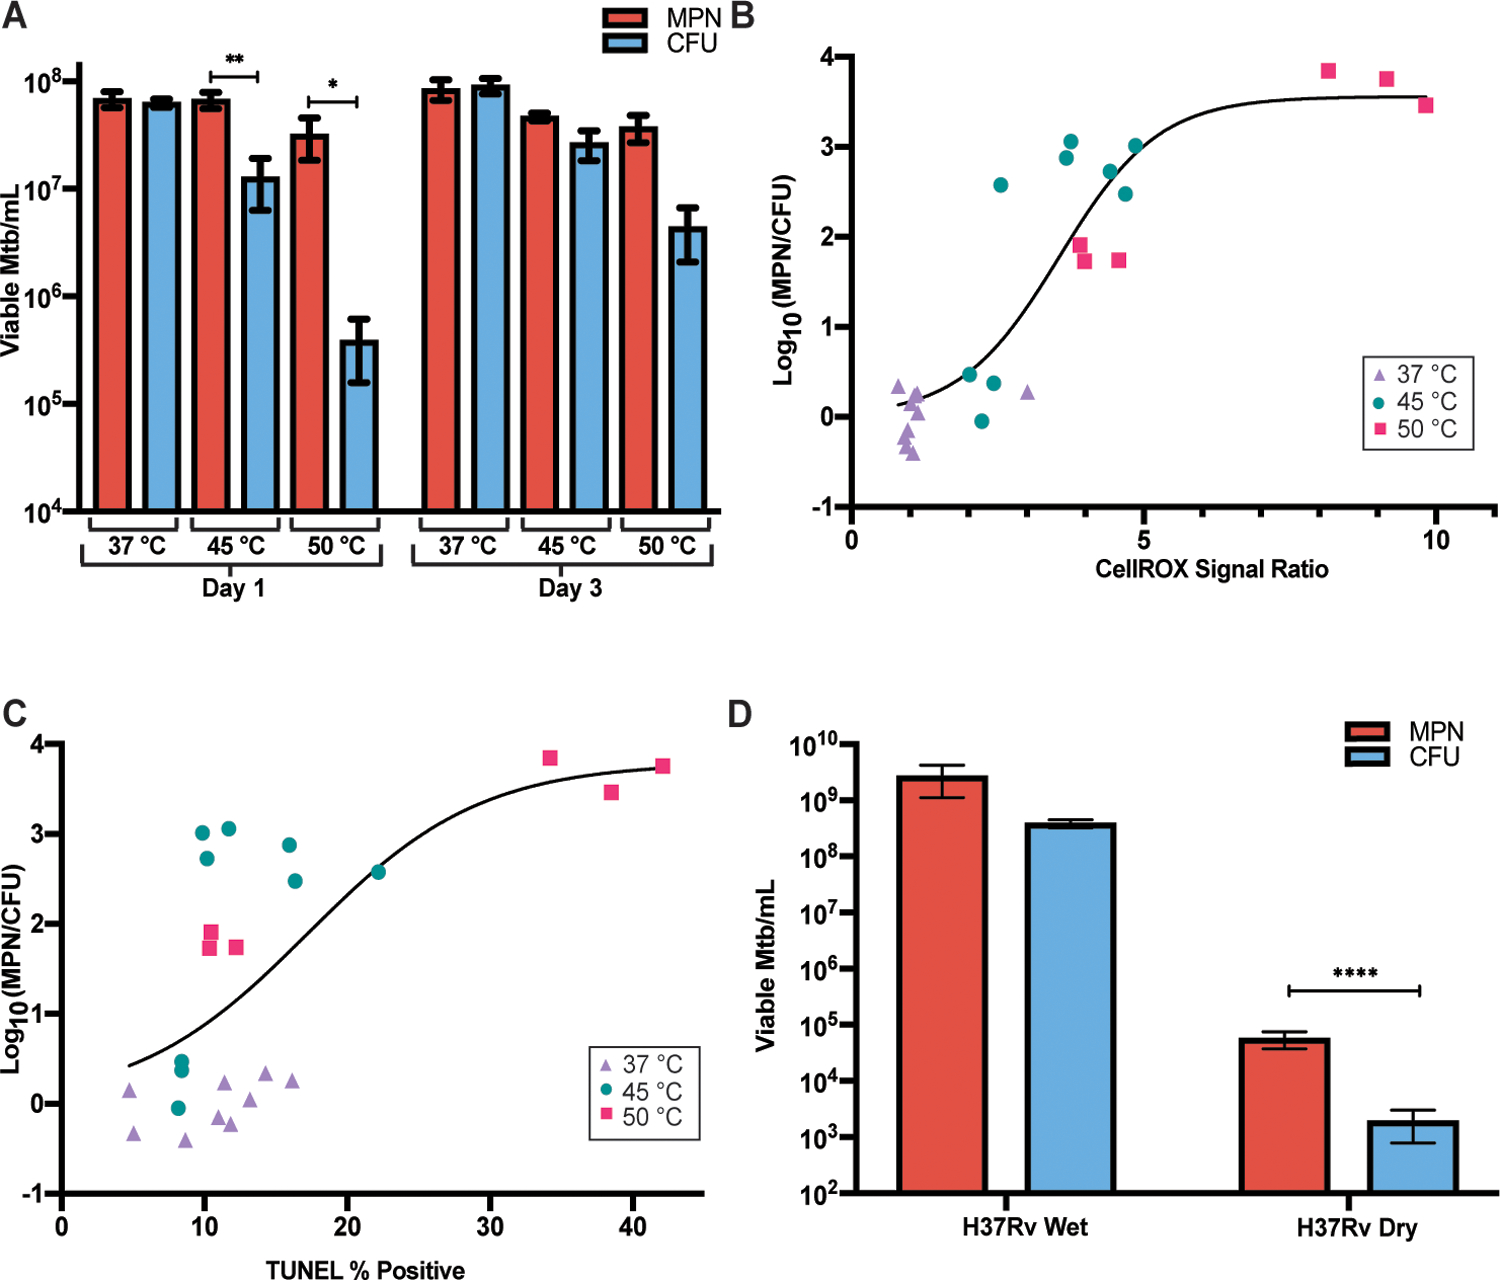
“Viable but nonculturable” states of bacteria pose challenges for environmental and clinical microbiology, but their biological mechanisms remain obscure. Mycobacterium tuberculosis (Mtb), the leading cause of death from infection until the coronavirus disease 2019 pandemic, affords a notable example of this phenotype. Mtb can enter into a “differentially detectable” (DD) state associated with phenotypic antimicrobial resistance. In this state, Mtb cells are viable but undetectable as colony-forming units. We found that Mtb cells enter the DD state when they undergo sublethal oxidative stress that damages their DNA, proteins, and lipids. In addition, their replication process is delayed, allowing time for repair. Mycobacterium bovis and its derivative, BCG, fail to enter the DD state under similar conditions. These findings have implications for tuberculosis latency, detection, relapse, treatment monitoring, and development of regimens that overcome phenotypic antimicrobial resistance.


Conflict of interest statement

Declaration of Interests

CN serves on advisory bodies for Tres Cantos Open Lab Foundation, Tri-Institutional Therapeutics Discovery Institute, Bridge Medicines, Pfizer External Sciences and Innovation, and Leap Therapeutics. All other authors declare no conflicts of interest related to this work.

Figures

Fig. 1.
Fig. 1.. DD Mtb undergo oxidative stress.
(A) Representative results of DD Mtb estimation in the PBS-RIF in vitro model are shown with photo of a representative liquid limiting dilution assay used for most probable number (MPN) calculations. Mtb cells were starved in PBS for at least 2 weeks, then exposed to either high dose RIF (10 to 100 µM) or DMSO (vehicle control). After washing out the RIF or DMSO, the culture undergoes 10-fold serial dilutions across 5 technical replicates, and the number of positive wells is inputted into an MPN calculator to estimate the original, undiluted concentration of viable cells. Data were analyzed using a mixed effects analysis with Sidak’s multiple comparisons test. (B) Flow cytometry analysis is shown of log phase (LP) Mtb, LP Mtb exposed to 100 mM menadione (LP + MENA), starved then DMSO-exposed Mtb (DMSO; vehicle control), and starved then RIF-exposed Mtb (RIF), after staining with CellROX Green. Data shown are representative of 7 experiments with 1 to 3 biological replicates each, except RIF 10 µM data which are from 4 experiments with 3 biological replicates each. Data were analyzed using a mixed effects analysis with Tukey’s multiple comparisons test. Horizontal bars indicate median. (C) Flow cytometry analysis of Mrx1-roGFP2 plasmid containing H37Rv (6 experiments, 12 biological replicates total) in LP, PBS starved then DMSO or RIF exposed Mtb. Statistics were calculated by one-way ANOVA with Tukey’s multiple comparisons test. Horizontal bars indicate mean. *adj p < 0.05, **adj p < 0.01, ***adj p < 0.001, ****adj p < 0.0001.
Fig. 2.
Fig. 2.. DD Mtb exhibit widespread damage to DNA, proteins, and lipids.
(A) TUNEL assay flow cytometry analysis of starved cells exposed to DMSO or RIF is shown normalized to the average LP percent positive. Data are representative of 3 experiments with 3 biological replicates each. Lines connecting DMSO and RIF indicate arms of the same biological replicate. Data were analyzed using a Wilcoxon matched-pairs signed rank test. **p < 0.01. (B) A representative western blot is shown of Oxyblot detection of carbonyl groups on proteins derivatized by 2,4-dinitrophenylhydrazine (DNPH) from LP cells, LP cells treated with 10 mM cumene hydroperoxide (CHP), and starved cells treated with DMSO or RIF. Control lanes were processed in the same way but lack DNPH. M: DNP-derivatized molecular weight protein standards. (C) Results of a Cayman LPO assay estimating lipid hydroperoxides is shown using lipid extracts prepared from LP cells, LP cells treated with 10 mM CHP, and PBS starved cells treated with DMSO or RIF. Data are representative of 3 experiments with 5 biological replicates total. Data were analyzed using a one-way ANOVA with Tukey’s multiple comparisons test. **adj p < 0.01, ***adj p < 0.001.
Fig. 3.
Fig. 3.. Characterization of DD Mtb by RNA-sequencing and Transposon-sequencing.
(A) Heat maps of selected significantly upregulated and downregulated genes as compared to vehicle control (DMSO) are shown. Data are representative of 2 experiments with 3 biological replicates each. (B) A schematic for TnSeq experiment and data analysis is shown. ZINB, zero-inflated negative binomial. (C) A volcano plot of transposon mutants depleted in starved, RIF exposed cells is shown as compared to input library. Data are representative of 2 experiments with 1 sample each. (D) Oxidative stress response genes and DNA damage repair genes from (C) are highlighted. (E) Viable cell counts are shown for wild type (WT) H37Rv UMass, ∆rel, and ∆rel::rel after starvation and 5 days of RIF or DMSO exposure. Data are representative of 2 experiments with 3 biological replicates each. CFU+C = CFU grown with charcoal supplementation. Data were analyzed using a mixed-effects analysis with Sidak’s multiple comparisons test. **adj p < 0.01, ***adj p < 0.001, ****adj p < 0.0001; NS, not significant.
Fig. 4.
Fig. 4.. Dysregulation of specific stress response genes influences the DD phenotype.
(A) Viable cell counts are shown for WT H37Rv, ∆mshA, and ∆mshA::mshA after starvation and 5 days of RIF or DMSO exposure. Data are representative of 2 experiments with 3 biological replicates each. Data were analyzed using a mixed-effects analysis with Sidak’s multiple comparisons test. (B) Viable cell counts are shown for parent wild type (WT) Erdman Mtb strain, ∆icl1–2, and ∆icl1–2::icl1 after starvation and 5 days of RIF or DMSO exposure. Data are representative of 3 experiments with 3 biological replicates each. Data were analyzed with a two-way ANOVA with Sidak’s multiple comparisons test. *adj p < 0.05, **adj p < 0.01, ***adj p < 0.001, ****adj p < 0.0001.
Fig. 5.
Fig. 5.. DD formation is specific to rifamycins in the PBS-RIF model, and M. bovis is unable to enter the DD state in the PBS-RIF model.
(A) Viable cell counts using CFU, CFU with charcoal (CFU+C), and MPN-limiting dilution assays are shown after starvation and 5 days of the exposure to Nα-aroyl-N-aryl-phenylalaninamide (AAP) direct RNA polymerase inhibitors (AAP 214 and 274) or DMSO exposure. Data are representative of 2 experiments with 3 biological replicates each. Data were analyzed using a mixed-effects analysis with Sidak’s multiple comparisons test. (B) Viable cell counts are shown for BCG Pasteur (2 experiments, 3 biological replicates each) and M. bovis (3 experiments, 3 biological replicates each, except R100, which is 2 experiments, 3 biological replicates each) after starvation and 5 days of RIF or DMSO exposure. Data were analyzed using a two-way ANOVA with Sidak’s multiple comparisons test. (C) A heat map of log2 fold change in transcripts is shown after PBS starvation without RIF exposure as compared to LP in Mtb and in M. bovis, according to RNAseq. (D) Fold change in icl1, dnaK, grpE, ligB, and sigA transcripts are shown as determined by qPCR after 4 weeks of PBS starvation and without RIF exposure as compared to LP cells, normalized to 16s rRNA, in H37Rv and M. bovis. Data were analyzed using multiple paired t-tests with Holm-Sidak correction for multiple comparisons. *adj p < 0.05, **adj p < 0.01.
Fig. 6.
Fig. 6.. DD formation is correlated with intermediate degrees of oxidative stress.
(A) Flow cytometry analysis is shown after staining M. bovis with CellROX Green as compared with Mtb. M. bovis data are from 2 experiments; Mtb data are as in Fig. 1B. Data were analyzed using a two-way ANOVA with Sidak’s multiple comparisons test. (B) Flow cytometry analysis is shown after starvation and exposure to RIF, rifapentine (RFP), isoniazid (INH), streptomycin (STR), levofloxacin (LVX), and AAP274 of H37Rv with the mrx1-roGFP2 plasmid. Data are representative of 2 experiments with 3 biological replicates each. Data were analyzed using a one-way ANOVA with Tukey’s multiple comparisons test. *adj p < 0.05, **adj p < 0.01, ***adj p < 0.001, ****adj p < 0.0001.
Fig. 7.
Fig. 7.. Growth delay allows recovery of DD Mtb’s ability to grow as CFU.
(A and B) Daily CFU counts of serially 10-fold diluted cultures in 7H9 complete are shown after 4 weeks of starvation and 5 further days of exposure to DMSO (1%) (A) or RIF (100 µM) (B), normalized to initial counts on the day of drug washout (day 5). Data are representative of 2 experiments with 3 biological replicates each. The inset in B shows days 7 to 16 with linear y-axis scale. (C) Serially sampled viable cell counts of DD Mtb re-suspended in PBS are shown after drug removal at 37 °C (data are representative of 7 experiments with 3 biological replicates each) and 4 °C (data are representative of 3 experiments with 3 biological replicates each). Data were analyzed using a mixed-effects analysis; only significant differences between MPN and CFU at the same temperature are shown; ***adj p < 0.001, 37 °C; ****adj p < 0.0001, 4 °C; *adj p < 0.05, only 37 °C; **adj p < 0.01, only 4 °C. (D) Serially sampled CFU counts are shown for Mtb subjected to starvation and exposure to RIF 10 µM and re-suspended in PBS after drug removal with and without 1400 units of human catalase (CAT) added one day prior to RIF exposure and again after drug removal. Data are representative of 2 experiments with 3 biological replicates each. Data were analyzed using multiple paired t-tests with Holm-Sidak correction for multiple comparisons. **adj p < 0.01 (E) The proportion of DD Mtb in patient sputa was plotted against the percentage of the final viable counts accounted for at 3 weeks of outgrowth, n=20. Shown with linear regression and 95% confidence intervals for MPN data after log transformation.
Fig. 8.
Fig. 8.. DD Mtb can form without starvation, antibiotics, or limiting dilution.
(A) Viable cell counts are shown for LP cells exposed for 24 hours to 37 °C, 45 °C and 50 °C immediately following heat exposure and after 48 hours at 37 °C. Data are representative of 3 experiments with 3 biological replicates each. Data were analyzed by a two-way ANOVA with Tukey’s multiple comparisons test. (B) CellROX % positive, normalized to average 37 °C CellROX % positive, is plotted versus proportion of DD Mtb after 1 day of indicated temperature exposures. Data are representative of 3 experiments with 3 biological replicates each and are shown with a nonlinear fit curve. (C) TUNEL positivity is plotted versus proportion of DD Mtb after 1 day of indicated temperature exposures. Data are representative of 3 experiments with 3 biological replicates each; one set of 50 °C was omitted due to extensive killing. Data are shown with a nonlinear fit curve. (D) Viable cell counts are shown for LP cells grown on filters and either desiccated or placed on a pool of saline for 7 days at 37 °C, 70% humidity, and room air CO2. Data are representative of 3 experiments with 2 to 3 biological replicates each. Data were analyzed by a two-way ANOVA with Sidak’s multiple comparisons test. All CFU were recorded and analyzed as the limit of detection, 100 CFU, if no growth was detected. *adj p < 0.05, **adj p < 0.01, ****adj p < 0.0001.

Similar articles

Cited by

References

    1. Global tuberculosis report 2020 (World Health Organization, Geneva, Switzerland, 2020).
    1. Gillespie SH, Crook AM, McHugh TD, Mendel CM, Meredith SK, Murray SR, Pappas F, Phillips PPJ, Nunn AJ, Four-month moxifloxacin-based regimens for drug-sensitive tuberculosis. New England Journal of Medicine 371, 1577–1587 (2014). - PMC - PubMed
    1. Merle CS, Fielding K, Sow OB, Gninafon M, Lo MB, Mthiyane T, Odhiambo J, Amukoye E, Bah B, Kassa F, N’Diaye A, Rustomjee R, de Jong BC, Horton J, Perronne C, Sismanidis C, Lapujade O, Olliaro PL, Lienhardt C, A four-month gatifloxacin-containing regimen for treating tuberculosis. New England Journal of Medicine 371, 1588–1598 (2014). - PubMed
    1. McCune RM, Feldmann FM, Lambert HP, McDermott W, Microbial persistence. I. The capacity of tubercle bacilli to survive sterilization in mouse tissues. J Exp Med 123, 445–468 (1966). - PMC - PubMed
    1. Mukamolova GV, Turapov O, Malkin J, Woltmann G, Barer MR, Resuscitation-promoting factors reveal an occult population of tubercle bacilli in sputum. Am J Respir Crit Care Med 181, 174–180 (2010). - PMC - PubMed

Publication types