. 2022 Jan 1;33(1):ar11.
doi: 10.1091/mbc.E21-11-0558-T. Epub 2021 Nov 24.

ER-localized phosphatidylethanolamine synthase plays a conserved role in lipid droplet formation

Affiliations

ER-localized phosphatidylethanolamine synthase plays a conserved role in lipid droplet formation

Mehmet Oguz Gok et al. Mol Biol Cell. .

Abstract

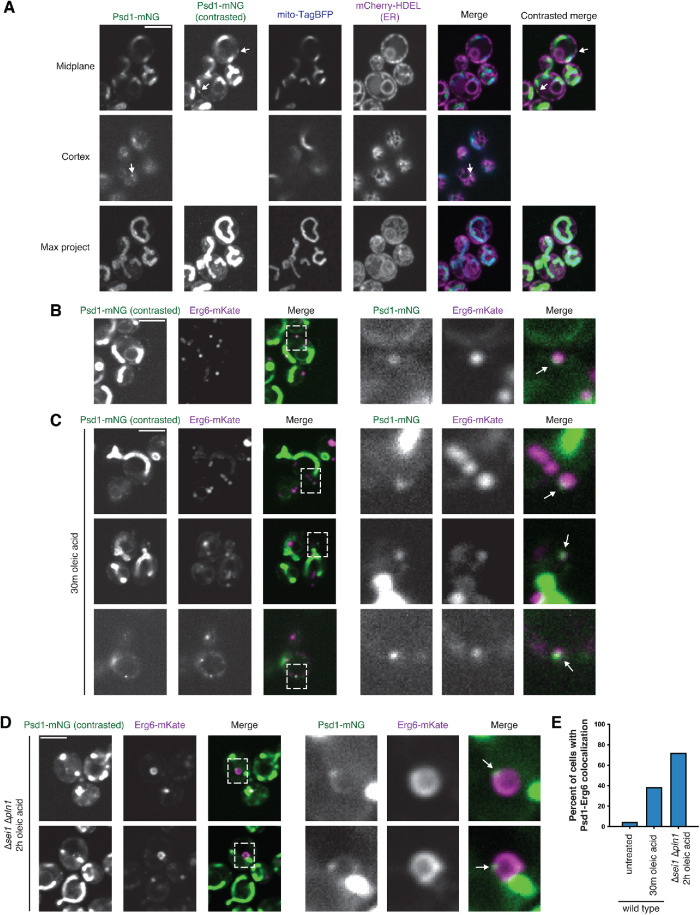
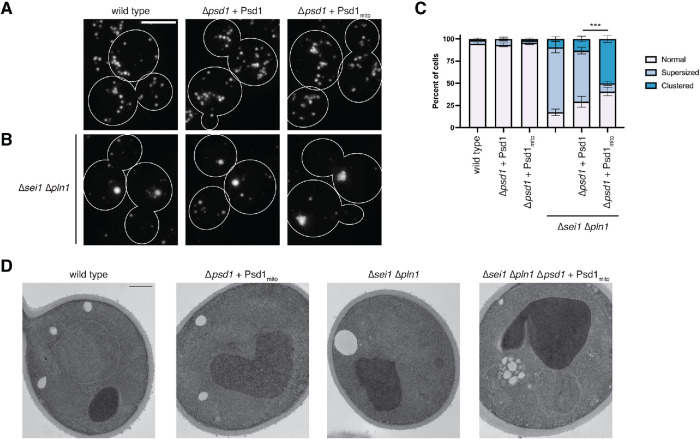
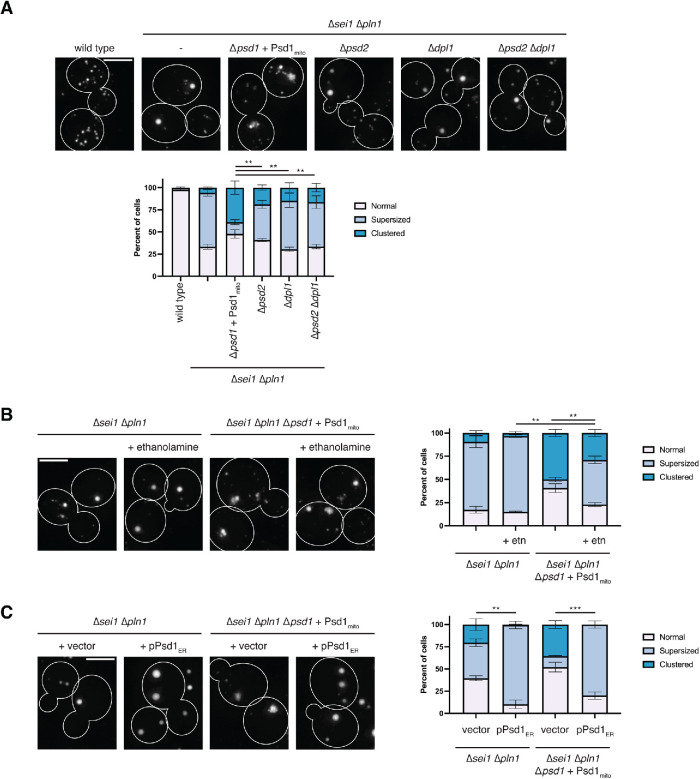
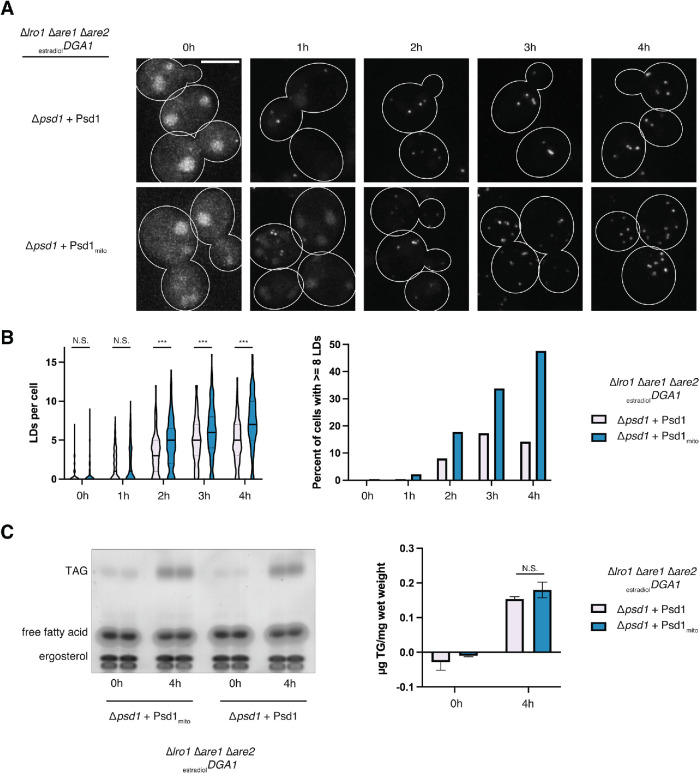
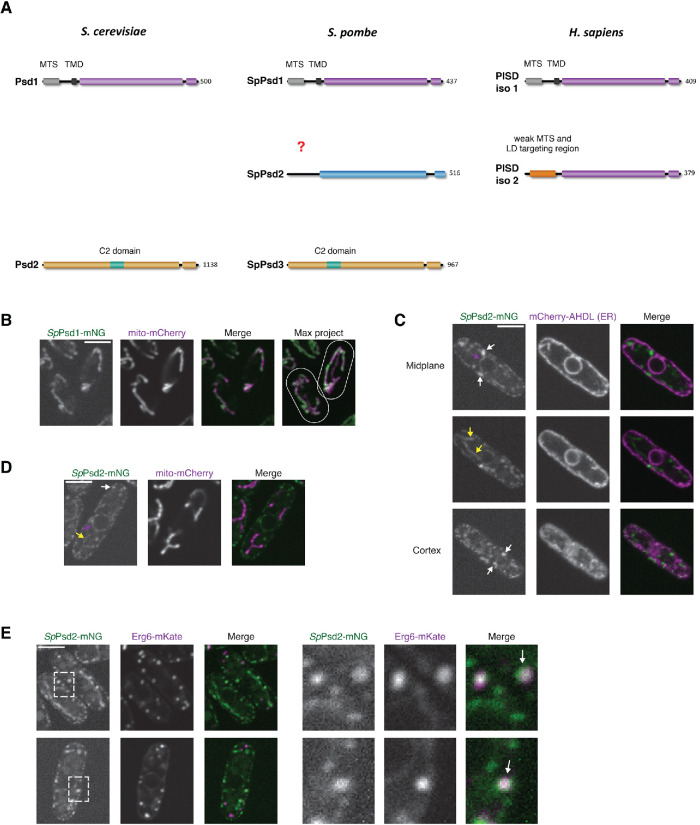
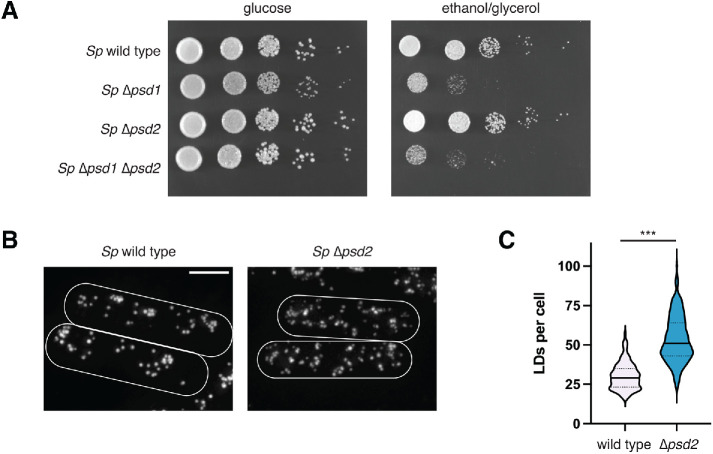
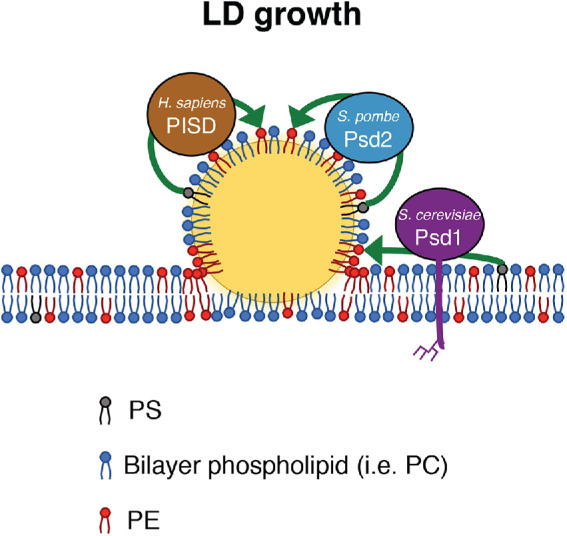
The asymmetric distribution of phospholipids in membranes is a fundamental principle of cellular compartmentalization and organization. Phosphatidylethanolamine (PE), a nonbilayer phospholipid that contributes to organelle shape and function, is synthesized at several subcellular localizations via semiredundant pathways. Previously, we demonstrated in budding yeast that the PE synthase Psd1, which primarily operates on the mitochondrial inner membrane, is additionally targeted to the ER. While ER-localized Psd1 is required to support cellular growth in the absence of redundant pathways, its physiological function is unclear. We now demonstrate that ER-localized Psd1 sublocalizes on the ER to lipid droplet (LD) attachment sites and show it is specifically required for normal LD formation. We also find that the role of phosphatidylserine decarboxylase (PSD) enzymes in LD formation is conserved in other organisms. Thus we have identified PSD enzymes as novel regulators of LDs and demonstrate that both mitochondria and LDs in yeast are organized and shaped by the spatial positioning of a single PE synthesis enzyme.


Figures

FIGURE 1:
FIGURE 1:
Psd1 sublocalizes on the ER to a subset of LDs in budding yeast. (A) Confocal fluorescence microscopy images of wild-type cells grown in SD media and coexpressing Psd1- mNG (green), mito-TagBFP (blue), and mCherry-HDEL (ER; magenta). Single planes are shown of the cell midplane (top) and cortex (middle); maximum intensity projection is shown at the bottom. Arrows mark sites of ER-sublocalized Psd1-mNG puncta. (B) Confocal fluorescence microscopy images are shown of a wild-type cell coexpressing Psd1-mNG (green) and Erg6-mKate (magenta) and grown in SD media. Images on the right are enlarged from the boxed region on the left. An arrow marks the site of Psd1 and Erg6 colocalization. (C) As in B for cells treated for 30 min with 0.2% OA prior to imaging. (D) As in B in ∆sei1pln1 cells treated for 2 h with 0.2% OA prior to imaging. Psd1-mNG images are shown with nonlinear contrast enhancement where indicated to enable visualization of nonmitochondrial signal. (E) A graph of the percentage of cells with examples of Psd1-mNG colocalization with Erg6–mKate-labeled LDs in the indicated strains and growth conditions from cells as in B–D. Data shown represent a total of 150 cells per condition quantified from three independent experiments. Scale bars = 4 µm. See also Figure 1 and Supplemental Figure S1.
FIGURE 2:
FIGURE 2:
PE generated by ER-localized Psd1 is required for normal LD morphology. (A) Maximum intensity projections of deconvolved epifluorescence microscopy images of LDs in cells from the indicated strain backgrounds grown to exponential phase in SD media, treated for 2 h with 0.2% OA, and stained with the neutral lipid dye MDH. ∆psd1 cells express wild-type Psd1 or Psd1mito where indicated, driven by the native promoter and integrated at the ura3 locus. Cells are outlined with solid white lines. Scale bars = 4 µm. (B) As in A in ∆sei1∆pln1 cells. (C) A graph of the categorization of LD morphology from cells from A and B. Data shown are the average of three independent experiments and bars indicate SEM. Asterisks (***p < 0.001) represent unpaired two-tailed t test of supersized LD morphology. See Methods for detailed description of categorization. (D) Representative electron micrographs from the indicated strains grown to exponential phase in SD and treated for 2 h with 0.2% OA prior to fixation. Scale bars = 500 nm.
FIGURE 3:
FIGURE 3:
PE produced by Psd1 is specifically required for the promotion of normal LD morphology. (A) Maximum intensity projections of deconvolved epifluorescence microscopy images of LDs in cells from the indicated strain backgrounds grown to exponential phase in SD media, treated for 2 h with 0.2% OA, and stained with MDH. Graph is the categorization of LD morphology from the indicated strains and is the average of three independent experiments. Asterisks (***p < 0.001; **p < 0.01) represent unpaired two-tailed t test of supersized LD morphology. (B) As in A for the indicated strains supplemented with 10 mM ethanolamine (etn) where indicated. Untreated cells served as controls for multiple experiments and data are redisplayed from Figure 2C. (C) As in A for the indicated strains expressing ectopic Psd1 targeted to the ER (pPsd1ER). Cells are outlined with solid white lines. Scale bars = 4 µm.
FIGURE 4:
FIGURE 4:
ER-localized Psd1 is required for normal LD formation. (A) Maximum intensity projections of deconvolved epifluorescence microscopy images of MDH-stained LDs in cells expressing wild-type Psd1 or Psd1mito where Dga1 expression is controlled by treatment with 0.5 nM estradiol in SD media for the indicated times. Cells are outlined with solid white lines. Scale bars = 4 µm. (B) Graphs of the number of LDs per cell (left) and percentage of cells with eight or more LDs (right) at the indicated times posttreatment with estradiol from the indicated cells as in A. Data shown represent a total of 225 cells per strain per time point quantified from three independent experiments. Solid lines (left) indicate median and dotted lines indicate upper and lower quartiles. (C) Thin layer chromatography analysis of the indicated cells grown as in A and treated for the indicated times with 0.5 nM estradiol. Graph (right) displays the amount of TAG/cell weight averaged from three independent experiments. Asterisks (***p < 0.001) represent unpaired two-tailed t test. N.S. indicates not statistically significant. Bars indicate SEM. See also Figure 4 and Supplemental Figure S1.
FIGURE 5:
FIGURE 5:
LD localization of PSD is conserved between budding and fission yeasts. (A) Schematic depicting conservation of PSD enzymes between S. cerevisiae, S. pombe, and Homo sapiens. (B) Confocal fluorescence microscopy images of wild-type fission yeast cells coexpressing SpPsd1-mNG (green) and mito-mCherry (magenta) and grown in EMM media. Single planes are shown except where indicated. Cells are outlined with white lines. (C–E) As in B for cells expressing SpPsd2-mNG (green) and (C) mCherry-AHDL (ER; magenta), (D) mito-mCherry (magenta), or (E) Erg6-mKate (magenta). Dashed boxes (E) indicate area of enlargement on the right. Magenta arrows mark localization of SpPsd2 to the ER, yellow arrows mark localization of SpPsd2 to mitochondria, and white arrows mark localization of SpPsd2 to LDs. Scale bars = 4 µm.
FIGURE 6:
FIGURE 6:
Loss of SpPsd2 impacts LD morphology in fission yeast. (A) Serial dilutions of the indicated fission yeast cells plated on YES media containing glucose (left) or the nonfermentable carbon source ethanol/glycerol (right). (B) Maximum intensity projections of deconvolved epifluorescence microscopy images of LDs in cells from the indicated strains grown to exponential phase in EMM media, treated for 4 h with 0.2% OA, and stained with MDH. Cells are outlined with solid white lines. Scale bars = 4 µm. (C) Graph of the number of LDs per cell from the indicated strains as in B. Data shown represent a total of at least 260 cells per strain quantified from three independent experiments. Solid lines indicate median and dotted lines indicate upper and lower quartiles. Asterisks (***p < 0.001) represent results of unpaired two-tailed t test.
FIGURE 7:
FIGURE 7:
Model for the role of PSD enzymes at sites of LD formation and growth. In yeast, Psd1 concentrates at discrete positions on the ER membrane during LD biogenesis and expansion. Psd1 and its homolog, Sp Psd2, maintain the appropriate number of LDs during their biogenesis by contributing locally to the production of PE from PS (arrows). Yeast Psd1 is integral to the ER membrane, where it is glycosylated, while Sp Psd2 and human PISD are soluble and may target directly to the LD surface. Our data are consistent with the model that PE produced locally by PSD enzymes helps facilitate, in conjunction with known LD promoting factors such as Sei1, either LD formation and/or later stages of LD maturation, such as fusion. This may occur by the production and concentration of PE locally at the LD neck, a site of negative membrane curvature. PSD enzymes may also contribute to LD growth and LD-LD fusion by producing PE on the LD surface itself. Additionally, by altering the LD surface phospholipid composition, LD behavior may be indirectly affected by impacting protein targeting to the organelle.

Similar articles

Cited by

References

    1. Adeyo O, Horn PJ, Lee S, Binns DD, Chandrahas A, Chapman KD, Goodman JM (2011). The yeast lipin orthologue Pah1p is important for biogenesis of lipid droplets. J Cell Biol 192, 1043–1055. - PMC - PubMed
    1. Arguello-Miranda O, Liu Y, Wood NE, Kositangool P, Doncic A (2018). Integration of multiple metabolic signals determines cell fate prior to commitment. Mol Cell. 71, 733–744.e711. - PubMed
    1. Ben M’barek K, Ajjaji D, Chorlay A, Vanni S, Foret L, Thiam AR (2017). ER Membrane phospholipids and surface tension control cellular lipid droplet formation. Dev Cell 41, 591–604.e597. - PubMed
    1. Birner R, Burgermeister M, Schneiter R, Daum G (2001). Roles of phosphatidylethanolamine and of its several biosynthetic pathways in Saccharomyces cerevisiae. Mol Biol Cell 12, 997–1007. - PMC - PubMed
    1. Caillon L, Nieto V, Gehan P, Omrane M, Rodriguez N, Monticelli L, Thiam AR (2020). Triacylglycerols sequester monotopic membrane proteins to lipid droplets. Nat Commun 11, 3944. - PMC - PubMed

Publication types

MeSH terms