. 2022 Feb 1;33(2):ar13.
doi: 10.1091/mbc.E21-09-0443. Epub 2021 Nov 24.

The ARF GAPs ELMOD1 and ELMOD3 act at the Golgi and cilia to regulate ciliogenesis and ciliary protein traffic

Affiliations

The ARF GAPs ELMOD1 and ELMOD3 act at the Golgi and cilia to regulate ciliogenesis and ciliary protein traffic

Rachel E Turn et al. Mol Biol Cell. .

Erratum in

Abstract

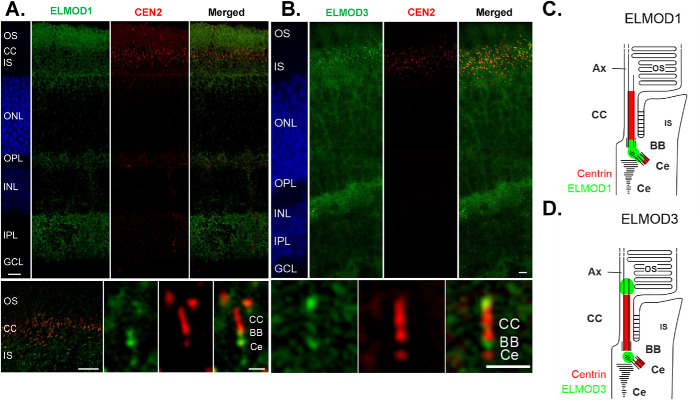
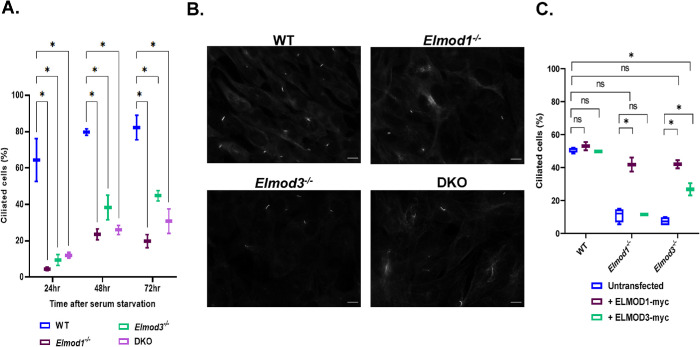
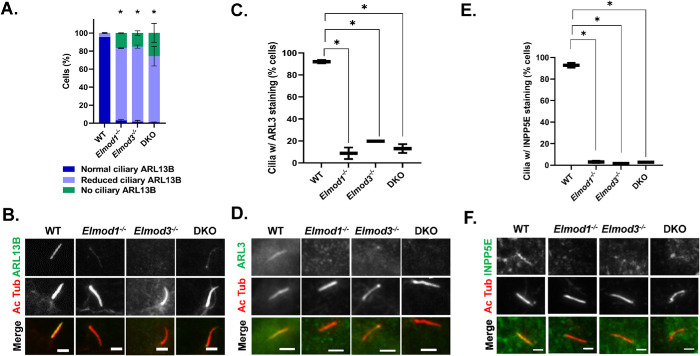
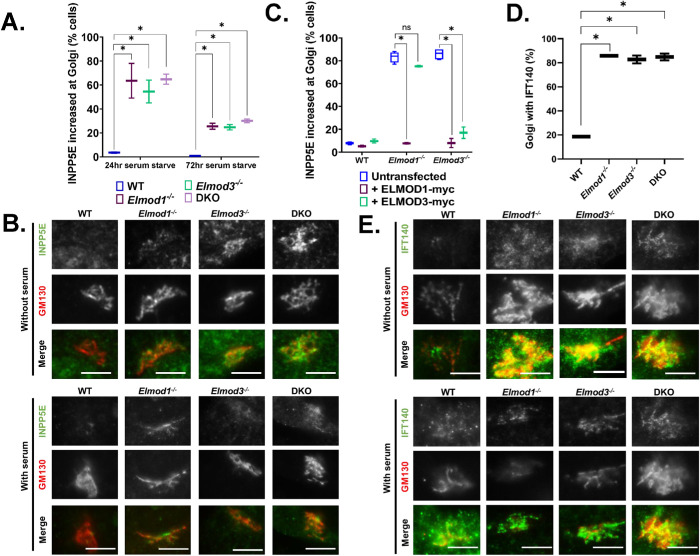
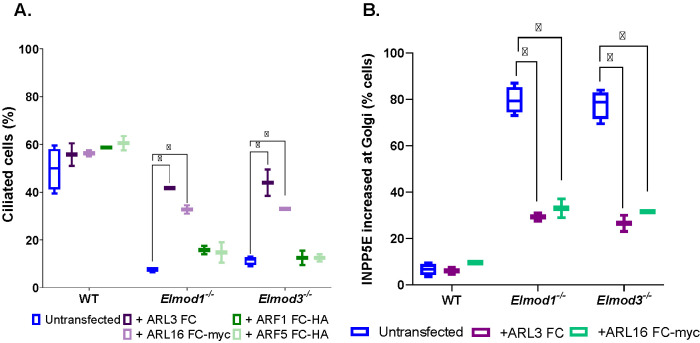
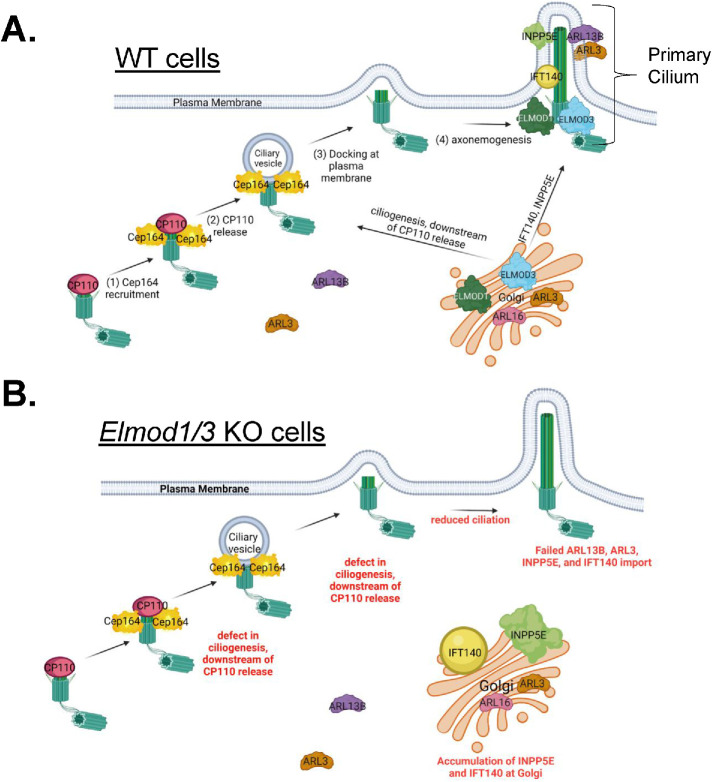
ELMODs are a family of three mammalian paralogues that display GTPase-activating protein (GAP) activity toward a uniquely broad array of ADP-ribosylation factor (ARF) family GTPases that includes ARF-like (ARL) proteins. ELMODs are ubiquitously expressed in mammalian tissues, highly conserved across eukaryotes, and ancient in origin, being present in the last eukaryotic common ancestor. We described functions of ELMOD2 in immortalized mouse embryonic fibroblasts (MEFs) in the regulation of cell division, microtubules, ciliogenesis, and mitochondrial fusion. Here, using similar strategies with the paralogues ELMOD1 and ELMOD3, we identify novel functions and locations of these cell regulators and compare them to those of ELMOD2, allowing the determination of functional redundancy among the family members. We found strong similarities in phenotypes resulting from deletion of either Elmod1 or Elmod3 and marked differences from those arising in Elmod2 deletion lines. Deletion of either Elmod1 or Elmod3 results in the decreased ability of cells to form primary cilia, loss of a subset of proteins from cilia, and accumulation of some ciliary proteins at the Golgi, predicted to result from compromised traffic from the Golgi to cilia. These phenotypes are reversed upon activating mutant expression of either ARL3 or ARL16, linking their roles to ELMOD1/3 actions.


Figures

FIGURE 1:
FIGURE 1:
ELMOD1 and ELMOD3 show overlapping, but also distinctive, localization patterns in mouse retinal photoreceptor cells. Retinas of eGFP-CETN2 mice were processed and analyzed with a deconvolution microscope, as described in Materials and Methods, to determine ELMOD1 and ELMOD3 localization. (A, large top panel) ELMOD1 immunolabeling of cryosections through the retina revealed a prominent staining in a region of the photoreceptor cells comprising the outer segment (OS), the connecting cilium (CC, red, Cen 2), and the inner segment (IS). In addition, fade staining was observed in the outer and inner plexiform layer (OPL, IPL), while other retinal layers, the outer and inner nuclear layer (ONL, INL, blue DAPI staining) and ganglion cell layer (GCL), did not show substantial staining. (Bottom panel) Higher magnification of photoreceptor region (left) and of the ciliary part of a photoreceptor cell (right) revealed ELMOD1 localization at the base of the connecting cilium (CC) in the basal body (BB) and the adjacent daughter centriole (Ce) (both red) as well as within the bridge in between. (B, large top panel) ELMOD3 immunolabeling in a transgenic eGFP-CETN2 mouse retina revealed staining at the region containing photoreceptor cells and both plexiform layers (OPL, IPL) (bottom panel). Higher magnification of the ciliary part of a photoreceptor cell showed that ELMOD3 was restricted to a localization between the BB and Ce at the base of the CC. In addition, ELMOD3 was stained at the base of the outer segment, a compartment above the CC. (C, D) Scheme of ELMOD1 and ELMOD3 photoreceptor cells. Scale = A and B, top panels: 15 µm; bottom panels (higher magnifications), 5 µm.
FIGURE 2:
FIGURE 2:
Elmod1 and/or Elmod3 KO in MEFs cause decreased ciliation. Cloned lines of WT, Elmod1 KO, Elmod3 KO, and DKO MEFs were serum starved for either 24, 48, or 72 h to induce ciliogenesis before staining for Ac Tub (to mark cilia) as described in Materials and Methods. (A) The percentages of cells with cilia were scored (two cell lines per genotype, 100 cells each) at each time point. The experiment was performed in duplicate (N = 2), and results were graphed as box-and-whisker plots. (B) Representative images of WT and KO cells were collected at 60× magnification by wide-field imaging 72 h after serum starvation. Scale bar = 10 µm. (C) Plasmids directing expression of ELMOD1-myc, ELMOD3-myc, or GFP were transiently transfected into WT, Elmod1 KO, or Elmod3 KO lines (two each). One day later, they were serum starved for 24 h and then stained and scored for cilia as in panel A. Only cells with evident protein expression (myc positive) were scored. Experiments were scored in duplicate (N = 2), 100 cells per replicate. Results were graphed as box-and-whisker plots using GraphPad. Statistical significance was assessed via one-way ANOVA, performing multiple comparisons. ns = not significant, *p < 0.05.
FIGURE 3:
FIGURE 3:
Elmod1 or Elmod3 KO causes loss of ARL13B, ARL3, and INPP5E from cilia. Cells (two lines per genotype, from different guides) were grown to ∼80% confluence before inducing ciliation via serum starvation for 72 h and then staining for Ac Tub and either ARL3, ARL13B, or INPP5E. (A) ARL13B levels were binned as normal (readily identifiable before confirming with the Ac Tub channel), reduced (identifiable as ciliary only upon confirmation with Ac Tub staining), or absent (no staining evident that overlaps with Ac Tub). Scoring was performed on 100 cells for each of two cell lines in replicate (N = 2), and error bars represent SEM. (B) Cells treated as in A, stained for Ac Tub and ARL13B, were collected by wide-field microscopy at 100×, and representative images are shown. Note that in these images the Elmod1 KO and DKO cells were scored as reduced, as faint staining is evident, while in the Elmod3 KO cell it is not. (C) Ciliary ARL3 was scored in cells treated as described in panel A. Owing to the weaker overall staining of ARL3, scoring was binned as either present or absent from cilia, identified via Ac Tub staining. Scoring was performed on 100 cells for each of two cell lines in replicate (N = 2), and box-and-whisker plots from the scoring are shown; error bars = minimum and maximum. (D) Representative images from cells stained for ARL3 and Ac Tub are shown. (E) INPP5E and Ac Tub staining was performed as described in Materials and Methods, and scoring of INPP5E presence in cilia was performed as described in panel C, being binned as either present or absent. (F) Representative images from cells stained for Ac Tub and INPP5E are shown. Statistical significance for all data was determined via one-way ANOVA, performing multiple comparisons, using GraphPad Prism Software. *p < 0.05. For all images shown, scale bar = 10 µm.
FIGURE 4:
FIGURE 4:
INPP5E and IFT140 accumulate at the Golgi in Elmod1 or Elmod3 KO lines. Cells were serum starved for 24 or 72 h, followed by staining for GM130 and either INPP5E (A–C) or IFT140 (D–F). (A) The presence of INPP5E colocalizing with GM130 was scored for each genotype, using two different clones of each and scoring 100 cells in duplicate experiments (N = 2). Results were graphed as box-and-whisker plots via GraphPad Prism. *p < 0.05, calculated via one-way ANOVA with multiple comparisons. (B) Representative images of WT and KO cells serum starved for 72 h and stained for GM130 and INPP5E were collected at 100× magnification with wide-field microscopy. Scale bar = 10 µm. (C) WT, Elmod1, and Elmod3 KO cells were transfected with plasmids directing the expression of ELMOD1-myc or ELMOD3-myc. Twenty-four hours later, the cells were serum starved for 24 h before fixing and staining for GM130 and INPP5E. The increased abundance of IFT140 at the Golgi was scored as in panel A and graphed as box-and-whisker plots. *p < 0.05, calculated via one-way ANOVA with multiple comparisons. (D) The presence of IFT140 colocalizing with GM130 was scored for each genotype, using two clones of each KO line and one WT line, scoring 100 cells in duplicate experiments (N = 2). Results were plotted as box-and-whisker plots. *p < 0.05, calculated via one-way ANOVA with multiple comparisons. (E) Images of IFT140 at the Golgi, using GM130 as marker, in each line. Cells were serum starved for 24 h and stained for GM130 and IFT140.
FIGURE 5:
FIGURE 5:
The ciliation defect in Elmod1 or Elmod3 KO cells can be reversed upon transient expression of activated ARL3 or ARL16. (A) WT, Elmod1 KO, and Elmod3 KO lines were transfected with plasmids directing expression of fast-cycling mutants of ARF1-HA, ARF5-HA, ARL3, or ARL16-myc. The next day, cells were serum starved for 24 h and then fixed and stained for Ac Tub and the corresponding tag. (B) The same procedure was carried out as described for panel A, except that only fast-cycling mutants of ARL3 and ARL16 were examined and that staining was for the expressed protein and INPP5E. Only those cells expressing exogenous proteins were scored. Two lines for each genotype were scored, 100 cells each, and the experiment was repeated in duplicate (N = 2). The box-and-whisker plot shows the averages. *p < 0.05, calculated via one-way ANOVA with multiple comparisons.
FIGURE 6:
FIGURE 6:
Model for ELMOD1 and ELMOD3 function as regulators of (A) ciliogenesis and (B) traffic of key ciliary cargoes. We propose that ELMOD1 and ELMOD3 are acting in concert and in at least three processes to regulate ciliogenesis and the traffic of key ciliary cargoes from the Golgi to cilia. With respect to ciliogenesis, we propose that ELMOD1 and ELMOD3 are regulating ciliogenesis from the basal body, after the release of CP110 from distal appendages. ELMOD1 and ELMOD3 are also required for ARL13B in cilia, which in turn aids in the ciliary retention of ARL3. These first two actions may be closely linked in space, though neither ARL13B nor ARL3 is required for ciliogenesis, so we consider them separate at this time. We believe that ELMOD1 and ELMOD3 also act from the Golgi to regulate export of INPP5E and IFT140, though through distinct mechanisms, because export of INPP5E requires PDE6D while export of IFT140 does not. Finally, we speculate that ELMOD1 and ELMOD3 can also act from endosomes, perhaps directly on ARL16, and that in their absence ARL16 is strongly increased on endosomal membranes. Perhaps this would result in its depletion from other sites, including the Golgi, causing delays or defects in the export of specific proteins from the Golgi. Figure was created using BioRender.

Similar articles

Cited by

References

    1. Alkanderi S, Molinari E, Shaheen R, Elmaghloob Y, Stephen LA, Sammut V, Ramsbottom SA, Srivastava S, Cairns G, Edwards N, et al. (2018). ARL3 mutations cause Joubert syndrome by disrupting ciliary protein composition. Am J Hum Genet 103, 612–620. - PMC - PubMed
    1. Andreu-Cervera A, Anselme I, Karam A, Laclef C, Catala M, Schneider-Maunoury S (2019). The ciliopathy gene Ftm/Rpgrip1l controls mouse forebrain patterning via region-specific modulation of Hedgehog/Gli signaling. J Neurosci 39, 2398–2415. - PMC - PubMed
    1. Bernabe-Rubio M, Alonso MA (2017). Routes and machinery of primary cilium biogenesis. Cell Mol Life Sci 74, 4077–4095. - PMC - PubMed
    1. Bielas SL, Silhavy JL, Brancati F, Kisseleva MV, Al-Gazali L, Sztriha L, Bayoumi RA, Zaki MS, Abdel-Aleem A, Rosti RO, et al. (2009). Mutations in INPP5E, encoding inositol polyphosphate-5-phosphatase E, link phosphatidyl inositol signaling to the ciliopathies. Nat Genet 41, 1032–1036. - PMC - PubMed
    1. Cajanek L, Nigg EA (2014). Cep164 triggers ciliogenesis by recruiting Tau tubulin kinase 2 to the mother centriole. Proc Natl Acad Sci USA 111, E2841–E2850. - PMC - PubMed

Publication types

MeSH terms