

Suicide disparities across metropolitan areas in the US: A comparative assessment of socio-environmental factors using a data-driven predictive approach
- PMID: 34818324
- PMCID: PMC8612572
- DOI: 10.1371/journal.pone.0258824
Suicide disparities across metropolitan areas in the US: A comparative assessment of socio-environmental factors using a data-driven predictive approach
Abstract
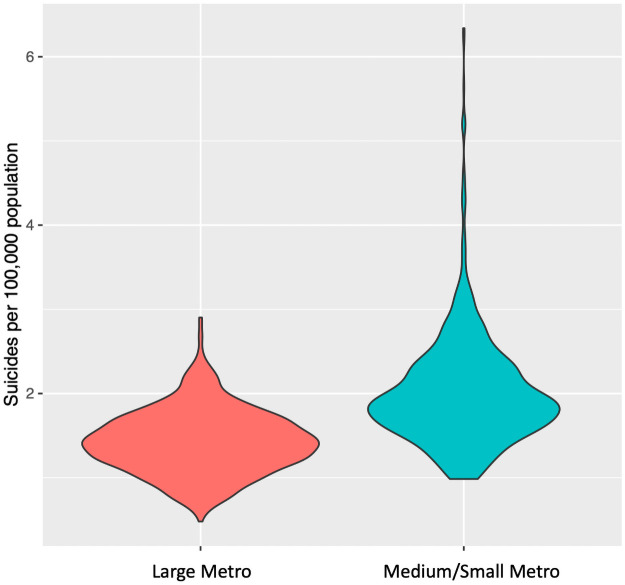
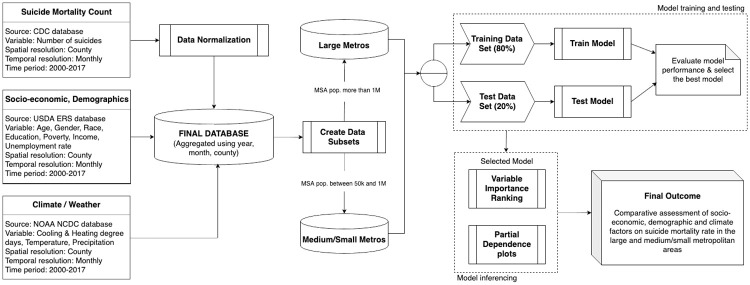
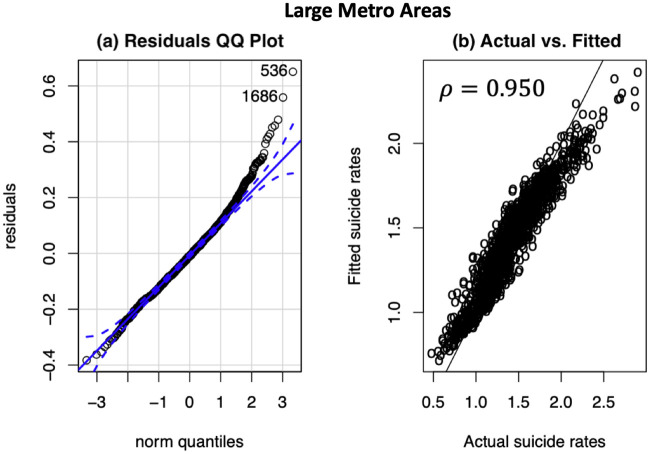
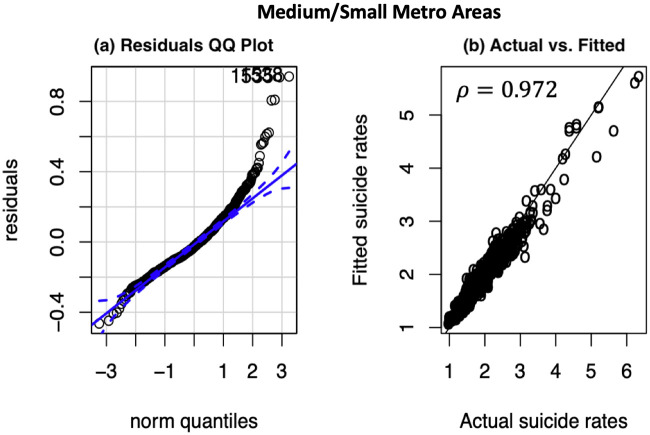
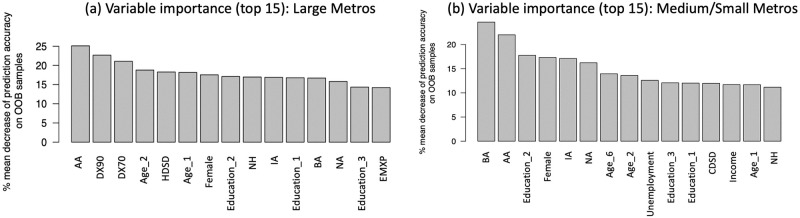
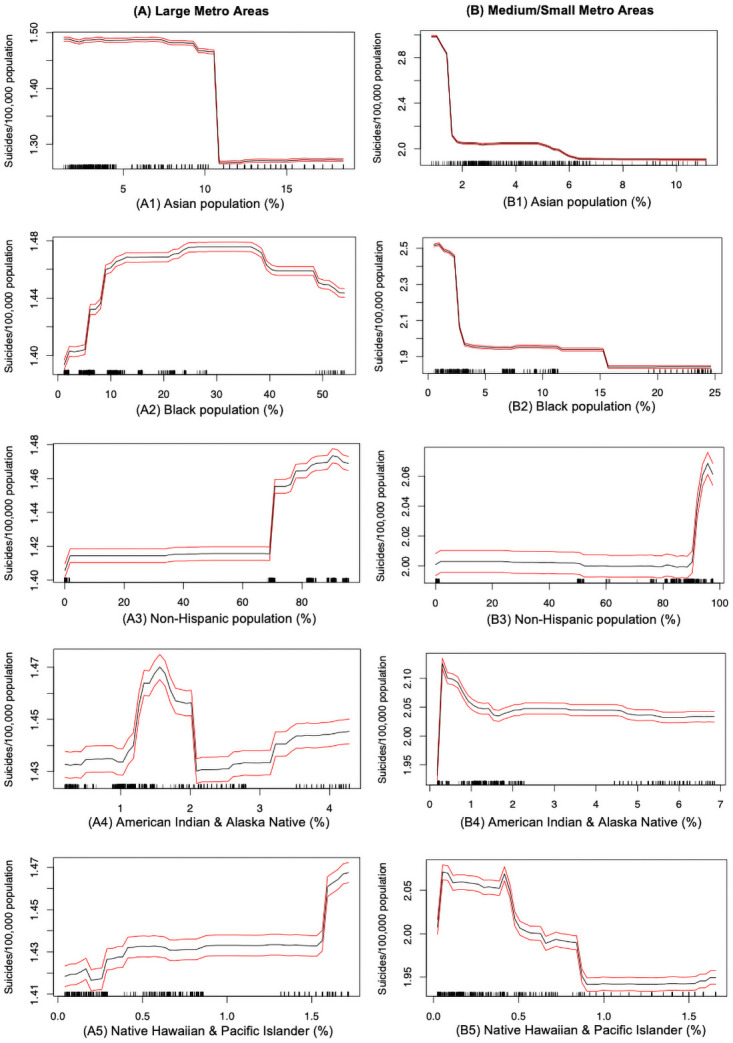
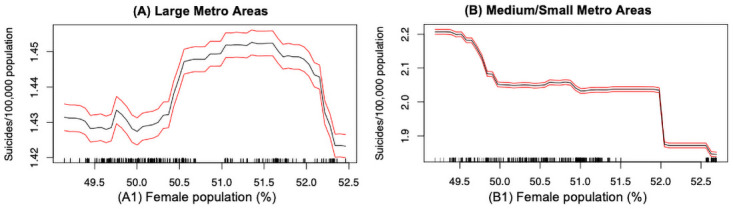
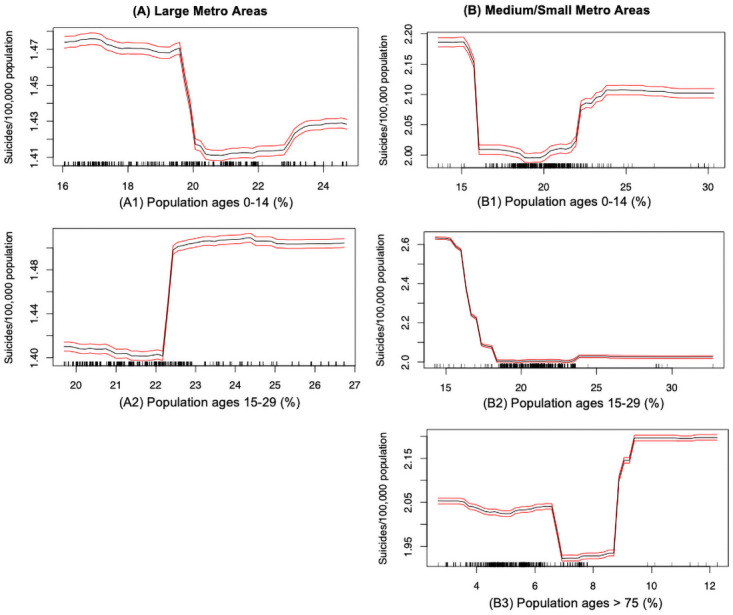
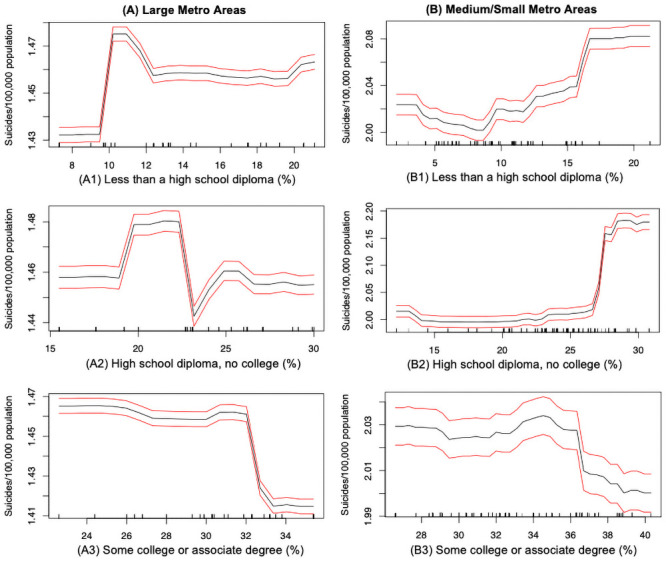
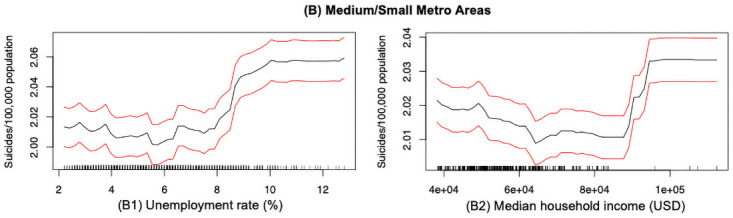
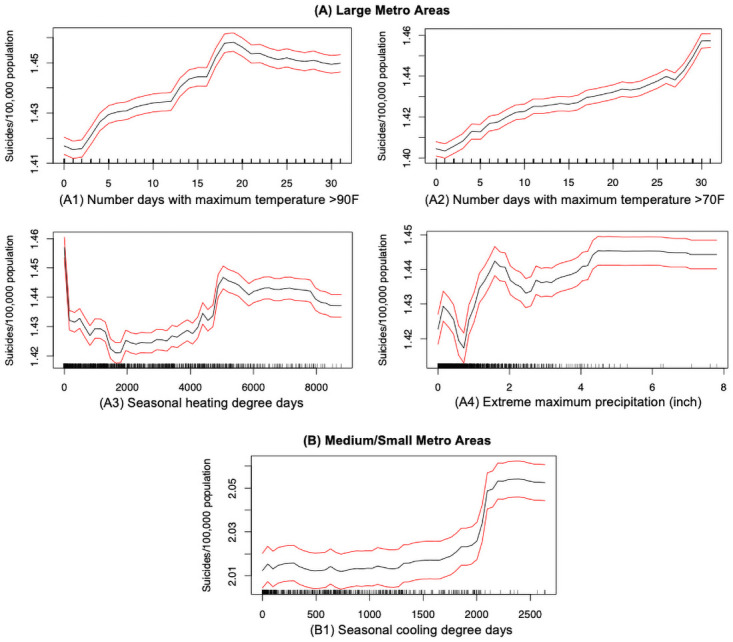
Disparity in suicide rates across various metropolitan areas in the US is growing. Besides personal genomics and pre-existing mental health conditions affecting individual-level suicidal behaviors, contextual factors are also instrumental in determining region-/community-level suicide risk. However, there is a lack of quantitative approach to model the complex associations and interplays of the socio-environmental factors with the regional suicide rates. In this paper, we propose a holistic data-driven framework to model the associations of socio-environmental factors (demographic, socio-economic, and climate) with the suicide rates, and compare the key socio-environmental determinants of suicides across the large and medium/small metros of the vulnerable US states, leveraging a suite of advanced statistical learning algorithms. We found that random forest outperforms all the other models in terms of both in-sample goodness-of-fit and out-of-sample predictive accuracy, which is then used for statistical inferencing. Overall, our findings show that there is a significant difference in the relationships of socio-environmental factors with the suicide rates across the large and medium/small metropolitan areas of the vulnerable US states. Particularly, suicides in medium/small metros are more sensitive to socio-economic and demographic factors, while that in large metros are more sensitive to climatic factors. Our results also indicate that non-Hispanics, native Hawaiian or Pacific islanders, and adolescents aged 15-29 years, residing in the large metropolitan areas, are more vulnerable to suicides compared to those living in the medium/small metropolitan areas. We also observe that higher temperatures are positively associated with higher suicide rates, with large metros being more sensitive to such association compared to that of the medium/small metros. Our proposed data-driven framework underscores the future opportunities of using big data analytics in analyzing the complex associations of socio-environmental factors and inform policy actions accordingly.
Conflict of interest statement
The authors have declared that no competing interests exist.
Figures
Similar articles
-
Health-Behaviors Associated With the Growing Risk of Adolescent Suicide Attempts: A Data-Driven Cross-Sectional Study.Am J Health Promot. 2021 Jun;35(5):688-693. doi: 10.1177/0890117120977378. Epub 2020 Dec 10. Am J Health Promot. 2021. PMID: 33297721
-
Contextual Factors Associated With County-Level Suicide Rates in the United States, 1999 to 2016.JAMA Netw Open. 2019 Sep 4;2(9):e1910936. doi: 10.1001/jamanetworkopen.2019.10936. JAMA Netw Open. 2019. PMID: 31490540 Free PMC article.
-
Socio-environmental drivers and suicide in Australia: Bayesian spatial analysis.BMC Public Health. 2014 Jul 4;14:681. doi: 10.1186/1471-2458-14-681. BMC Public Health. 2014. PMID: 24993370 Free PMC article.
-
Prevention of suicide and attempted suicide in Denmark. Epidemiological studies of suicide and intervention studies in selected risk groups.Dan Med Bull. 2007 Nov;54(4):306-69. Dan Med Bull. 2007. PMID: 18208680 Review.
-
The Minderoo-Monaco Commission on Plastics and Human Health.Ann Glob Health. 2023 Mar 21;89(1):23. doi: 10.5334/aogh.4056. eCollection 2023. Ann Glob Health. 2023. PMID: 36969097 Free PMC article. Review.
Cited by
-
A multilevel scenario based predictive analytics framework to model the community mental health and built environment nexus.Sci Rep. 2021 Sep 2;11(1):17548. doi: 10.1038/s41598-021-96801-x. Sci Rep. 2021. PMID: 34475452 Free PMC article.
-
The land cover paradox: Characteristics of blue- and green spaces within and beyond high-risk suicide clusters.SSM Popul Health. 2025 May 22;31:101820. doi: 10.1016/j.ssmph.2025.101820. eCollection 2025 Sep. SSM Popul Health. 2025. PMID: 40530002 Free PMC article.
-
Socioeconomic deprivation and suicide in Appalachia: The use of three socioeconomic deprivation indices to explain county-level suicide rates.PLoS One. 2024 Nov 18;19(11):e0312373. doi: 10.1371/journal.pone.0312373. eCollection 2024. PLoS One. 2024. PMID: 39556574 Free PMC article.
References
-
- Stone DM, Simon TR, Fowler KA, Kegler SR, Yuan K, Holland KM, et al.. Vital signs: trends in state suicide rates—United States, 1999–2016 and circumstances contributing to suicide—27 states, 2015. Morbidity and Mortality Weekly Report. 2018;67(22):617. doi: 10.15585/mmwr.mm6722a1 - DOI - PMC - PubMed
-
- National Institute of Mental Health (NIMH). Suicide; 2019. Available from: https://www.nimh.nih.gov/health/statistics/suicide.shtml.
-
- Hedegaard H, Curtin SC, Warner M. Suicide mortality in the United States, 1999–2017. NCHS Data Brief. 2018;. - PubMed
Publication types
MeSH terms
LinkOut - more resources
Full Text Sources
Medical
