. 2021 Nov 23;37(8):110055.
doi: 10.1016/j.celrep.2021.110055.

A renal cell carcinoma tumorgraft platform to advance precision medicine

Affiliations

A renal cell carcinoma tumorgraft platform to advance precision medicine

Roy Elias et al. Cell Rep. .

Abstract

Renal cell carcinoma (RCC) encompasses a heterogenous group of tumors, but representative preclinical models are lacking. We previously showed that patient-derived tumorgraft (TG) models recapitulate the biology and treatment responsiveness. Through systematic orthotopic implantation of tumor samples from 926 ethnically diverse individuals into non-obese diabetic (NOD)/severe combined immunodeficiency (SCID) mice, we generate a resource comprising 172 independently derived, stably engrafted TG lines from 148 individuals. TG lines are characterized histologically and genomically (whole-exome [n = 97] and RNA [n = 102] sequencing). The platform features a variety of histological and oncogenotypes, including TCGA clades further corroborated through orthogonal metabolomic analyses. We illustrate how it enables a deeper understanding of RCC biology; enables the development of tissue- and imaging-based molecular probes; and supports advances in drug development.

Keywords: BAP1; HIF; NGS; PET; PT2385; TAK-243; VHL; animal models; belzutifan; biomarkers; iPET; immunoPET; kidney cancer; metabolomics; molecular imaging; radiotracer; patient-derived xenograft (PDX); renal cell carcinoma (RCC).


Conflict of interest statement

Declaration of interests J.B. is an employee/paid consultant for Arrowhead, Calithera, Esai, Exelixis, and Johnson & Johnson and reports receiving commercial research grants from Arrowhead. J.B. and X.S. have a patent application on [(18)F]PT2385. I.P. reports personal fees from Bayer Healthcare and Health Tech International, personal fees for serving in an Advisory Committee for Merck, and others from Philips Healthcare, all outside of the submitted work. R.J.D. is a founder of Atavistik Bio and a member of the Scientific Advisory Boards of Agios Pharmaceuticals, Vida Ventures, and Nirogy Therapeutics.

Figures

Figure 1.
Figure 1.. UTSW KCP TG platform
Tumorgraft (TG) lines derived from primary tumors or metastases were generated through orthotopic implantation of additive-free fragments into the kidney of NOD/SCID mice. As the TGs grew, they were passaged into subsequent cohorts. Stable engraftment was defined as histologically confirmed tumor growth following passage through at least two cohorts of mice (i.e., c0 and c1). Biobanking (formalin fixation and paraffin embedding [FFPE], flash freezing [FF], and DMSO cryopreservation) occurred at the time of initial tumor collection and following explantation of TG lines. This resource has broad applications ranging from exploration of tumor biology to development of novel therapies.
Figure 2.
Figure 2.. Clinical and histological RCC diversity of the TG platform
(A) Overview of the UTSW patients from whom the TG library was generated, including demographics and treatment history (prior to sample acquisition). An entry is included for each TG line, even when from the same individual (172 TG lines corresponding to 148 individuals). aExcludes one individual with unknown ethnicity. bRefers to multiple classes of therapies. cIncludes both immune-checkpoint inhibitors as well as interleukin-2. (B) Overview of tumor source, histological subtype, grade, and sarcomatoid/rhabdoid status (n = 172). dIncludes two TG lines derived from direct invasion into the adrenal gland. eTotals are greater than 172 because of TG lines where multiple grades were noted. (C and D) Comparative patient tumor and TG H&E sections demonstrating feature preservation in ccRCC (C) and nccRCC (D). AI-AN, American Indian/Alaskan Native; ccRCC, clear cell RCC; FhdRCC, FH-deficient RCC; IO, immune-oncology therapies; LN, lymph node; Met, metastasis; mTORi, mTOR inhibitors; pRCC, papillary RCC; Sarc/Rhab, sarcomatoid/rhabdoid; SBRT, stereotactic body radiotherapy; Th, tumor thrombus; TKI, tyrosine kinase inhibitor; tRCC, translocation RCC; Tx, treatment; uRCC, unclassified RCC.
Figure 3.
Figure 3.. Overview of driver mutations
Integrated somatic mutation detection, germline mutation calling, and gene fusion data of 125 TG samples derived from (A) 65 individuals with ccRCC and (B) 19 with nccRCC. Samples originating from the same individual are grouped (Table S5). Percentages were calculated on a per-individual basis. aTMB was calculated as the sum of all putative somatic mutations for samples processed with a paired normal. A TMB value is not provided for tumors without a paired normal sample. bAll paired samples with discordant mutational status were reviewed manually using the integrated genome viewer, and somatic mutations called via this method are annotated with a black dot.
Figure 4.
Figure 4.. Representation of molecularly defined RCC subtypes in the TG platform
2D representation of samples according to log2-normalized gene expression values using the predefined TCGA gene signature after subtracting eTME genes (676 total genes) by UMAP. 131 samples from 102 unique TG lines (squares) and 817 reference samples from the TCGA cohort (circles) are included. chRCC TCGA samples (n = 77) were filtered out. Reference clusters were predefined by previous TCGA allocation and used to map TGs into molecular clusters. atRCC TG lines formed a distinct cluster (gray oval) that also included some uRCCs. A fully interactive version of this figure is also available (Data S1).
Figure 5.
Figure 5.. Highlighted application: Exploring and probing metabolism
(A) Unsupervised heatmap of the top 50 metabolites (false discovery rate [FDR]-corrected p < 0.05, one-way ANOVA) among ccRCC TG lines segregates CC-e.3 from CC-e.1 and CC-e.2 (clusters defined based on nearest neighbor transcriptomic analysis; Figure 4). Each line was processed with up to 2 biological replicates and at least 3 technical replicates for a total of 134 samples. (B) Metabolic pathway map with metabolite quantitation showing increased glycolysis (glucose, lactate, and pyruvate) and cystathionine in the CC-e.3 subgroup relative to CC-e.1 and CC-e.2. Boxplots show relative abundance of metabolites in each cluster (normalized to the total ion count and log2 transformed). Statistical significance was calculated using a mixed model with a compound symmetric covariance structure. *p < 0.05, **p < 0.01, ***p < 0.001. Lower and upper limits of box plot represent 25th and 75th percentile, respectively. Error bars indicate 95% confidence interval.
Figure 6.
Figure 6.. Highlighted Capplication:Precision diagnostics
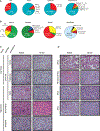
(A) Representative tissue microarray of TG core biopsy samples stained with the PD-L1 antibody by IHC. (B and C) Comparative H&E and PD-L1 IHC of tumors from affected individuals and corresponding TGs implanted subcutaneously into mice (white circle) with high (XP955) and low (XP813) PD-L1 expression with (C) representative 89Zr-ATZ PET images. (D)89Zr-ATZ PET/CT coronal images of an individual with metastatic ccRCC enrolled in the 89Zr-ATZ PET trial (NCT04006522) with accompanying pre- and post-ipilimumab/nivolumab (3 cycles) CT images showing early response of PD-L1-positive liver metastases (white lines and arrows) compared with PD-L1-negative primary tumor (yellow arrows) with minimal uptake (green arrow).
Figure 7.
Figure 7.. Highlighted application: Precision therapy
(A) Rationale for targeting UAE in BAP1-deficient RCC. TAK-243 inhibits the ubiquitin-activating enzyme (UAE), which initiates the ubiquitination cascade. Downstream effects include histone H2AK119 ubiquitination, which is mediated by polycomb repressive complex 1 (PRC1) and leads to target gene silencing. BAP1, a histone deubiquitinase, acts on H2AK119ub. (B) TAK-243 PK studies. 25 mg/kg of TAK-243 was administered i.v. into subcutaneous TG-bearing NOD/SCID mice (XP373). TAK-243 concentrations in plasma, kidneys, and TG were determined by sacrificing mice at 15 min (n = 3), 24 h (n = 3), 48 h (n = 3), and 72 h (n = 3). Data are mean ± SD. (C) Western blot analysis of TG from mice treated with TAK-243 or vehicle 48 h after injection. H2AUb (Lys119) and H2BUb (Lys120) immunoblots were performed on explanted tumors. aBAP1 loss in XP258 determined by IHC (Peña-Llopis et al., 2012). (D) Tumor volumes from a BAP1-negative TG line (XP258) treated (starting at day 0) with TAK-243 (25 mg/kg i.v. every 72 h) (n = 3), vehicle (n = 3), or rapamycin (0.5 mg/kg intraperitoneally every 48 h) (n = 3). Data are means ± SD.

References

    1. Bakouny Z, Braun DA, Shukla SA, Pan W, Gao X, Hou Y, Flaifel A, Tang S, Bosma-Moody A, He MX, et al. (2021). Integrative molecular characterization of sarcomatoid and rhabdoid renal cell carcinoma. Nat. Commun. 12, 808. - PMC - PubMed
    1. Ben-David U, Ha G, Tseng Y-Y, Greenwald NF, Oh C, Shih J, McFarland JM, Wong B, Boehm JS, Beroukhim R, and Golub TR (2017). Patient-derived xenografts undergo mouse-specific tumor evolution. Nat. Genet. 49, 1567–1575. - PMC - PubMed
    1. Bi M, Zhao S, Said JW, Merino MJ, Adeniran AJ, Xie Z, Nawaf CB, Choi J, Belldegrun AS, Pantuck AJ, et al. (2016). Genomic characterization of sarcomatoid transformation in clear cell renal cell carcinoma. Proc. Natl. Acad. Sci. USA 113, 2170–2175. - PMC - PubMed
    1. Borodovsky A, McQuiston TJ, Stetson D, Ahmed A, Whitston D, Zhang J, Grondine M, Lawson D, Challberg SS, Zinda M, et al. (2017). Generation of stable PDX derived cell lines using conditional reprogramming. Mol. Cancer 16, 177. - PMC - PubMed
    1. Brannon AR, Reddy A, Seiler M, Arreola A, Moore DT, Pruthi RS, Wallen EM, Nielsen ME, Liu H, Nathanson KL, et al. (2010). Molecular Stratification of Clear Cell Renal Cell Carcinoma by Consensus Clustering Reveals Distinct Subtypes and Survival Patterns. Genes Cancer 1, 152–163. - PMC - PubMed

Publication types

LinkOut - more resources