. 2021 Nov 23;37(8):110057.
doi: 10.1016/j.celrep.2021.110057.

Interspecies variation in hominid gut microbiota controls host gene regulation

Affiliations

Interspecies variation in hominid gut microbiota controls host gene regulation

Amanda L Muehlbauer et al. Cell Rep. .

Abstract

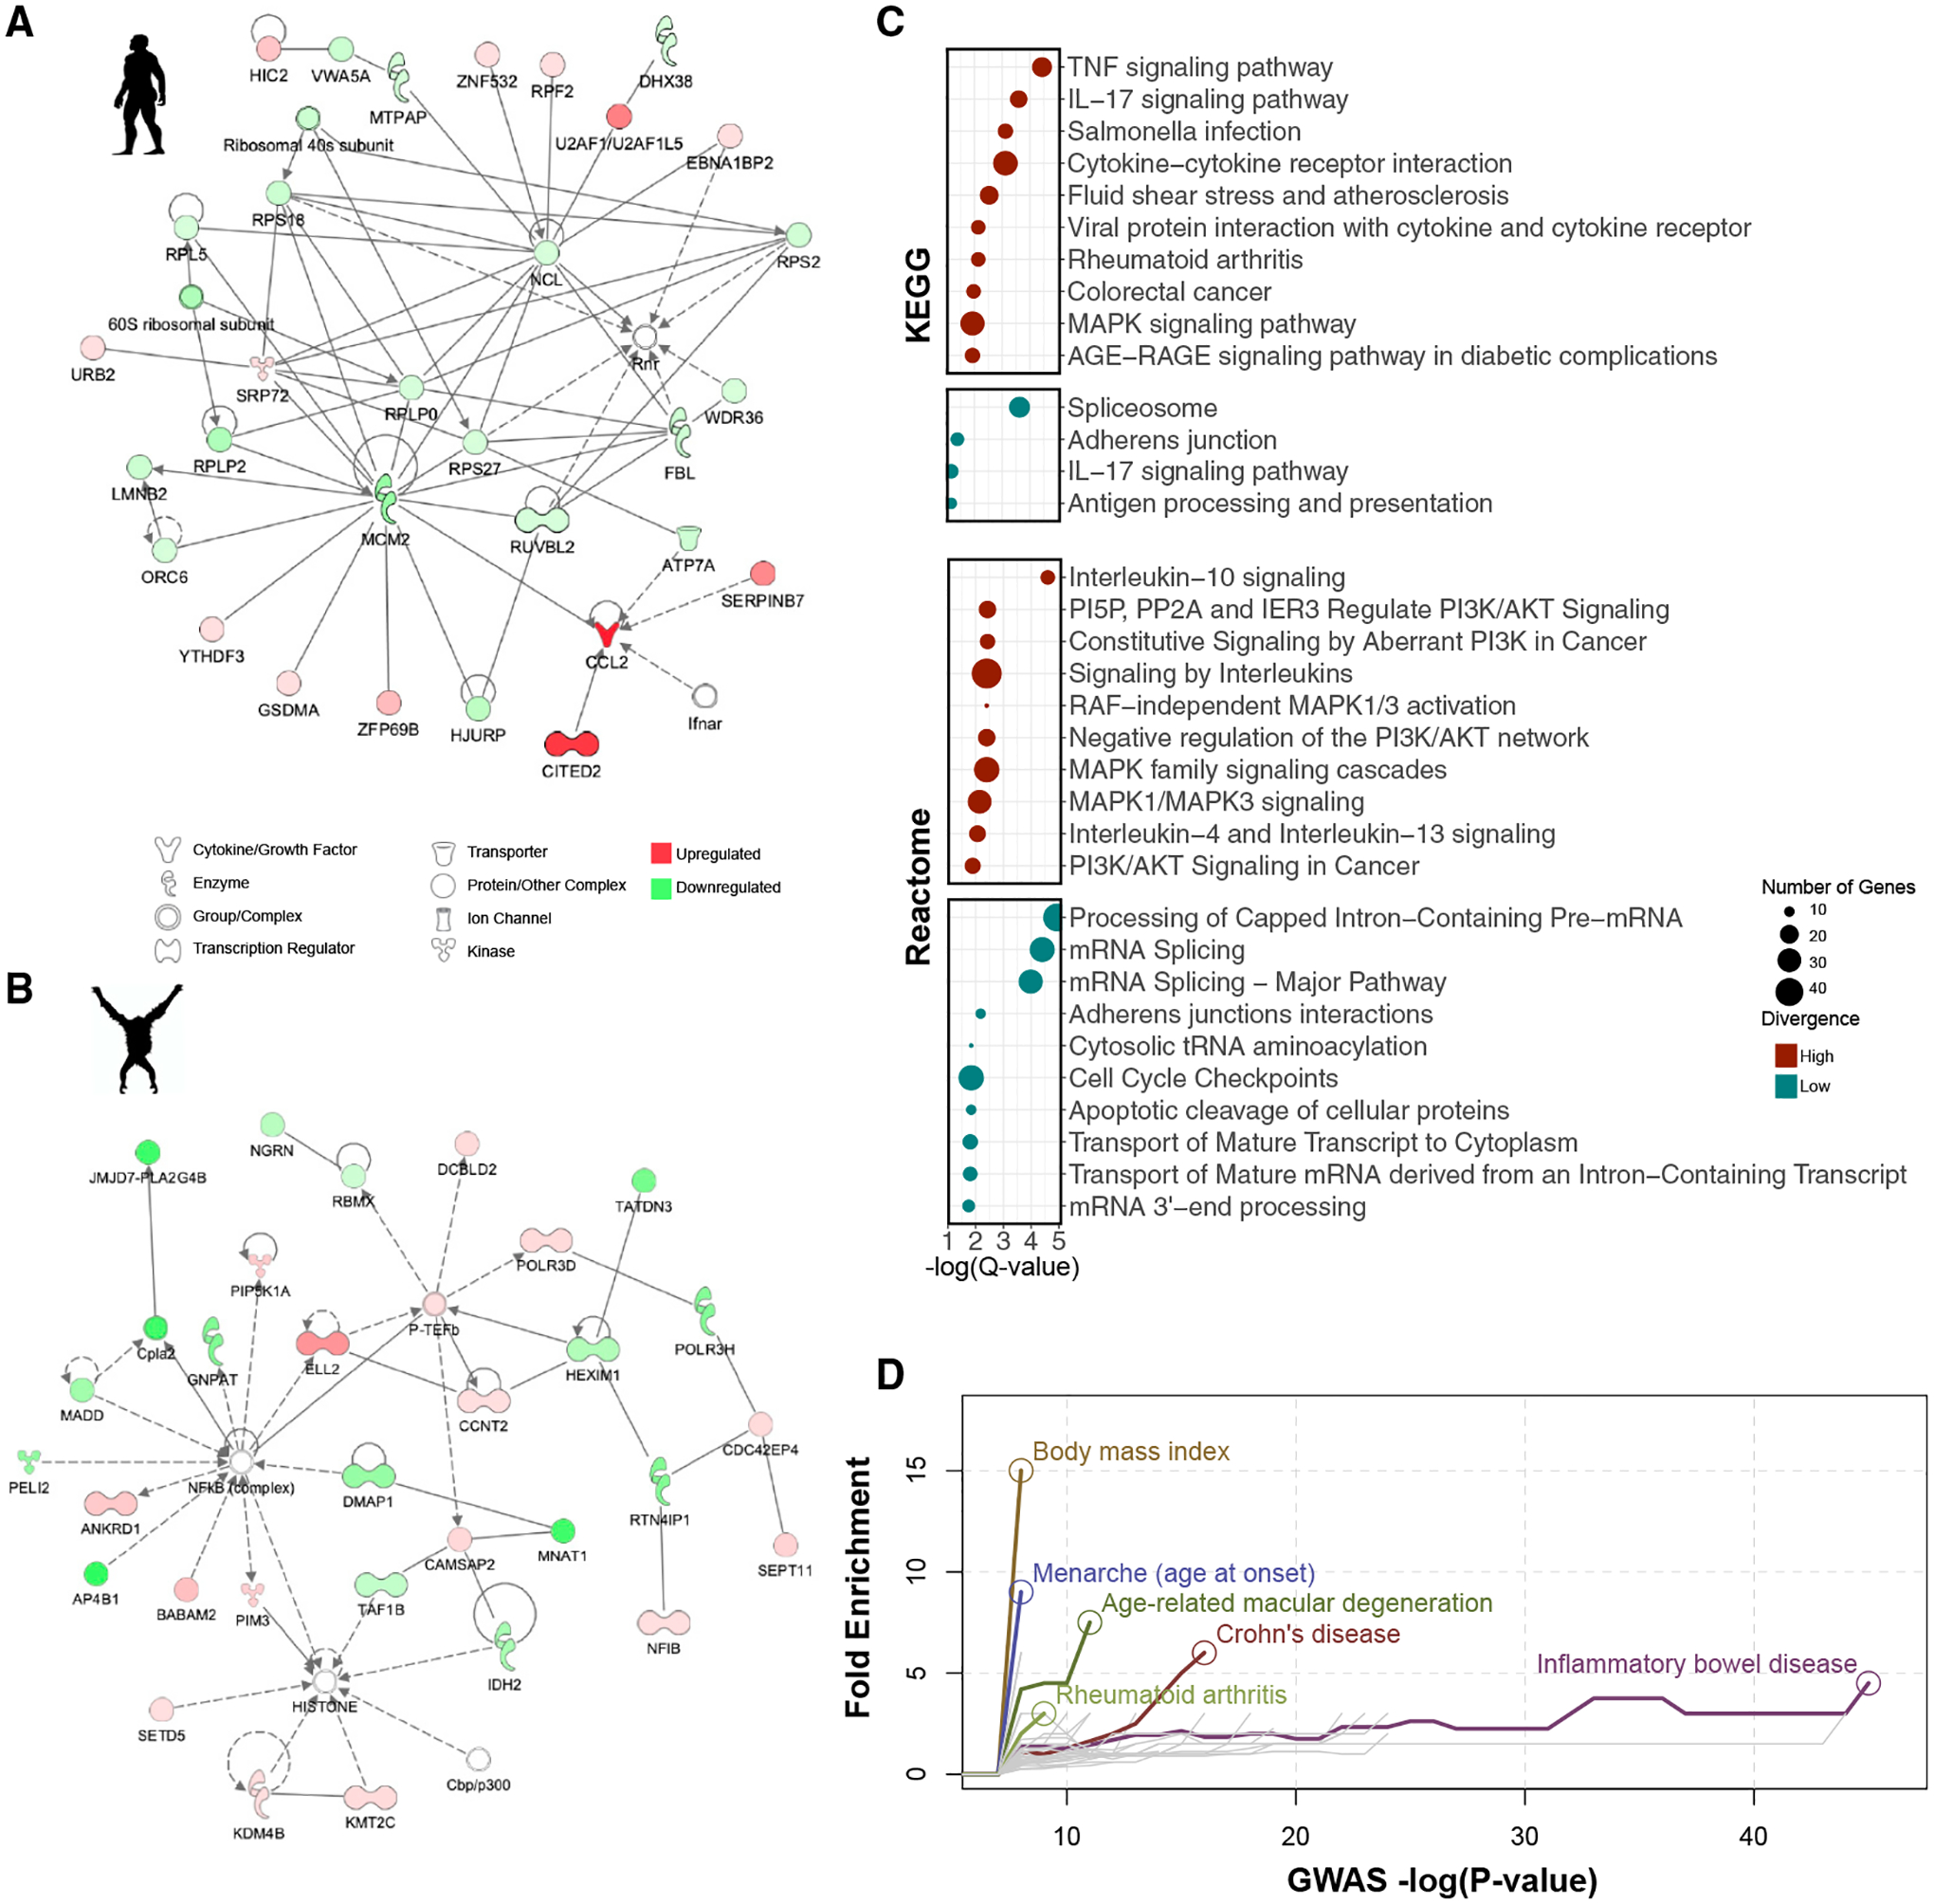
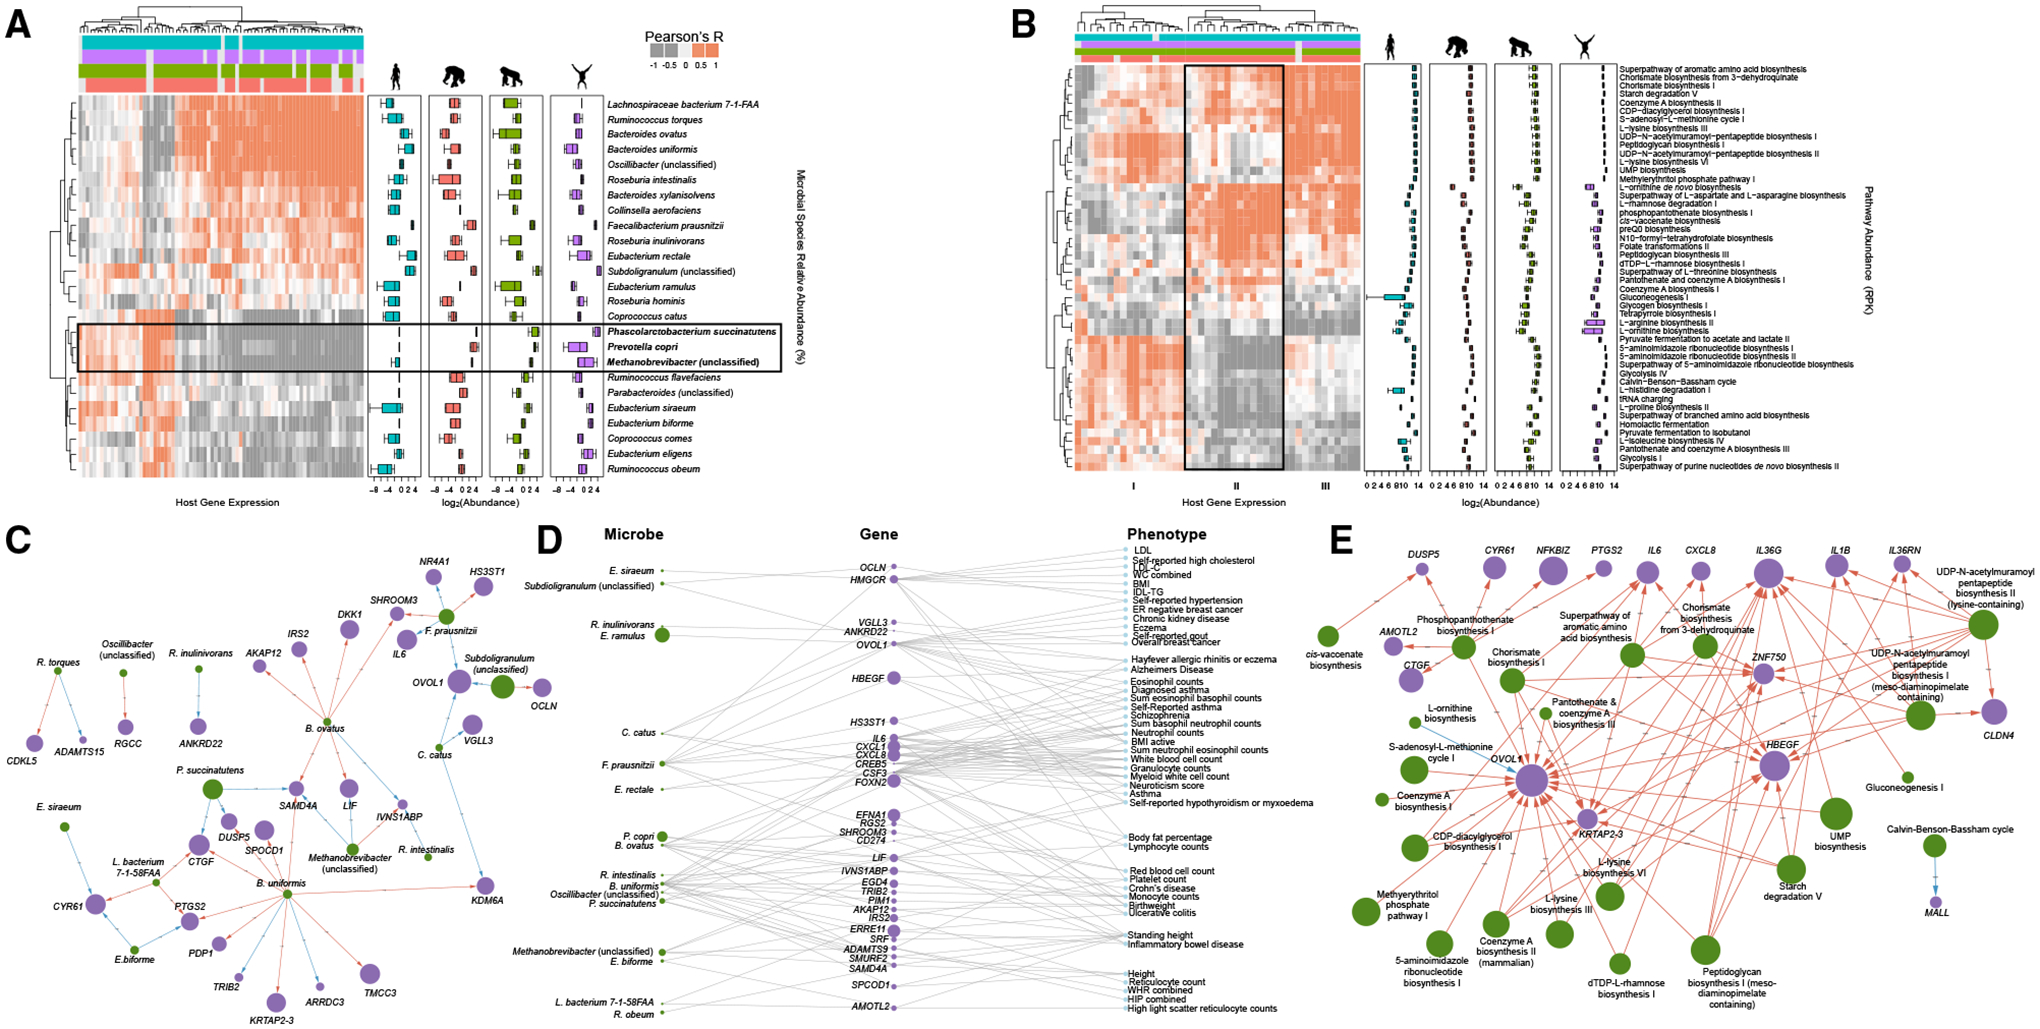
The gut microbiome exhibits extreme compositional variation between hominid hosts. However, it is unclear how this variation impacts host physiology across species and whether this effect can be mediated through microbial regulation of host gene expression in interacting epithelial cells. Here, we characterize the transcriptional response of human colonic epithelial cells in vitro to live microbial communities extracted from humans, chimpanzees, gorillas, and orangutans. We find that most host genes exhibit a conserved response, whereby they respond similarly to the four hominid microbiomes. However, hundreds of host genes exhibit a divergent response, whereby they respond only to microbiomes from specific host species. Such genes are associated with intestinal diseases in humans, including inflammatory bowel disease and Crohn's disease. Last, we find that inflammation-associated microbial species regulate the expression of host genes previously associated with inflammatory bowel disease, suggesting health-related consequences for species-specific host-microbiome interactions across hominids.

Keywords: Gut microbiome, Primates, Hominids, Gene regulation.


Conflict of interest statement

Declaration of interests The authors declare no competing interests.

Figures

Figure 1.
Figure 1.. Experimental design and gut microbiome composition
(A) Schematic of the experimental design. Live microbiomes were extracted from fecal samples from humans (n = 4, blue) chimpanzees (n = 4, orange), gorillas (n = 7, green), and orangutans (n = 4; purple), and were sequenced with metagenomic shotgun sequencing. Microbes were incubated with human colonic epithelial cells for 2 h, after which host response was profiled through RNA-seq on the epithelial cells, and the microbiome was profiled via 16S rRNA sequencing. See also Table S1. (B) PCOA plot showing the Bray-Curtis dissimilarity of all the microbiome samples from all four primate species (represented by the same colors in A) at different stages of the experiment. Here, “Raw” refers to the microbiomes of raw fecal samples; “Prepared” refers to microbiome samples that have been prepared (see STAR Methods) but have not been cultured with colonocytes; “Colonocytes” refers to microbiomes after incubation with colonocytes; “Control” refers to microbiomes that have been incubated without colonocytes. See also Figure S1A. (C) Relative abundances of microbial phyla from shotgun metagenomic sequencing for each hominid fecal sample, sequenced before being cultured with colonocytes. The legend on the right indicates the colors corresponding to each phylum. See also Figures S1B and S1C. (D) Examples of microbial species (from shotgun metagenomics sequencing) with various patterns of abundance across hominid species. In each panel, the x axis indicates the primate host species, whereas the y axis indicates the relative abundance of the microbial species. Each dot represents the abundance of the microbial species in a hominid individual host. Bacteroides ovatus (top left) shows a high abundance in humans relative to the other hominid species. Phascolarctobacterium succinatutens is highly abundant in the non-human hominids but not present in the human microbiomes. Faecalibacterium prausnitzii is highly abundant in all four hominid species. Prevotella copri is highly abundant in chimpanzees and gorillas, has a lower abundance in orangutans, and is not present in the human samples. See also Figure S1C and Table S2.
Figure 2.
Figure 2.. Patterns of host gene expression change in response to hominid microbiome treatment
(A) Heatmap showing the log2 fold change for all differentially expressed host genes (rows), grouped by expression pattern. Each row in the heatmap represents a host gene and each column represents one of the four hominid species. The colored bar on the right hand side indicates the hominid microbiome to which these genes respond (Benjamini-Hochberg FDR < 0.1). See also Table S13. (B) UpSet plot visualizing the intersections among the sets of host genes that respond to hominid microbiomes. The x axis indicates the hominid species (or combination of hominid species) considered in the intersection and is represented by colored dots underneath the x axis (each color depicts a hominid species as in Figure 1). The y axis indicates the number of genes in the intersection. The bars in the lower left indicate the total number of differentially expressed genes by hominid species. For example, the leftmost bar shows that 2,261 genes are differentially expressed in response to microbiomes from all four hominid species, and the rightmost bar shows that 12 genes are differentially expressed in response to only orangutan microbiomes. See also Table S3. (C) Examples of expression patterns of eight differentially expressed genes. Each panel represents a single host gene, labeled at the top of the plot. The x axis represents the four hominid species, and the y axis represents the log2 fold change in expression of the gene. Each dot represents the log2 fold change in response to the microbiomes of each hominid, with error bars indicating the SE. The gray dotted line is at zero and denotes no differential expression. See also Tables S3 and S13.
Figure 3.
Figure 3.. Interaction networks and functional enrichment categories for host genes responding to hominid gut microbiomes
(A) Interaction network showing host genes that respond only to human microbiomes, generated using Ingenuity Pathway Analysis. Each node indicates a gene, and the color of the node indicates whether the gene is upregulated (red) or downregulated (green). The shape of each node represents a specific function as depicted in the legend. A line indicates a direct interaction, and a dashed line indicates an indirect interaction. See also Figure S2. (B) Similar to (A), but with host genes that respond only to orangutan microbiomes. (C) Functional categories in the KEGG (top) and Reactome (bottom) databases enriched among high-divergence genes (red) and low-divergence genes (blue). The x axis indicates the statistical significance of enrichment, and the circle size corresponds to the number of genes in each category, as shown in the legend (Benjamini-Hochberg FDR < 0.1). See also Figure S3 and Table S6. (D) Complex disease enriched among genes that respond to hominid microbiomes. Fold enrichment (y axis) is shown for a given p value threshold (x axis) to define genes that are associated with each complex disease in the GWAS catalog. Each colored line represents a complex disease with a statistically significant enrichment after multiple test correction (using Fisher’s exact test, FDR < 0.1; see STAR Methods), with a circle indicating the most significant p value threshold. Diseases that did not reach significance are shown in gray lines.
Figure 4.
Figure 4.. Relationship between host gene expression and specific microbiome features
(A) Heatmap showing correlations between abundance of microbial species from metagenomics sequencing data (rows) and host gene expression response (columns) (Benjamini-Hochberg FDR < 0.05). The colored bars at the top indicate to which hominid microbiome (or combination of hominid microbiomes) a gene responds, with blue, orange, green, and purple bars depicting the human, chimpanzee, gorilla, and orangutan microbiomes, respectively. Boxplots to the right show the abundance of each microbial species in each hominid microbiome (microbial abundance transformed by log2) using the same color scheme. See also Figure S4 and Table S7. (B) Similar to (A), but showing the abundance of microbial pathways instead of microbial species (Benjamini-Hochberg FDR < 0.05). See also Figure S4 and Table S9. (C) Network visualization of high-divergence host genes (purple nodes) and microbial species (green nodes) to which these host genes respond (shown as arrows). The node size of microbial species corresponds to abundance, and the node size of host genes corresponds to log2 fold change of the differential expression in response to microbiome exposure. Arrow colors indicate whether a microbial species increases (blue) or decreases (red) the expression of the connected host gene. See also Table S8. (D) Three-tier network showing microbial species (left column), the host genes they each regulate (middle column), and the TWAS phenotypes these genes are associated with (right column). Microbial species and host gene node size indicate microbial abundance and differential expression, respectively, correlated with high-divergence genes and TWAS phenotypes. See also Table S11. (E) Similar to (C), but showing microbial pathways instead of microbial species. See also Table S10.

References

    1. Amato KR, Sanders JG, Song SJ, Nute M, Metcalf JL, Thompson LR, Morton JT, Amir A, McKenzie VJ, Humphrey G, et al. (2019a). Evolutionary trends in host physiology outweigh dietary niche in structuring primate gut microbiomes. ISME J. 13, 576–587. - PMC - PubMed
    1. Amato KR, Mallott EK, McDonald D, Dominy NJ, Goldberg T, Lambert JE, Swedell L, Metcalf JL, Gomez A, Britton GAO, et al. (2019b). Convergence of human and Old World monkey gut microbiomes demonstrates the importance of human ecology over phylogeny. Genome Biol. 20, 201. - PMC - PubMed
    1. Blekhman R, Oshlack A, Chabot AE, Smyth GK, and Gilad Y (2008). Gene regulation in primates evolves under tissue-specific selection pressures. PLoS Genet. 4, e1000271. - PMC - PubMed
    1. Blekhman R, Goodrich JK, Huang K, Sun Q, Bukowski R, Bell JT, Spector TD, Keinan A, Ley RE, Gevers D, and Clark AG (2015). Host genetic variation impacts microbiome composition across human body sites. Genome Biol. 16, 191. - PMC - PubMed
    1. Bolger AM, Lohse M, and Usadel B (2014). Trimmomatic: a flexible trimmer for Illumina sequence data. Bioinformatics 30, 2114–2120. - PMC - PubMed

Publication types

Substances

LinkOut - more resources