. 2022 Feb;602(7896):294-299.
doi: 10.1038/s41586-021-04245-0. Epub 2021 Nov 24.

The N501Y spike substitution enhances SARS-CoV-2 infection and transmission

Affiliations

The N501Y spike substitution enhances SARS-CoV-2 infection and transmission

Yang Liu et al. Nature. 2022 Feb.

Abstract

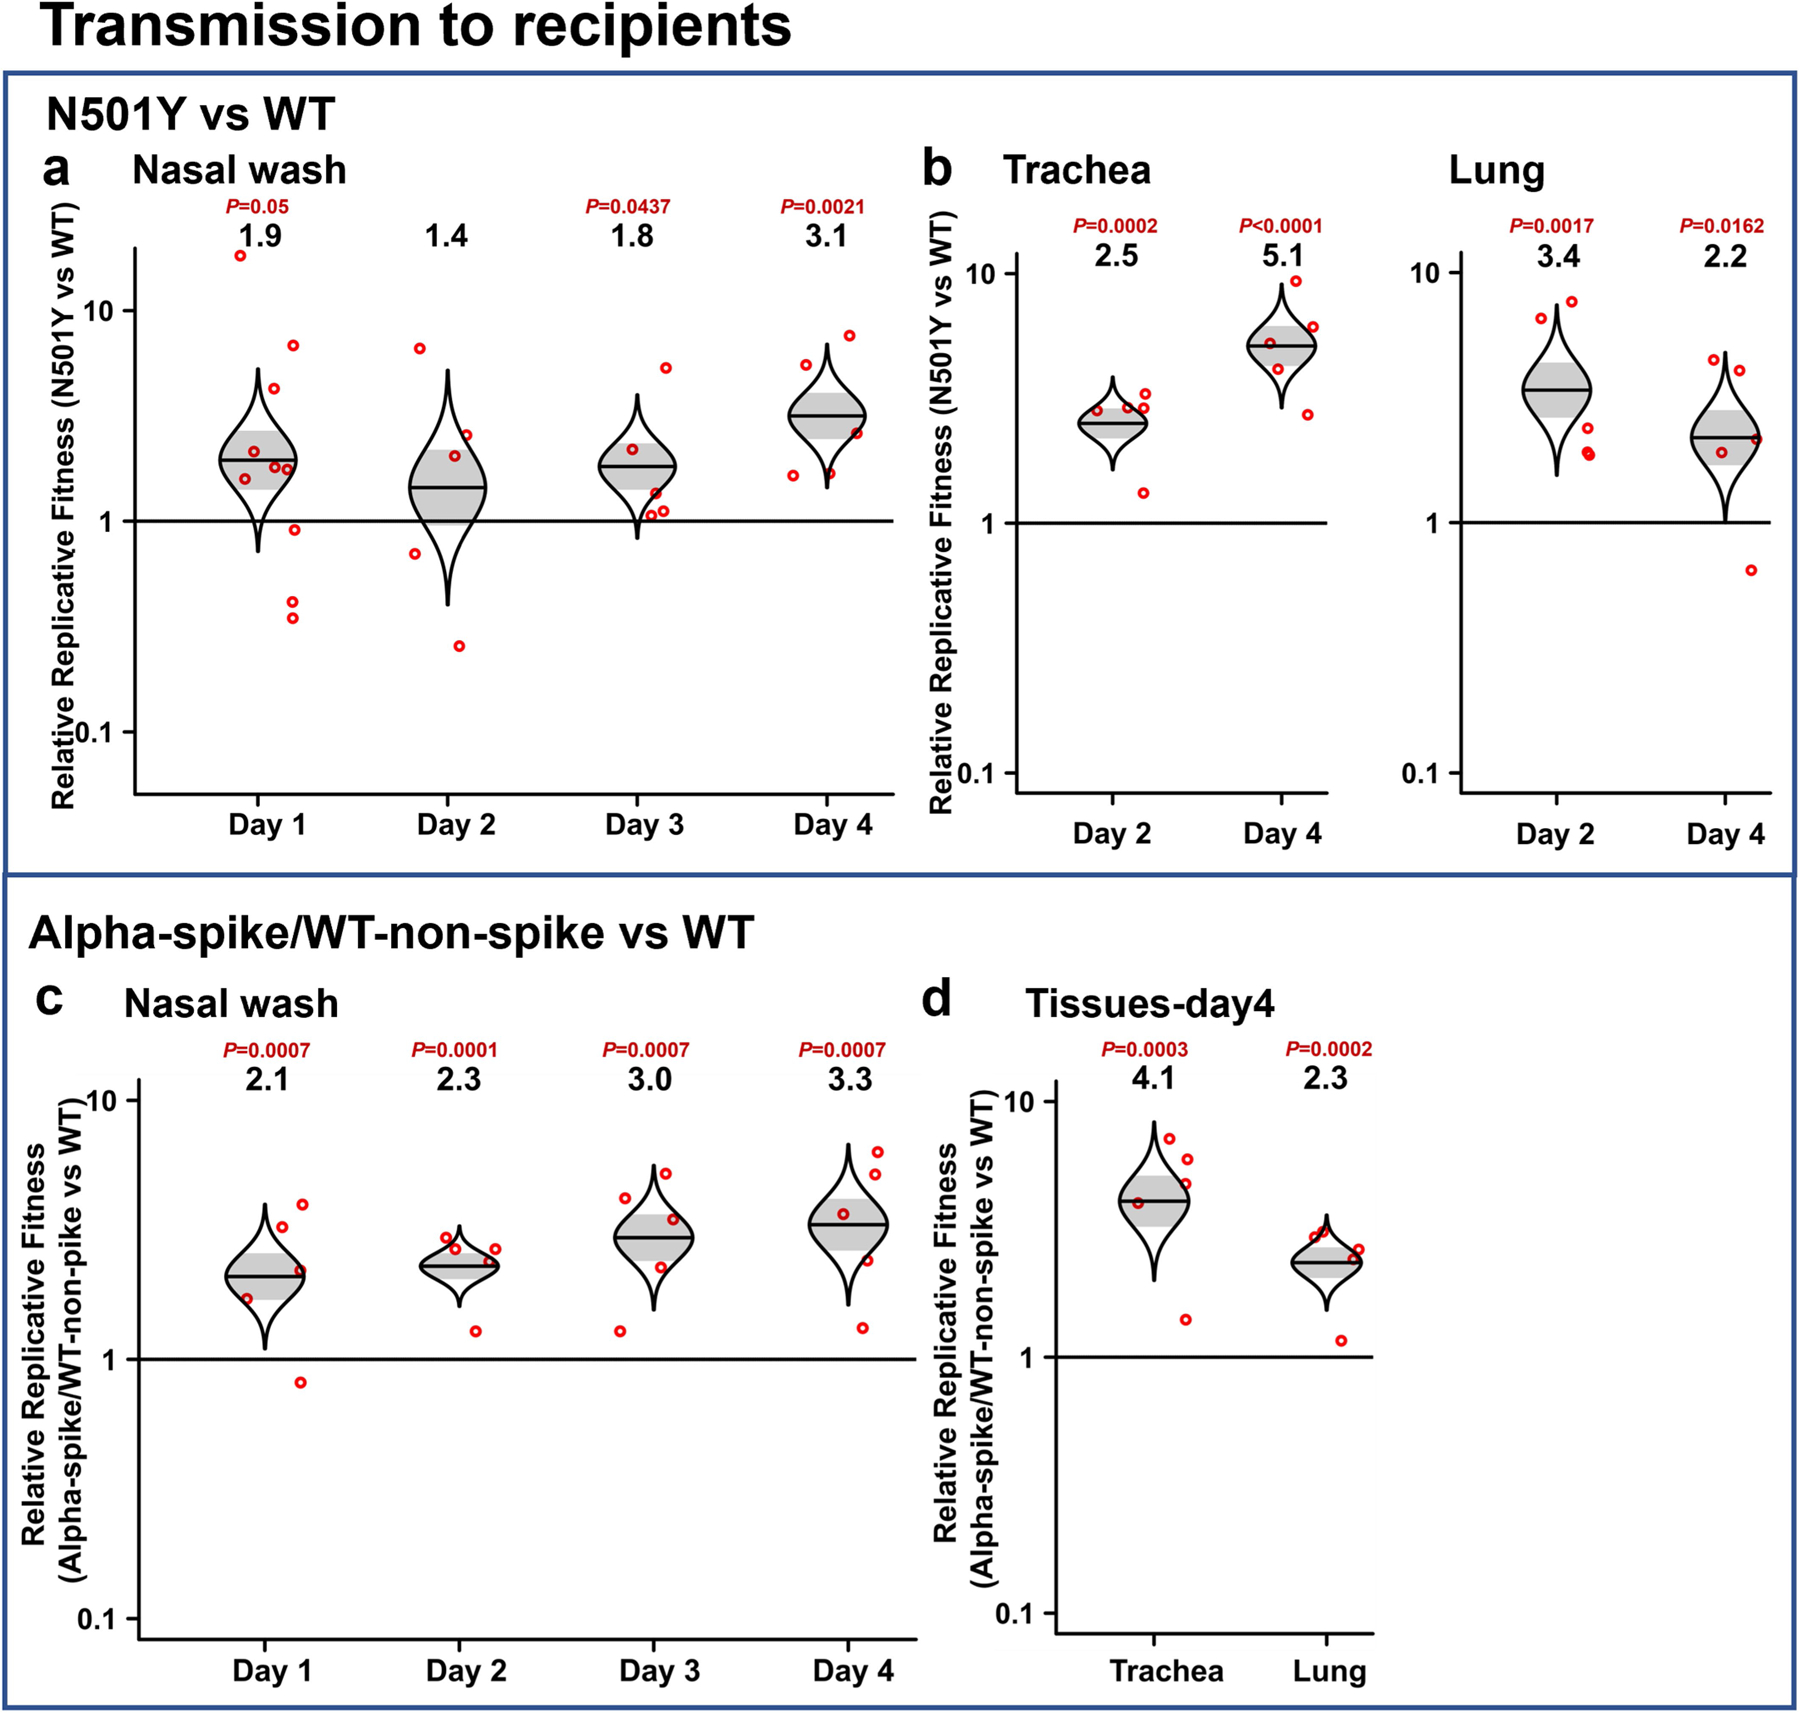
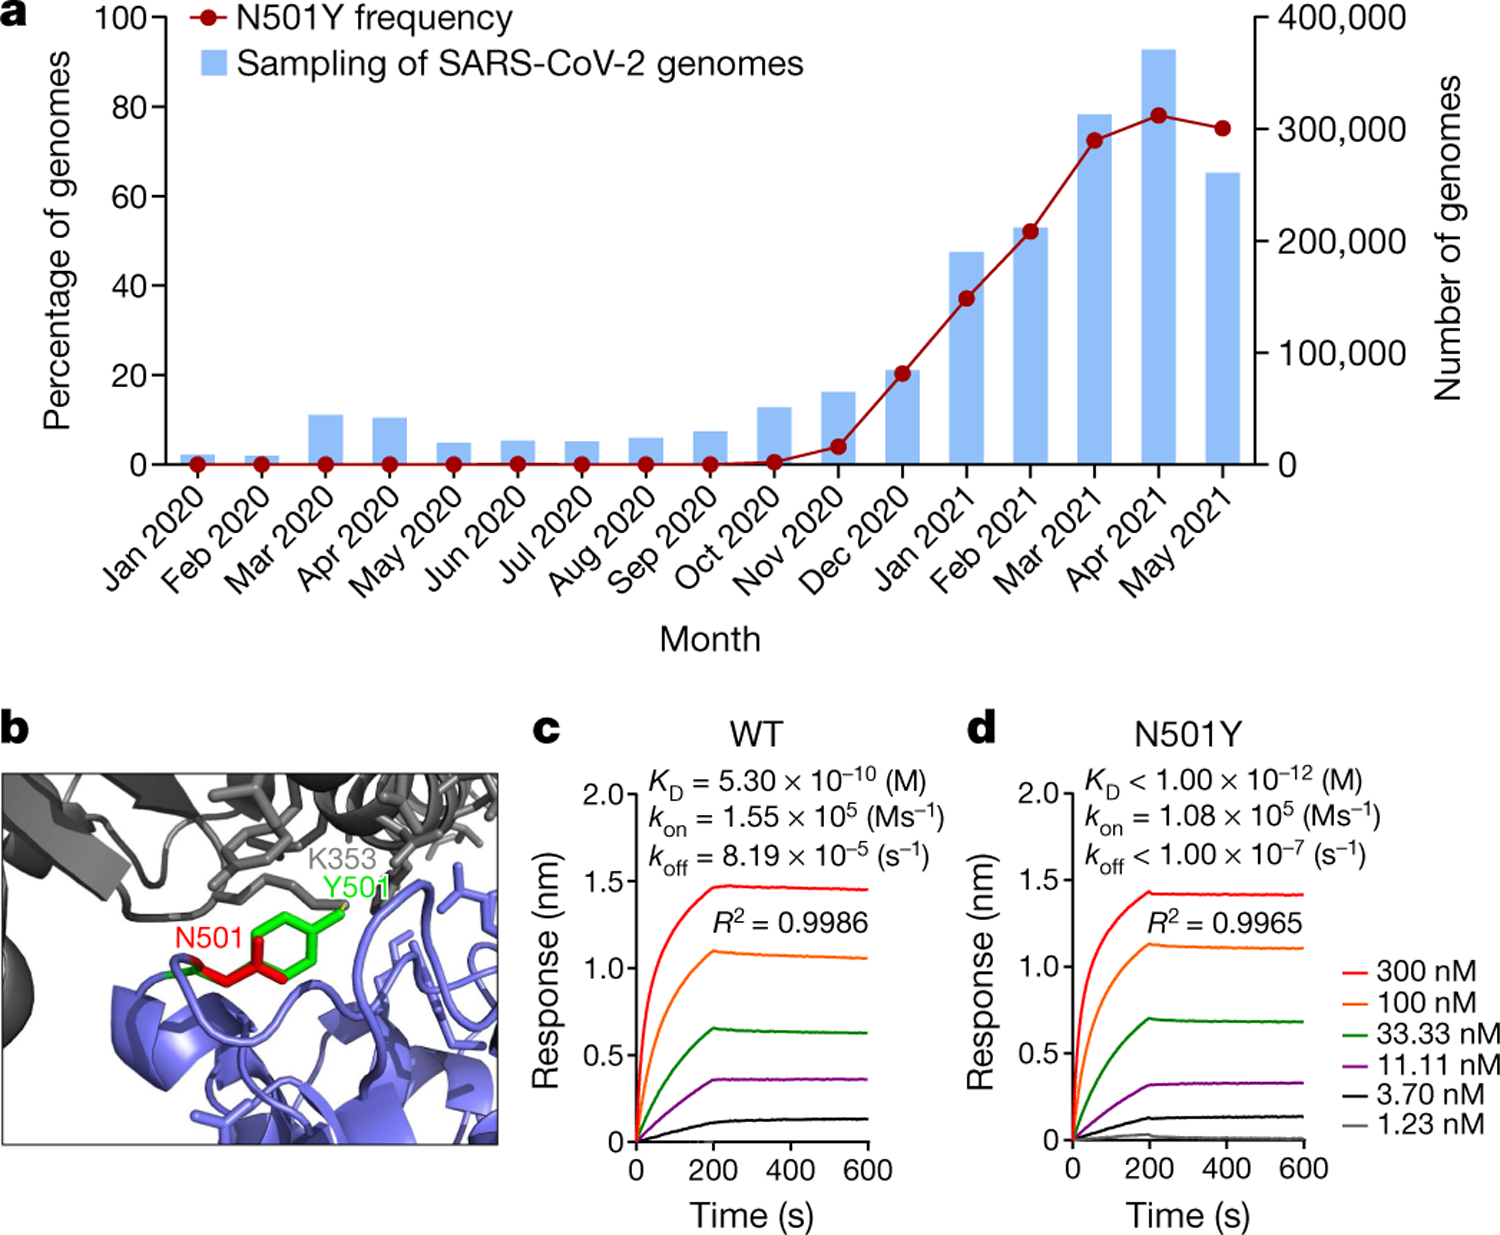
The B.1.1.7 variant (also known as Alpha) of SARS-CoV-2, the cause of the COVID-19 pandemic, emerged in the UK in the summer of 2020. The prevalence of this variant increased rapidly owing to an increase in infection and/or transmission efficiency1. The Alpha variant contains 19 nonsynonymous mutations across its viral genome, including 8 substitutions or deletions in the spike protein that interacts with cellular receptors to mediate infection and tropism. Here, using a reverse genetics approach, we show that of the 8 individual spike protein substitutions, only N501Y resulted in consistent fitness gains for replication in the upper airway in a hamster model as well as in primary human airway epithelial cells. The N501Y substitution recapitulated the enhanced viral transmission phenotype of the eight mutations in the Alpha spike protein, suggesting that it is a major determinant of the increased transmission of the Alpha variant. Mechanistically, the N501Y substitution increased the affinity of the viral spike protein for cellular receptors. As suggested by its convergent evolution in Brazil, South Africa and elsewhere2,3, our results indicate that N501Y substitution is an adaptive spike mutation of major concern.


Conflict of interest statement

Competing interests X.X., V.D.M. and P.-Y.S. have filed a US provisional patent 63/000,713 ‘Reverse genetic system of SARS-CoV-2’, filed on 27 March 2020, on the reverse genetic system and reporter SARS-CoV-2. The other authors declare no competing interests.

Figures

Extended Data Fig. 1 |
Extended Data Fig. 1 |. The construction and morphology of SARS-CoV-2 mutants.
a, The reverse genetic construction design of all the individual and combined mutations on the wt backbone (USA_WA1/2020 spike D614G mutant). L, leader sequence; S, Spike gene; Open reading frames, ORFs; E, envelope glycoprotein gene; M, membrane glycoprotein gene; N, nucleocapsid gene; UTR, untranslated region. b, The location of all 8 Alpha B.1.1.7 substitutions and D614G on the SARS-CoV-2 spike protein trimer. c, The schematic designs of the chimeric SARS-CoV-2 viruses. The wt is the USA_ WA1/2020 strain with the spike D614G substitution. The Alpha-spike/WT-non-spike contains the spike gene from the Alpha variant in the WT backbone. The WT-spike/Alpha-non-spike has the WT spike gene with all non-spike gene regions from the Alpha variant. The Alpha-FL is the infectious clone of full-length Alpha variant. d, The morphologies of all the rescued mutant SARS-CoV-2 variants. The plaques were stained 2.5 days post-infection of Vero E6 cells. e, The virus stocks of individual recombinant SARS-CoV-2 mutants, as well as Alpha-FL were quantified for their genomic RNA and infectious plaque-forming units by RT-qPCR and plaque assay, respectively. The genomes/PFU ratio was calculated to determine specific infectivity. Dots represent individual biological replicates from 4 different aliquots of viruses. The red dotted line indicates the average genome:PFU ratio of WT. The values in the graph represent the mean ± standard deviation. A two-tailed non-parametric Mann-Whitney test was used to determine significant differences between the variants and wt. P values were adjusted using the Bonferroni correction to account for multiple comparisons. No statistical differences were detected among groups.
Extended Data Fig. 2 |
Extended Data Fig. 2 |. Validation of SARS-CoV-2 ratio determination by Sanger sequencing.
a–l (Left panels), The correlation between input PFU ratios and output RT-PCR amplicon ratios determined by Sanger sequencing. WT and Mutant viruses were mixed at PFU ratios of 10:1, 5:1, 3:1, 1:1, 1:3, 1:5, or 1:10. Total RNAs of the virus mixtures were extracted and amplified by RT–PCR. The WT/Mutant ratios were calculated by the peak heights of Sanger sequencing. Data were analyzed by linear regression with correlation coefficients (r) and significance (P). Symbols represent individual replicates, and the solid line represents the fitted line. a–l (Right panels), Assay range evaluation. The ratio of wt/Mutant virus mixtures calculated from Sanger sequencing were consistent when using a wide range of virus amounts. The WT/Mutant viruses were mixed at 1:1 PFU ratio. The total titers of the mixed viruses were 106, 105, 104, 103, and 102 PFU. The total RNA of virus mixture was isolated and amplified by RT-PCR. The wt/Mutant ratios were calculated by the peak heights from Sanger sequencing. Symbols represent individual replicates, bar heights represent the mean, and error bars represent the standard deviation. a–l, Data are derived from a single experiment conducted in triplicate (n = 3).
Extended Data Fig. 3 |
Extended Data Fig. 3 |. The competition of other SARS-CoV-2 mutants with wt in hamsters.
a–h, Eight SARS-CoV-2 spike mutants: Δ69–70 (a), Δ145 (b), A570D (c), P681H (d), T716I (e), S982A (f), D1118H (g) and Alpha-spike/WT-non-spike (h) were mixed with wt virus at a PFU ratio of 1:1. The mixture was then inoculated intranasally into donor hamsters and transmitted to the recipient hamsters following the scheme in Figure 1a. The total titer for infection was 105 PFU per hamster. The ratios of the mutant:wt in the nasal washes of hamsters sampled 1–4 days after infection were measured by Sanger sequencing. Red dots represent individual animals (n = 5), the horizontal lines in each catseye represent the mean, shaded regions represent standard error of the mean; y-axes use a log10 scale. Black numbers above each set of values (catseye) indicate the relative fitness estimates. P values were calculated for the group (strain) coefficient for each linear regression model.
Extended Data Fig. 4 |
Extended Data Fig. 4 |. Validation of N501Y competition assay by next generation sequencing.
a–e, The same RNA samples from N501Y competition with wt that were initially assessed using Sanger sequencing (Fig. 2a–f, Fig. 3g; lower panels here) were retested using next generation sequencing (NGS, upper panels). The samples were collected from the nasal washes (a, b) and tissues (c, d) from both donor and recipient hamsters and HAE cells (e). Red dots represent individual animals (n = 5, n=10 in day 1 nasal wash of N501Y group) or biological repeats (n = 6 for HAE cells pooled from two independent experiments), the horizontal lines in each catseye represent the mean, shaded regions represent standard error of the mean; y-axes use a log10 scale. Black numbers above each set of values (catseye) indicate the relative fitness estimates. P values are calculated for the group (strain) coefficient for each linear regression model.
Extended Data Fig. 5 |
Extended Data Fig. 5 |. Growth kinetics of mixed viruses in nasal wash of hamsters.
The replication kinetics of the mixed viruses (Alpha-FL with wt) in the nasal washes from both donors (left panel) and recipients (right panel) hamsters were measured by plaque assay. The nasal wash samples were collected from 1–4 days post-inoculation (donors) or post-contact (recipients). Dots represent individual hamsters (n = 5). The values in the graph represent the mean ± standard error of the mean.
Extended Data Fig. 6 |
Extended Data Fig. 6 |. Competitions between Alpha-FL and Alpha-spike/WT-non-spike in hamsters.
a, b, The Alpha-FL was mixed with Alpha-spike/WT-non-spike virus and inoculated intranasally into hamsters. Results of the competition were assessed by sampling nasal washes of both donor (a) and recipient hamsters (b) from 1–4 days post-inoculation (donors) or post-contact (recipients). c, d, Results of the competition between the Alpha-FL and the Alpha-spike/WT-non-spike in the tracheae and lungs of both donor (c) and recipient hamsters (d) at 4 days post-inoculation or post-contact. a–d, Red dots represent individual animals (n = 5), the horizontal lines in each catseye represent the mean, shaded regions represent standard error of the mean; y-axes use a log10 scale. Black numbers above each set of values (catseye) indicate the relative fitness estimates. P values are calculated for the group (strain) coefficient for each linear regression model.
Extended Data Fig. 7 |
Extended Data Fig. 7 |. The advantage of the N501Y substitution and Alpha-spike/WT-non-spike variant during the transmission from donor to recipient hamsters.
a–d, The ratios of mixed viruses in the nasal washes (a, c), tracheae and lungs (b, d) of recipient hamsters were compared to the ratios of N501Y:wt or Alpha-spike/WT-non-spike:wt measured on the day 1 nasal wash of donor hamsters to assess fitness for transmission to and early replication in the recipient hamsters, respectively. The total infection titer of the mixed viruses was 105 PFU per hamster. Red dots represent individual animals (n = 5; n=10 in day 1 nasal wash of N501Y group), the horizontal lines in each catseye represent the mean, shaded regions represent standard error of the mean; y-axes use a log scale. Black numbers above each set of values (catseye) indicate the relative fitness estimates. P values are calculated for the group (strain) coefficient for each linear regression model.
Extended Data Fig. 8 |
Extended Data Fig. 8 |. Competition assay between Alpha-spike/WT-non-spike and WT on primary human airway epithelial cells.
The Alpha-spike/WT-non-spike and WT were mixed in 1:1 pfu ratio and inoculated onto human airway epithelial (HAE) cells at a total MOI of 5. The ratios of Alpha-spike/WT-non-spike to the wt virus were measured by Sanger sequencing. Red dots represent individual biological replicates (n = 6), pooled from 2 independent experiments. The horizontal lines in each catseye represent the mean, shaded regions represent standard error of the mean; y-axes use a log10 scale. Black numbers above each set of values (catseye) indicate the relative fitness estimates. P values are calculated for the group (strain) coefficient for each linear regression model.
Extended Data Fig. 9 |
Extended Data Fig. 9 |. The spike N501Y substitution benefits viral infection of hamster upper airways.
a, Design of the hamster infection kinetic studies. The wt, N501Y and Alpha-spike viruses were intranasally inoculated into hamsters at a titer of 104 PFU per hamster. Nine hamsters were utilized for the initial infection in each group. At 2 days post-infection, 4 hamsters were sacrificed for organ collections. The nasal washes of the hamsters were collected on days 1, 2, 3 and 5 post-infection or before sacrifice. b, Weight change in hamsters following infection by the N501Y (n = 5) and Alpha-spike (n = 5) mutants compared to the wt (n = 5). MOCK group (n = 4) served as the negative (uninfected) control. The body weights were measured form 1–7 days post-infection. The weight loss data are shown as mean ± standard deviation and statistically analyzed using two-factor analysis of variance (ANOVA) with Tukey’s post hoc test. No significant differences were seen between the N501Y/Alpha-spike and wt groups. c–h, The infection of N501Y and Alpha-spike mutants compared to the wt in the nasal washes (c–e) collected 1 (n = 9), 2 (n = 4), 3 (n = 5), or 5 (n = 5) days post-infection and in the organs (f–h) 2 days (n = 4) post-infection. The amounts of infectious virus (c, f) and genomic RNA (d, g) were quantified by plaque assay and RT–qPCR, respectively. The genomic RNA:PFU ratio (e, h) was calculated as an indication of virion infectivity. The values in the graph represent the mean ± standard error of the mean. A non-parametric two-tailed Mann-Whitney test was used to determine significant differences. P values were adjusted using the Bonferroni correction to account for multiple comparisons. Differences were considered significant if p<0.025.
Fig. 1 |
Fig. 1 |. The screening of the SARS-CoV-2 Alpha variant spike substitutions in hamsters by competition assay.
a, Design of the hamster competition fitness studies. The mutant viruses were mixed 1:1 (PFU ratio) with WT virus and inoculated into donor hamsters intranasally at a total titre of 105 PFU per hamster. The donor hamsters were co-housed with recipient hamsters 1 day after infection. After 8 h of contact, the donors were removed. All hamsters were subjected to nasal washes daily until 4 days after infection and organs were collected 4 days after inoculation or contact. bg, Competition of different Alpha mutants with WT virus. b, d, f, Final:inoculum PFU ratio of WT virus expressing 8 individual spike mutations or the Alpha spike protein that includes all 8 mutations: nasal washes (b), tracheae (d) and lungs (f) in donor hamsters 4 days after inoculation. c, e, g, Final:donor inoculum ratios of WT virus expressing 8 individual spike mutations or the Alpha spike protein: nasal washes (c), tracheae (e) and lungs (g) in recipient hamsters 4 days after contact. In bg, red dots represent individual hamsters (n = 5). In catseye plots, the horizontal line shows the mean and the shaded region represents s.e.m. Numbers along the top indicate the relative fitness estimates. P values were calculated for the group (strain) coefficient for each linear regression model.
Fig. 2 |
Fig. 2 |. The SARS-CoV-2 spike N501Y mutant has a consistent advantage over wild-type spike in upper airway replication in hamsters.
a, b, Competition assays between N501Y and wild-type (WT) spike assessed by sampling nasal washes of donor (a) and recipient (b) hamsters on days 1 to 4 after inoculation (donors) or contact (recipients). cf, Competition assays between N501Y and wild-type spike in the tracheae and lungs of donor (c, d) and recipient hamsters (e, f) on days 2 and 4 after inoculation (donors) or contact (recipients). gj, Competition assays between Alpha-FL virus and WT virus inoculated intranasally into hamsters. Nasal washes were taken on days 1 to 4 after inoculation (donors) (g) or contact (recipients) (h) and tracheae and lungs of donor (i) and recipient hamsters (j) 4 days after inoculation (donors) or contact (recipients). kn, Competition between Alpha-FL and Alpha (WT spike) assessed by sampling nasal washes on days 1 to 4 after inoculation (donors) (k) or contact (recipients) (l) and tracheae and lungs of donor (m) and recipient hamsters (n) 4 days after inoculation (donors) or contact (recipients). The fitness advantages of the N501Y substitution and Alpha-FL compared with the wild-type both during infection (in donors) and after transmission of the virus to recipients are shown by the changes in ratios between the collected samples and inocula. Red dots represent individual hamsters (all n = 5, except n = 10 for day-1 nasal wash samples of N501Y group). In catseye plots, the horizontal line represents the mean, the shaded region represents s.e.m. Numbers along the top indicate the relative fitness estimates. P values were calculated for the group (strain) coefficient for each linear regression model.
Fig. 3 |
Fig. 3 |. The spike N501Y mutation enhances viral replication in primary human airway cells and confers an advantage in competition with wild-type spike in vitro.
a, Experimental scheme. Viruses expressing wild-type spike, and N501Y and Alpha spike mutants were inoculated onto HAE cells at a multiplicity of infection (MOI) of 5 PFU per cell. After a 2-h incubation, the culture was washed with Dulbecco’s PBS 3 times and maintained for 5 days. The secreted viruses were collected in Dulbecco’s phosphate-buffered saline (DPBS) by 30 min incubation at 37 °C every day. bd, Viral replication kinetics and genomic RNA:PFU ratios. The amounts of infectious virus (b) and genomic RNA (c) were quantified by plaque assay and quantitative PCR with reverse transcription (RT–qPCR), respectively. The genomic RNA:PFU ratio (d) was calculated as an indication of virion infectivity. Dots represent individual biological replicates (n = 6) pooled from 2 independent experiments. Data are mean ± s.e.m. Nonparametric two-tailed Mann–Whitney test with Bonferroni correction to account for multiple comparisons. Differences were considered significant if P < 0.025. eg, Competition assay between WT virus expressing spike N501Y and WT virus on Vero E6 (e), Calu-3 (f) and HAE (g) cells. h, i, Competition assay between Alpha-FL and WT virus (h) and Alpha-FL and Alpha virus expressing wild-type spike protein (i) on HAE cells. ei, The Vero E6, Calu-3 and HAE cells were infected with mixed viruses at MOI of 0.01, 0.1 and 5, respectively. Red dots represent individual cell cultures (n = 6), pooled from two independent experiments. In catseye plots, the horizontal line represents the mean, the shaded region represents s.e.m. Numbers along the top indicate the relative fitness estimates. P values were calculated for the group (strain) coefficient for each linear regression model.
Fig. 4 |
Fig. 4 |. The spike N501Y substitution spread quickly and increases spike protein binding affinity for the human ACE2 receptor.
a, The frequency of the N501Y substitution over time in all genomic SARS-CoV-2 sequences available from the GISAID database worldwide up to May 2021. The blue bars represent the total numbers of SARS-CoV-2 genomes sequenced worldwide. The red line indicates the percentage of N501Y variant in total SARS-CoV-2 genomes. b, The predicted binding site of spike N501 and Y501 residues on the human ACE2 receptor. c, d, Binding affinities of wild-type spike (c) and spike(N501Y) (d) to the human ACE2 receptor. KD, dissociation constant; koff, dissociation rate constant; kon, association rate constant. The affinity of ACE2 to the N501Y mutant RBD is below the detection limit and is plotted as <10−12. Data are derived from a single experiment.

Update of

References

    1. Leung K, Shum MH, Leung GM, Lam TT & Wu JT Early transmissibility assessment of the N501Y mutant strains of SARS-CoV-2 in the United Kingdom, October to November 2020. Euro Surveill 26, 2002106 (2021). - PMC - PubMed
    1. Galloway SE et al. Emergence of SARS-CoV-2 B.1.1.7 lineage—United States, December 29, 2020–January 12, 2021. MMWR Morb. Mortal. Wkly Rep. 70, 95–99 (2021). - PMC - PubMed
    1. Claro IM et al. Local transmission of SARS-CoV-2 lineage B.1.1.7, Brazil, December 2020. Emerg. Infect. Dis. 27, 970–972 (2021). - PMC - PubMed
    1. Zhou P et al. A pneumonia outbreak associated with a new coronavirus of probable bat origin. Nature 579, 270–273 (2020). - PMC - PubMed
    1. Smith EC, Blanc H, Surdel MC, Vignuzzi M & Denison MR Coronaviruses lacking exoribonuclease activity are susceptible to lethal mutagenesis: evidence for proofreading and potential therapeutics. PLoS Pathog. 9, e1003565 (2013). - PMC - PubMed

Publication types

MeSH terms

Substances

Supplementary concepts