. 2021 Dec 27;8(6):ENEURO.0299-21.2021.
doi: 10.1523/ENEURO.0299-21.2021. Print 2021 Nov-Dec.

Lack of Hyperinhibition of Oriens Lacunosum-Moleculare Cells by Vasoactive Intestinal Peptide-Expressing Cells in a Model of Temporal Lobe Epilepsy

Affiliations

Lack of Hyperinhibition of Oriens Lacunosum-Moleculare Cells by Vasoactive Intestinal Peptide-Expressing Cells in a Model of Temporal Lobe Epilepsy

Megan Wyeth et al. eNeuro. .

Abstract

Temporal lobe epilepsy remains a common disorder with no cure and inadequate treatments, potentially because of an incomplete understanding of how seizures start. CA1 pyramidal cells and many inhibitory interneurons increase their firing rate in the seconds-minutes before a spontaneous seizure in epileptic rats. However, some interneurons fail to do so, including those identified as putative interneurons with somata in oriens and axons targeting lacunosum-moleculare (OLM cells). Somatostatin-containing cells, including OLM cells, are the primary target of inhibitory vasoactive intestinal polypeptide and calretinin-expressing (VIP/CR) bipolar interneuron-selective interneurons, type 3 (ISI-3). The objective of this study was to test the hypothesis that in epilepsy inhibition of OLM cells by ISI-3 is abnormally increased, potentially explaining the failure of OLM recruitment when needed most during the ramp up of activity preceding a seizure. Stereological quantification of VIP/CR cells in a model of temporal lobe epilepsy demonstrated that they survive in epileptic mice, despite a reduction in their somatostatin-expressing (Som) cell targets. Paired recordings of unitary IPSCs (uIPSCs) from ISI-3 to OLM cells did not show increased connection probability or increased connection strength, and failure rate was unchanged. When miniature postsynaptic currents in ISI-3 were compared, only mIPSC frequency was increased in epileptic hippocampi. Nevertheless, spontaneous and miniature postsynaptic potentials were unchanged in OLM cells of epileptic mice. These results are not consistent with the hypothesis of hyperinhibition from VIP/CR bipolar cells impeding recruitment of OLM cells in advance of a seizure.

Keywords: CA1; CCK; OLM; VIP; hippocampus; interneuron.


Figures

Figure 1.
Figure 1.
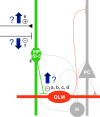
Possible mechanisms for hypothesized increased inhibition of somatostatin-containing OLM cells by VIP ISI-3 in CA1. a, Increased probability of ISI-3 synapsing with OLM cells because of OLM cell loss and/or VIP axonal sprouting. b, Increased amplitude of uIPSCs between ISI-3 and OLM cells. c, Reduced failure rate at ISI-3 to OLM cell synapses. d, Increased synaptic summation at ISI-3 to OLM cell connections. e, Increased excitatory synaptic drive of ISI-3. f, Reduced synaptic inhibition of ISI-3. g, Increased excitability of ISI-3 (PC: glutamatergic pyramidal cell, IN: other GABAergic interneurons in the local circuit).
Figure 2.
Figure 2.
GFP(VIP)+/CR+ cells persist in CA1 of epileptic mice. A, In a control VIP-eGFP mouse, somata are labeled with a GFP antibody (green) in CA1 stratum radiatum (r) and the pyramidal cell layer (p). Interneuron-selective bipolar cells (yellow arrows) additionally express CR (red). GFP(VIP)-expressing cells that lack CR (green arrows) include basket cells that inhibit pyramidal cells. Nuclei are labeled with DAPI (blue). B, CA1 of an epileptic mouse is shrunken, yet GFP(VIP)+/CR+ cells remain evident (yellow arrows). However, there are fewer GFP(VIP)+/CR– cells. C, The number of GFP(VIP)+/CR+ interneurons, and GFP(VIP)+/CR– interneurons in the radiatum and pyramidal cell layers of CA1 in control and epileptic mice were estimated by the optical fractionator method. On average, the number of GFP(VIP)+/CR+ cells per hippocampus (HC) is not reduced in epileptic mice, although the number of GFP(VIP)+/CR– interneurons is approximately halved (*t test: p = 0.0006). D, Neither is the number of GFP(VIP)+/CR+ cells reduced compared with controls across the septo-temporal extent of the hippocampus. E, However, the reduction of GFP(VIP)+/CR– interneurons is particularly apparent at temporal levels of the epileptic hippocampus (o: stratum oriens, lm: strata lacunosum-moleculare).
Figure 3.
Figure 3.
The Som cell targets of VIP bipolar cells in CA1 oriens are reduced in epileptic mice. A, Arrows indicate somatostatin-labeled cells, including OLM cells, in stratum oriens (o) near the alvear border of a control hippocampus. Strongly labeled OLM terminals are evident in strata lacunosum-moleculare (lm). B, Somatostatin-containing interneurons in CA1 oriens are reduced in a section from an epileptic mouse. C, Stereological quantification of the number of somatostatin-labeled interneurons in CA1 oriens confirms a decrease in hippocampi (HC) from epileptic mice (*t test: p = 0.001). D, This decrease is biased to septal hippocampal levels. E, Taking each CA1 as a whole, the ratio of Som interneurons to their innervating GFP(VIP)+/CR+ cells is not significantly different between control and epileptic mice (p: pyramidal cell layer, r: stratum radiatum).
Figure 4.
Figure 4.
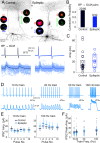
ISI-3 inhibition of OLM cells is not excessive in epileptic CA1. A, Representative examples of recorded VIP bipolar cell (BP) → OLM cell pairs in hippocampal slices. Insets show recorded cells filled with biocytin and labeled with streptavidin (SA; red) and somatostatin (Som; blue) or GFP (VIP, green; scale bar for insets: 20 μm). GFP in particular can be diluted because of the small size of the bipolar cell body. The amplitude of the uIPSC recorded from the epileptic mouse (blue) is not larger than the control pair (navy). The outward inhibitory currents were recorded holding the OLM cell at 0 mV. B, Connection probability between recorded pairs was not increased in pairs from epileptic mice. C, Neither was the average amplitude of the unitary connection significantly increased at the ISI-3 BP → OLM synapse in pairs from epileptic CA1. D, Example trains recorded from a different pair in an epileptic hippocampus. E, On average, IPSC amplitude and summation was not significantly different between epileptic and control pairs. F, Nor was the average peak IPSC amplitude different between epileptic and control pairs (strata oriens: o, pyramidale: p, radiatum: r, lacunosum-moleculare: lm).
Figure 5.
Figure 5.
The frequency of postsynaptic currents was largely unchanged in VIP bipolar cells of epileptic mice. A, The first recording shows inward spontaneous EPSCs (sEPSCs) recorded from a GFP(VIP)+ ISI-3 in a slice from a control mouse (navy). The second recording shows outward spontaneous IPSCs (sIPSCs) recorded from the same cell. The third recording shows miniature EPSCs (mEPSCs) following application of 1 μm TTX. The fourth recording shows miniature IPSCs (mIPSCs). B, Postsynaptic currents (green) recorded from a GFP(VIP)+ ISI-3 in a slice from an epileptic mouse under equivalent conditions as the control cell. The currents are similar to control, but mIPSC frequency is increased. C, D, Anatomy for the recorded GFP(VIP)+ bipolar cells from a control mouse (C) and an epileptic mouse (D) with dendrites extending up through stratum radiatum (r) to strata lacunosum-moleculare (lm) and down (in the case of the control cell) through the pyramidal cell layer (p) to stratum oriens (o), and with light axon labeling in oriens and the alveus (a). Insets show somatic labeling of GFP in VIP-expressing cells (green) colocalized with streptavidin (SA) labeling against biocytin-filled cells (red; scale bars for insets: 10 μm). E, Group data for sEPSCs and sIPSCs indicate that amplitude and frequency were not significantly different between ISI-3 from epileptic mice (Ep.) and controls (Cont.). F, Group data for mEPSC and mIPSC amplitude and frequency indicate that only mIPSC frequency was altered in VIP bipolar cells from epileptic mice (*two-way repeated measures ANOVA: p = 0.003). Nevertheless, the ratio for mEPSC frequency to mIPSC frequency (E/I Freq) was unchanged in ISI-3 of epileptic mice.
Figure 6.
Figure 6.
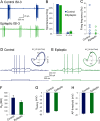
Intrinsic properties of ISI-3. A, Spontaneous action potentials were recorded in cell-attached mode from an ISI-3 of a control mouse (blue) and an epileptic mouse (green). B, Most ISI-3 were not active in either control or epileptic CA1. Values indicate the number of cells in each group. C, Plot of the firing rates recorded in ISI-3 from control and epileptic mice. D, Voltage responses (top) of a different ISI-3 from a control mouse in response to square wave current pulses (bottom, −10 pA and just suprathreshold), and phase plots of the action potentials (inset). E, Electrophysiological responses (top) from a different ISI-3 of an epileptic mouse in response to current injections (bottom), and phase plots of the action potentials (inset). F–H, Input resistance (Rin; F), resting membrane potential (Vresting; G), and action potential threshold (H) were not significantly different in the ISI-3 recorded from epileptic mice compared with controls.
Figure 7.
Figure 7.
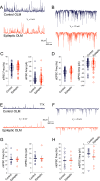
Synaptic inputs to OLM cells were not altered in epileptic mice. A, Slice recordings of sIPSCs in OLM cells from a control (navy) and epileptic (orange) mouse are similar. B, Recordings of sEPSCs from OLM cells are also comparable between the control and epileptic mouse. C, On average, there was no difference in sIPSC frequency or amplitude in OLM cells from control and epileptic mice. D, Neither were sEPSC frequency or amplitude altered in OLM cells of epileptic mice relative to controls. E, F, In the presence of TTX, mIPSCs (E) and mEPSCs (F) are likewise similar between OLM cells from control and epileptic mice. G, H, Group data indicate that the frequency and amplitude of mIPSCs (G) and mEPSCs (H) in OLM cells were not significantly different between control and epileptic mice.
Figure 8.
Figure 8.
Intrinsic properties of OLM cells. A, Cell-attached recordings of spontaneous action potentials from OLM cells of a control (blue) and an epileptic mouse (orange) are similar. B, Chart of the percentage of OLM cells that were silent or spontaneously firing in control and epileptic mice. C, The action potential frequencies of OLM cells recorded from control and epileptic mice was not significantly different. D, The input resistance of OLM cells recorded from epileptic mice was not significantly different from controls.

Similar articles

Cited by

References

    1. Acsády L, Arabadzisz D, Freund TF (1996a) Correlated morphological and neurochemical features identify different subsets of vasoactive intestinal polypeptide-immunoreactive interneurons in rat hippocampus. Neuroscience 73:299–315. 10.1016/0306-4522(95)00610-9 - DOI - PubMed
    1. Acsády L, Görcs TJ, Freund TF (1996b) Different populations of vasoactive intestinal polypeptide-immunoreactive interneurons are specialized to control pyramidal cells or interneurons in the hippocampus. Neuroscience 73:317–334. 10.1016/0306-4522(95)00609-5 - DOI - PubMed
    1. Ali AB, Thomson AM (1998) Facilitating pyramid to horizontal oriens-alveus interneurone inputs: dual intracellular recordings in slices of rat hippocampus. J Physiol 507:185–199. 10.1111/j.1469-7793.1998.185bu.x - DOI - PMC - PubMed
    1. Booker SA, Harada H, Elgueta C, Bank J, Bartos M, Kulik A, Vida I (2020) Presynaptic GABAB receptors functionally uncouple somatostatin interneurons from the active hippocampal network. Elife 9:e51156. 10.7554/eLife.51156 - DOI - PMC - PubMed
    1. Chamberland S, Salesse C, Topolnik D, Topolnik L (2010) Synapse-specific inhibitory control of hippocampal feedback inhibitory circuit. Front Cell Neurosci 4:130. 10.3389/fncel.2010.00130 - DOI - PMC - PubMed

Publication types

Substances

LinkOut - more resources