. 2022 Feb;12(2):468-483.
doi: 10.1158/2159-8290.CD-21-1376. Epub 2021 Nov 24.

Live-Cell Imaging Shows Uneven Segregation of Extrachromosomal DNA Elements and Transcriptionally Active Extrachromosomal DNA Hubs in Cancer

Affiliations

Live-Cell Imaging Shows Uneven Segregation of Extrachromosomal DNA Elements and Transcriptionally Active Extrachromosomal DNA Hubs in Cancer

Eunhee Yi et al. Cancer Discov. 2022 Feb.

Abstract

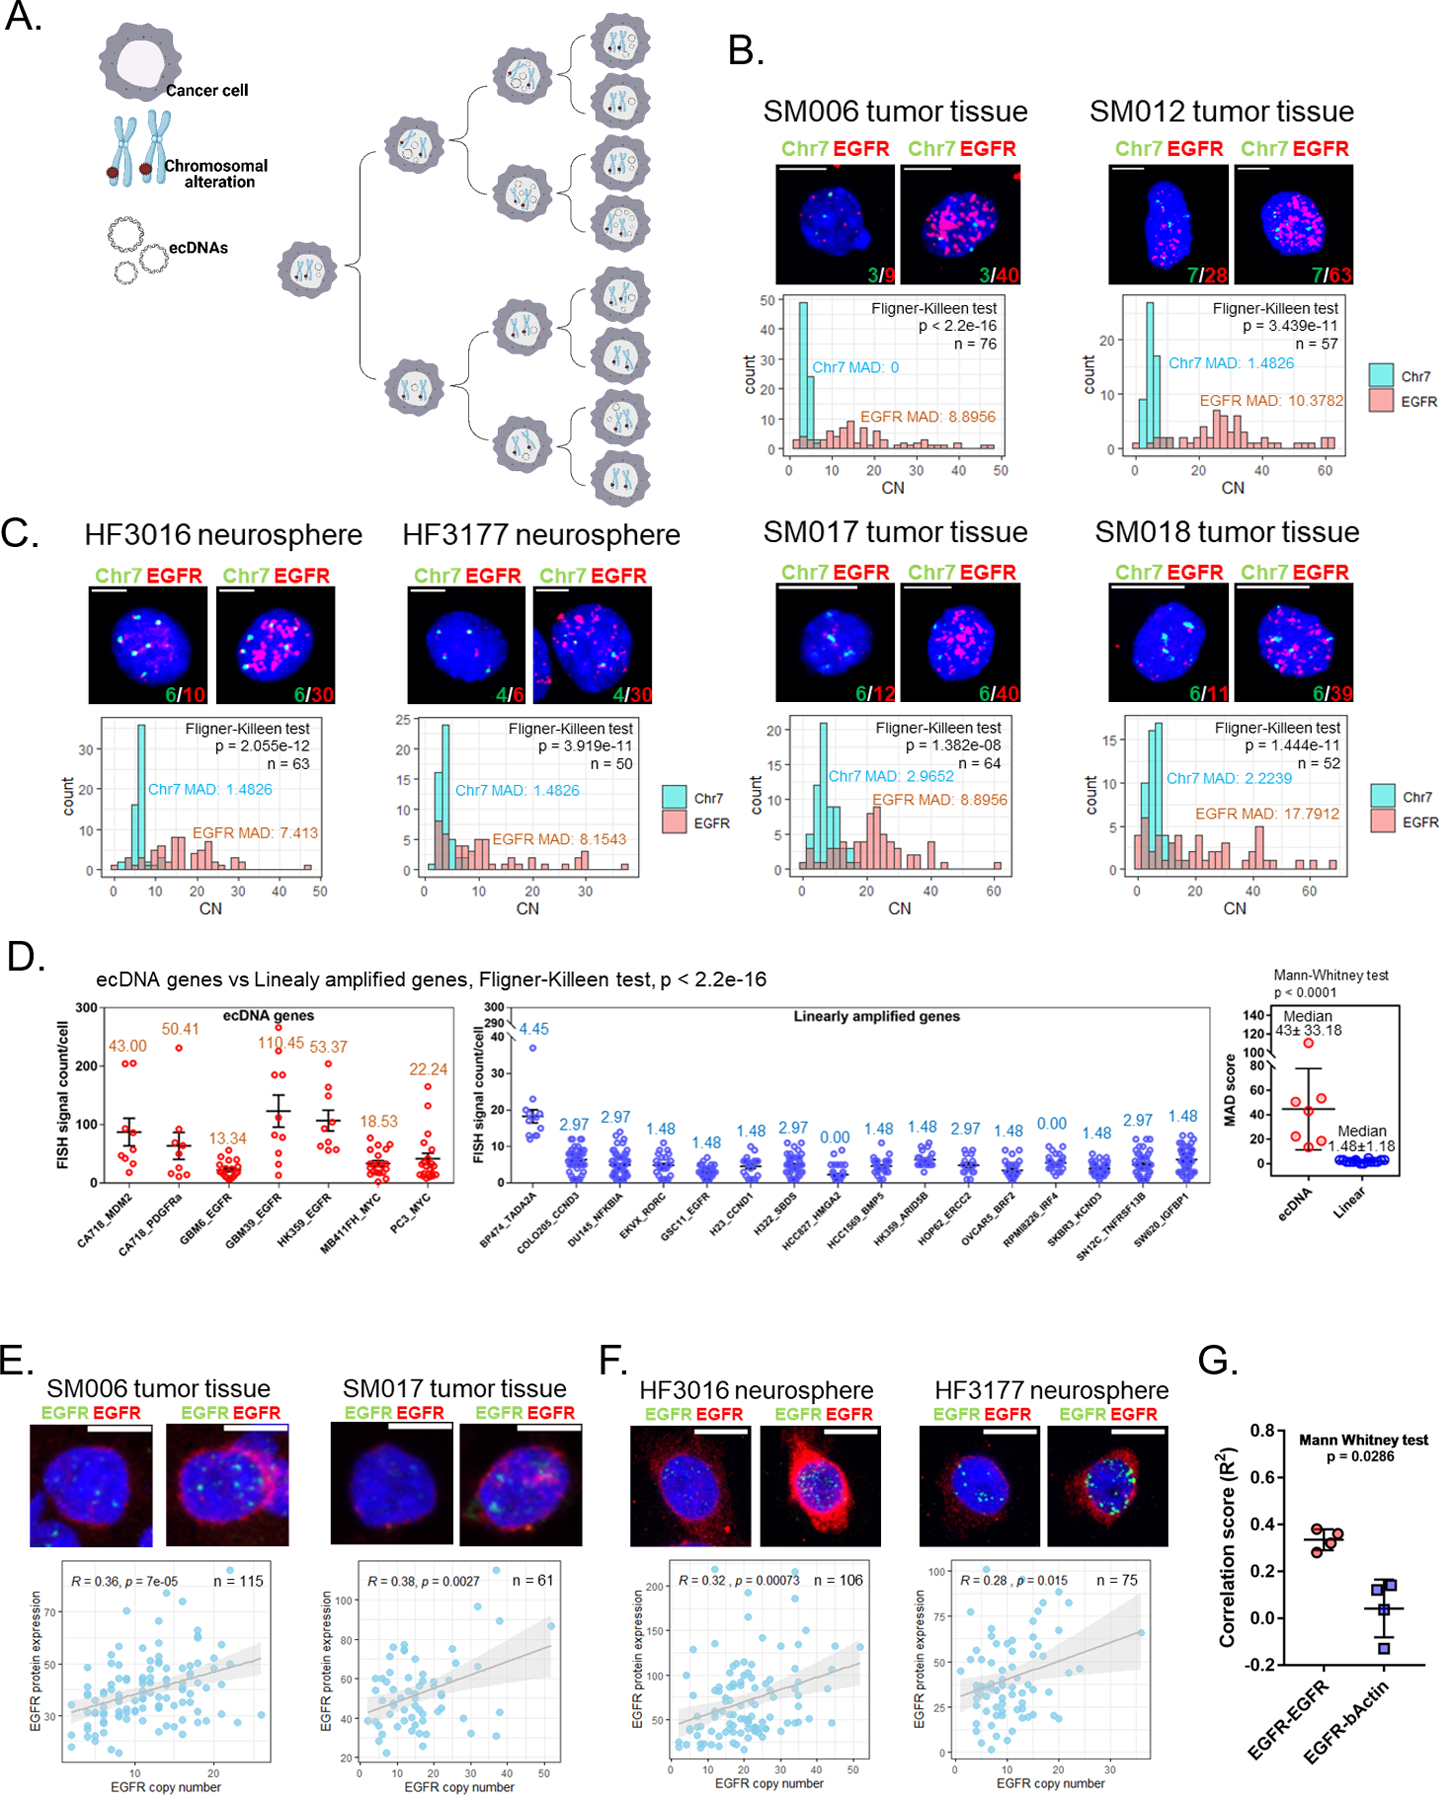
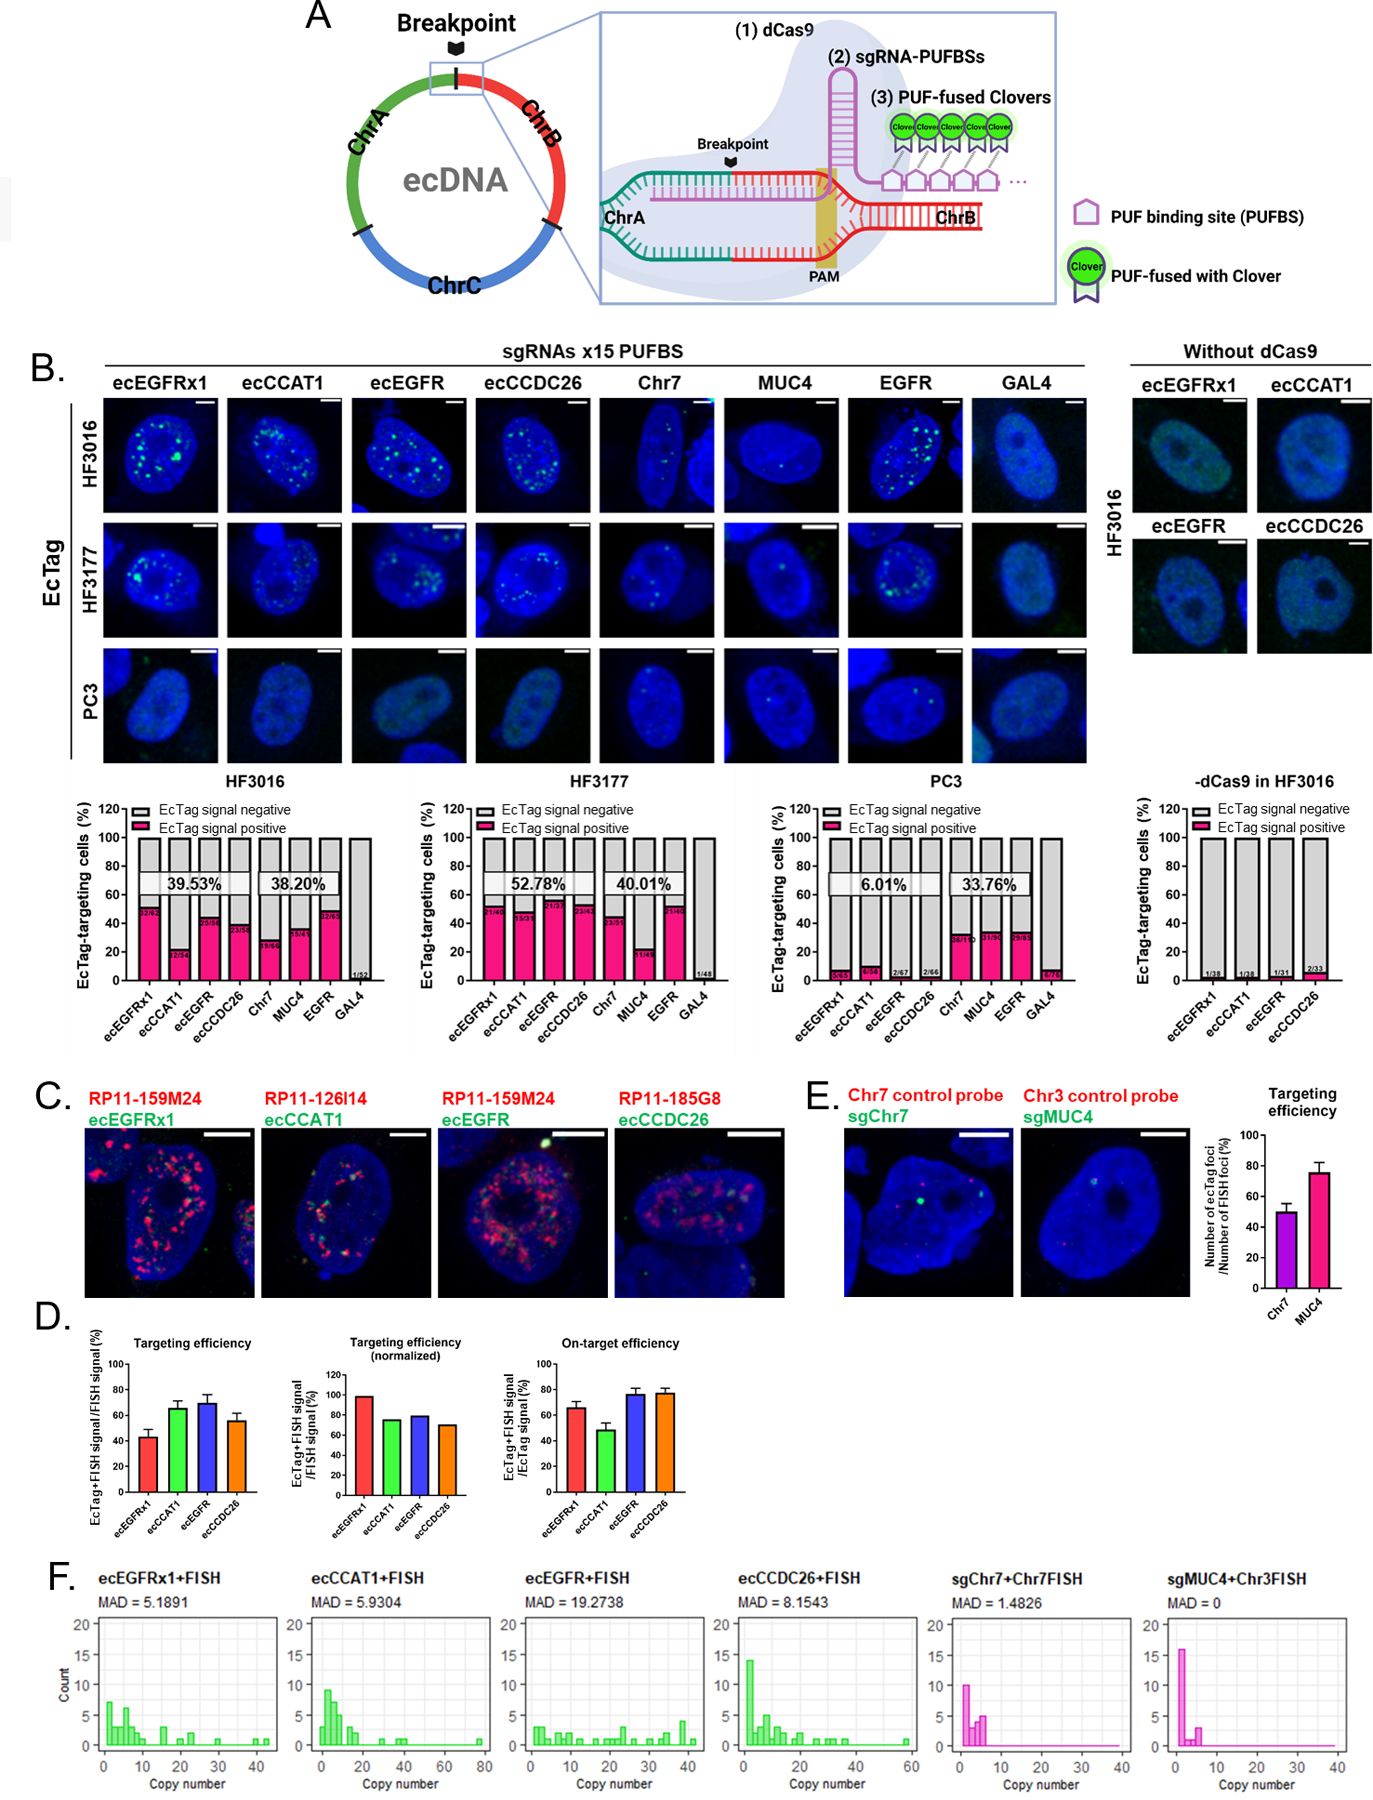
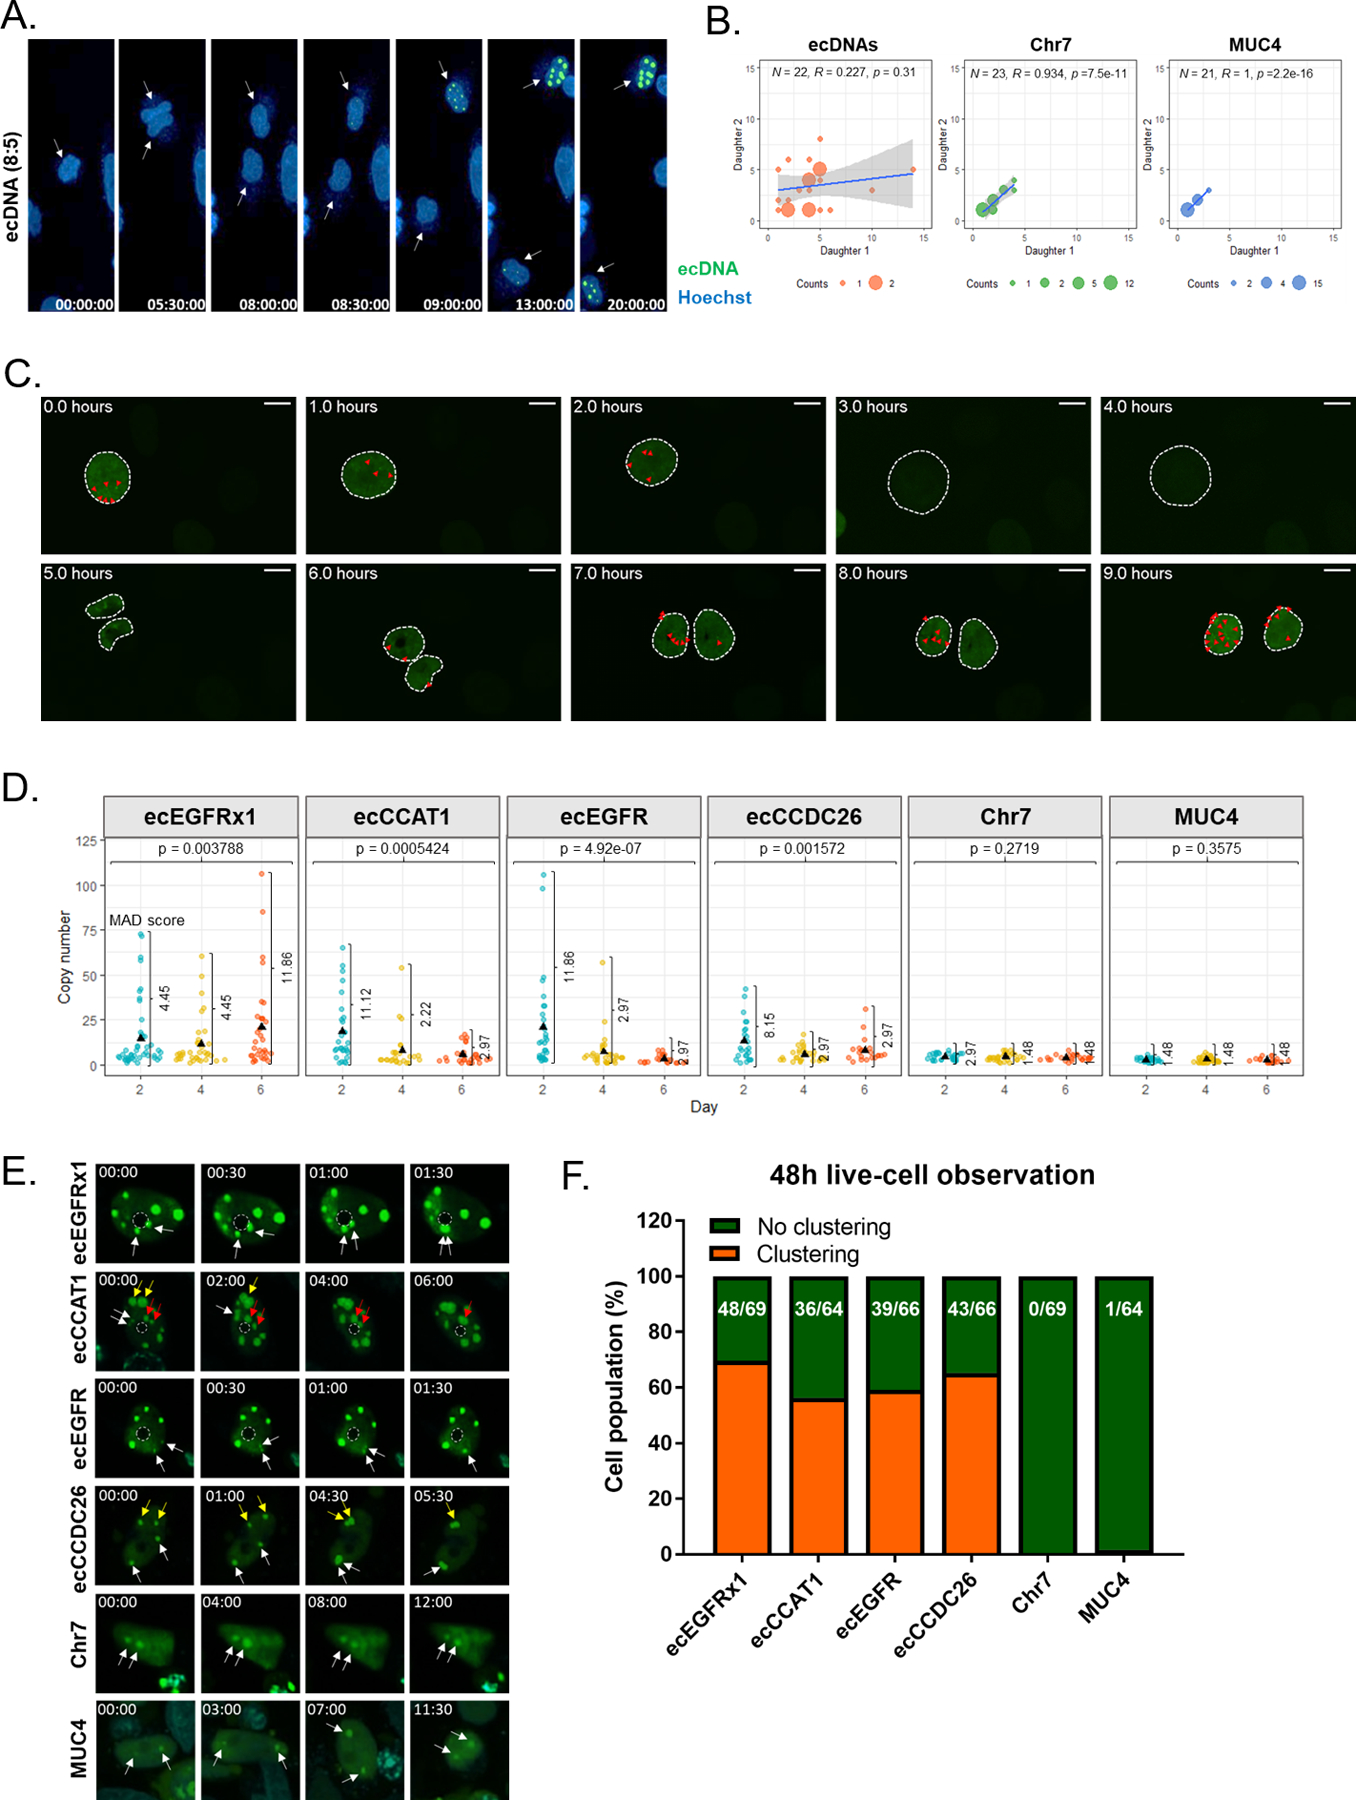
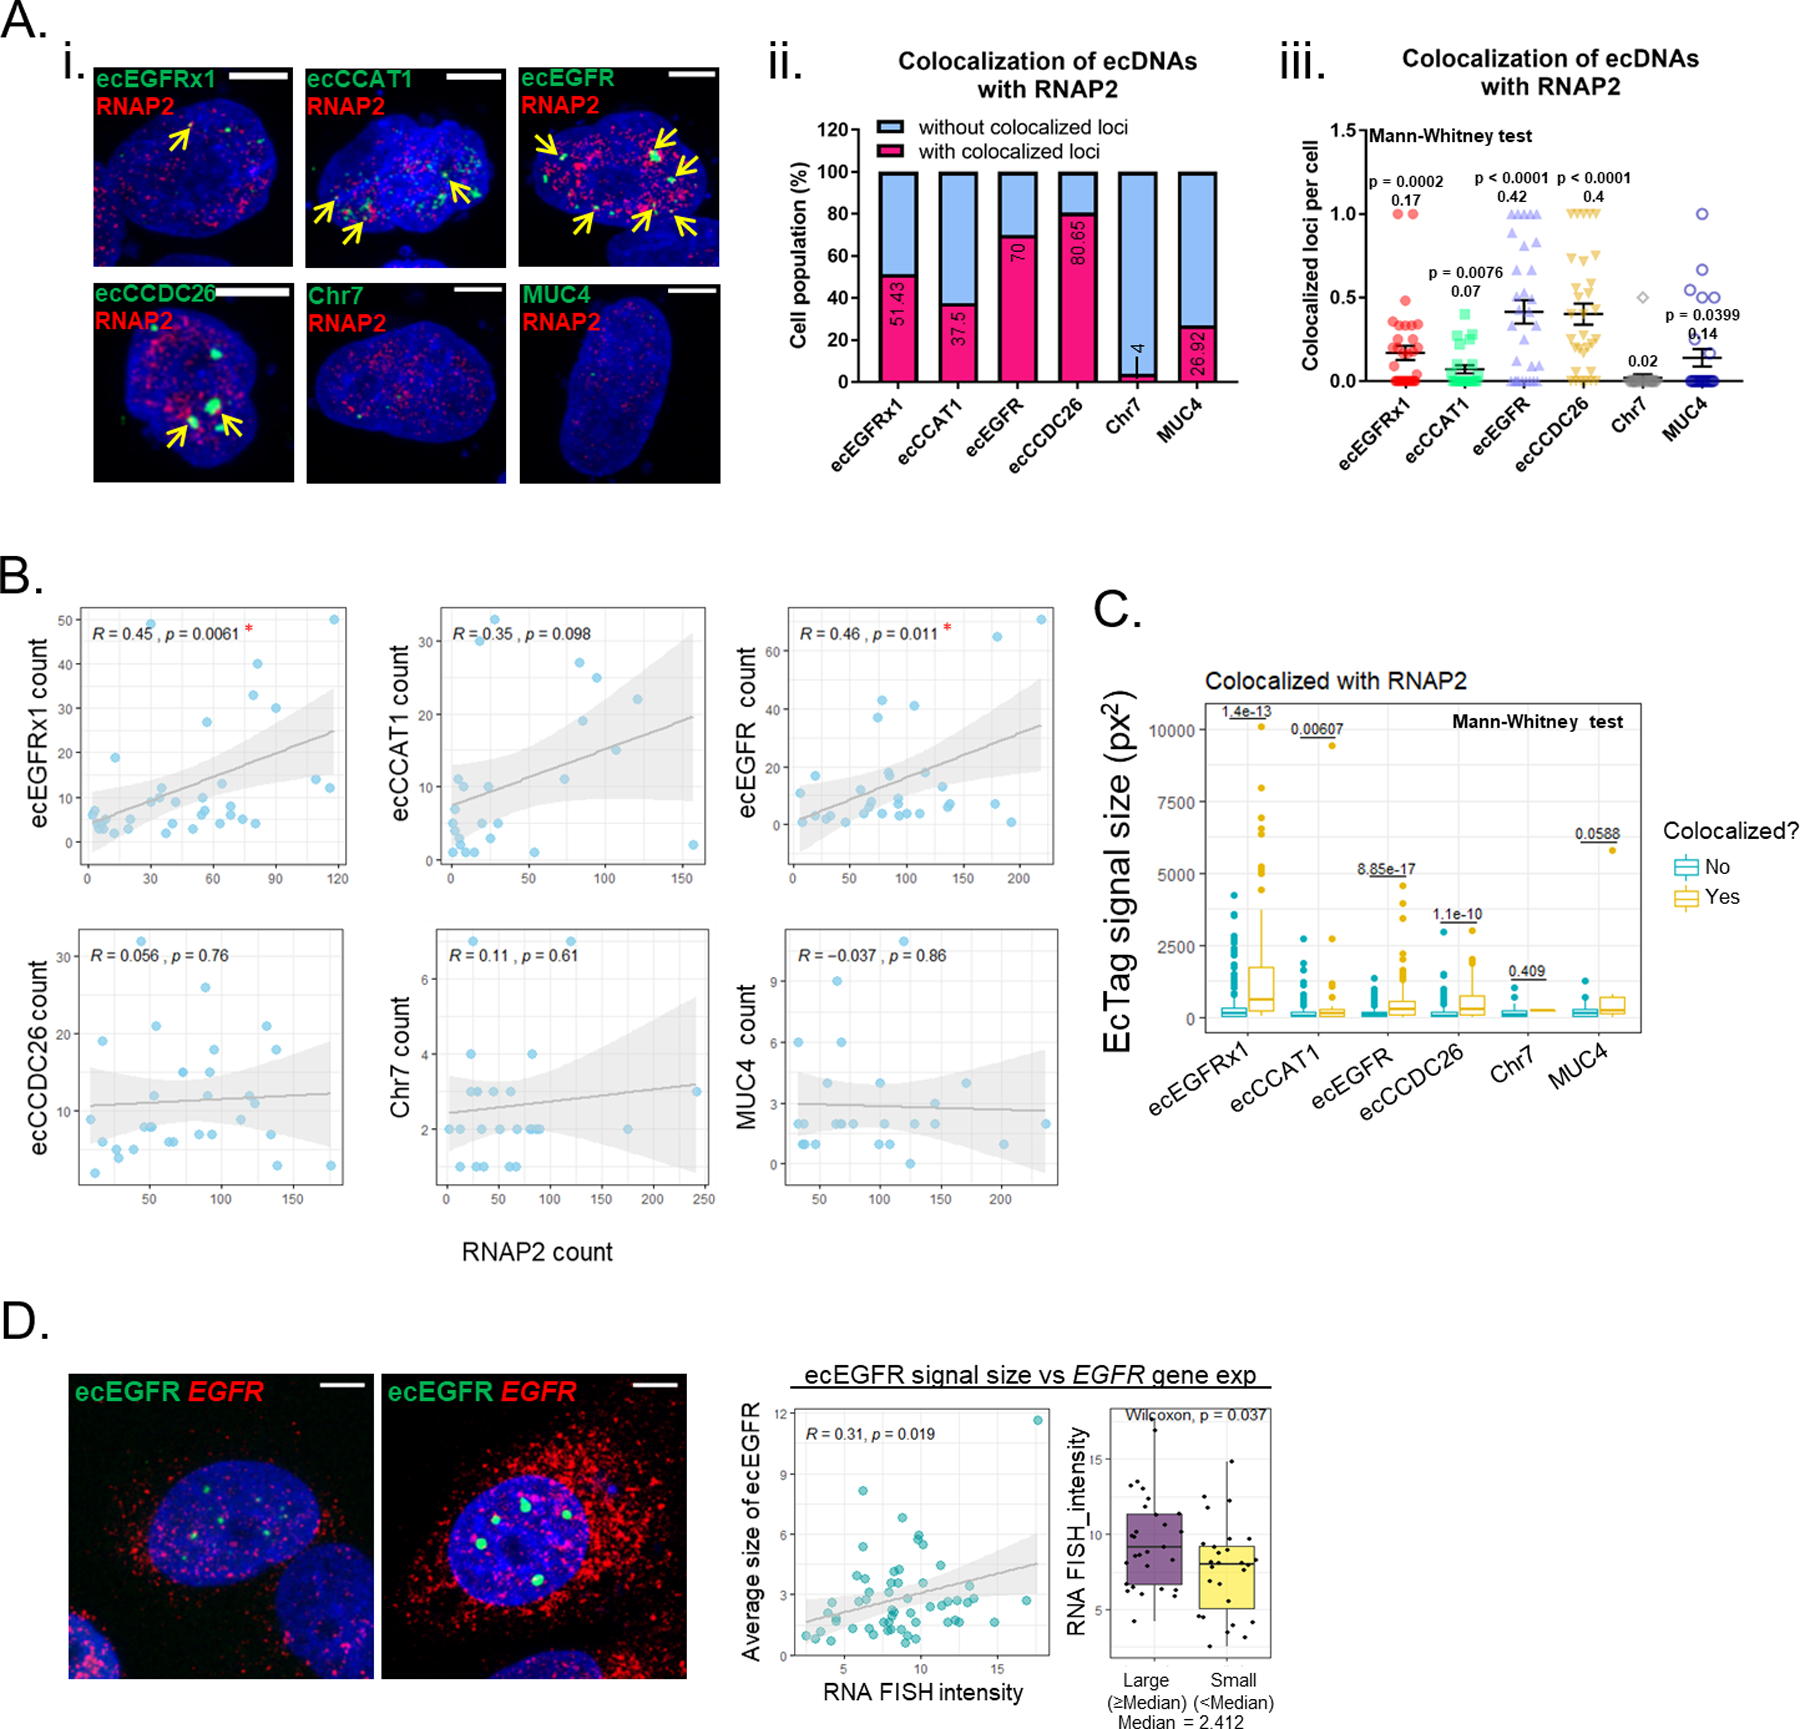
Oncogenic extrachromosomal DNA elements (ecDNA) play an important role in tumor evolution, but our understanding of ecDNA biology is limited. We determined the distribution of single-cell ecDNA copy number across patient tissues and cell line models and observed how cell-to-cell ecDNA frequency varies greatly. The exceptional intratumoral heterogeneity of ecDNA suggested ecDNA-specific replication and propagation mechanisms. To evaluate the transfer of ecDNA genetic material from parental to offspring cells during mitosis, we established the CRISPR-based ecTag method. ecTag leverages ecDNA-specific breakpoint sequences to tag ecDNA with fluorescent markers in living cells. Applying ecTag during mitosis revealed disjointed ecDNA inheritance patterns, enabling rapid ecDNA accumulation in individual cells. After mitosis, ecDNAs clustered into ecDNA hubs, and ecDNA hubs colocalized with RNA polymerase II, promoting transcription of cargo oncogenes. Our observations provide direct evidence for uneven segregation of ecDNA and shed new light on mechanisms through which ecDNAs contribute to oncogenesis. SIGNIFICANCE: ecDNAs are vehicles for oncogene amplification. The circular nature of ecDNA affords unique properties, such as mobility and ecDNA-specific replication and segregation behavior. We uncovered fundamental ecDNA properties by tracking ecDNAs in live cells, highlighting uneven and random segregation and ecDNA hubs that drive cargo gene transcription.See related commentary by Henssen, p. 293.This article is highlighted in the In This Issue feature, p. 275.


Figures

Fig. 1 |
Fig. 1 |. Unevenly segregated ecDNA drives intratumoral heterogeneity.
A. Cartoon representation of the pattern of inheritance of chromosomal alterations and ecDNAs. B-C. Representative EGFR/Chr7 FISH on four GBM tumor tissues (B, upper panel) and two neurosphere lines (C, upper panel). The MADs are indicated with the corresponding color in each image. Scale bar, 10 μm. Copy number count of each FISH probe per cell and p values indicating the homogeneity of variances between EGFR and Chr7 were determined by Fligner-Killeen test (lower panel). SM006 = Classical; SM012 = Proneural + Mesenchymal; SM017 = Mesenchymal + Classical; SM018 = Mesenchymal; HF3016 and HF3177 = Proneural. D. Copy number distribution of ecDNA genes (left panel) and linearly amplified genes (middle panel). The MADs indicated at the top of individual group. A p value indicating the homogeneity of variances between ecDNA genes and linearly amplified genes was determined by Fligner-Killeen test. The error bars represent standard error. The median MAD of ecDNA genes was significantly higher than the median MAD of linearly amplified genes. A p value indicating significant differences between two group was determined using a Mann-Whitney U test. The error bars represent standard deviation. E-F. ImmunoFISH experiment on two GBM tumor tissues (E) and two neurosphere lines (F). Scale bar, 10 μm. Green signal indicates EGFR FISH signal. Red signal indicates EGFR protein signal. Correlation between copy number of EGFR (number of EGFR DNA FISH signal foci) and EGFR protein expression (quantified based on signal intensity) per cell and p values were determined by Pearson’s correlation test (lower panel). EGFR protein signals that appears to be derived from the nucleus is in fact cytoplasmic and on the cell surface, but appears nuclear as two-dimensional images were obtained from a three-dimensional cell image. G. Comparison of Pearson’s correlation scores between EGFR-EGFR and EGFR-β-Actin.
Fig. 2 |
Fig. 2 |. CRISPR-based labeling enables live-cell ecDNA tracking.
A. Schematic strategy of the ecTag ecDNA labeling system. B. Representative images of ecTag-transfected cells (upper panel). Scale bar, 10 μm. Proportion of ecTag-targeting cells out of the ecTag-transfected cells (bottom panel). The cells that have Clover signals spread out in the nucleus were counted as ecTag-transfected cells. Cells containing green spots in the nucleus were counted as ecTag-targeting cells. SgRNAs conjugated with 15 PUFBSs were used. (n = 31–110 cells per condition). C. Representative images of FISH validation (red BAC probe) performed on ecTag(green)-transfected HF3016 cells. Scale bar, 10 μm. SgRNAs conjugated with 25 PUFBSs were used. D. Proportion of ecTag and FISH double-positive signals relative to FISH (red) signals was calculated as targeting efficiency (left panel). The error bars represent S.E.M. Targeting efficiency normalized by the average proportion of Dual-FISH signals out of the red-color signals showed in Supplementary Figure 6D. Proportion of ecTag and FISH double-positive signals out of the ecTag (green) signals was calculated as on-target efficiency (right panel). n = 30–38 cells per condition. E. Representative images of FISH validation (red control chromosome probe) performed on control ecTag (Chr7 and MUC4, green)-transfected HF3016 cells. Scale bar, 10 μm. SgRNAs conjugated with 25 PUFBSs were used. Proportion of ecTag signals paired with FISH probe signals out of the FISH signals was calculated as targeting efficiency (right panel). The error bars represent S.E.M. n = 21–22 cells per condition. F. Copy-number distribution of ecTag/DNA FISH signals with a high MAD score in ecDNA-targeting group (green plots) confirmed that the ecTag system recapitulates the distribution pattern of ecDNA uneven segregation observed in oncogene-FISH and Dual-FISH. n = 21–38 cells per condition.
Fig. 3 |
Fig. 3 |. Spatiotemporal tracking of ecDNA shows uneven segregation of ecDNA during mitosis.
A. Captured time-lapse images of ecDNA segregation during mitosis. SgRNAs conjugated with 25 PUFBSs were used. B. Copy number of ecDNAs, Chr7, and MUC4 segregated into two daughter cells. (n > 20 dividing cells per each condition). We counted the number of ecDNAs when each daughter cell had the highest number of signal foci. Randomness of ecDNA segregation was determined by Pearson’s correlation test and the p value higher than 0.05 indicates the random distribution. C. Representative time-lapse images showing cell division process from interphase to interphase in PC3 cell model. Scale bar = 10 μm. Red triangles indicate the number of ecDNA signal spots determined based on adjusted green signal thresholding. D. Copy number distribution of ecDNAs, Chr7, and MUC4 in HF3016 neurosphere cells on three different days. Individual dots represent copy number counts of single-cells. The MADs are indicated. P values of the difference in copy number variance over time were determined using a Fligner-Killeen test. SgRNAs conjugated with 25 PUFBSs were used. The result is representative of a distribution of > 20 cells per sample. E. Captured time-lapse images of ecDNA hubs. The pair of arrows with the same color on each group showed the process of ecDNA hub formation. SgRNAs conjugated with 25 PUFBSs were used. The dashed circle indicates the nucleolus. (00:00 = Hour:Minute). F. The fraction of the cell population containing ecDNA hubs was counted across 48h and using live-cell imaging. The number of cells containing ecDNA hubs and the total number of observed cells are shown on each bar.
Fig. 4 |
Fig. 4 |. EcDNA bodies enhances transcriptional activity by recruiting RNA polymerase II (RNAPII).
A. Representative images of RNAPII immunofluorescent staining. Scale bar, 10 μm (i). Colocalization was defined as two different fluorescent signal foci partially or completely overlapping. Proportion of cells with or without the loci colocalized with RNAPII (ii). Colocalized loci with RNAPII per cell (iii). All value was normalized by each ecTag signal. The values of ecDNAs and MUC4 were compared with Chr7. p values were determined by Mann-Whitney U test. Average values are indicated under each p value. At least 25 single-cell images per group were analyzed. The error bars represent SE. SgRNAs conjugated with 25 PUFBSs were used. B. Correlation between copy number of ecDNA and RNAPII count. Correlation score and p values were determined by Pearson’s correlation test. The positively correlated cases are marked with red star. At least 25 single-cell images per group were analyzed. C. Comparison of ecDNA signal size and colocalization with RNAP2. p values were determined by Mann-Whitney U test. The same images used in A were analyzed. D. Representative images of EGFR RNA FISH on ecTag-labeled cells with small ecDNA signals (left panel) and large ecDNA signals (right panel), Scale bar, 10 μm. SgRNAs conjugated with 25 PUFBSs were used. Correlation between ecDNA signal size and EGFR gene expression (right panel). EGFR gene expression was quantified based on signal intensity. The scatter plot and Pearson’s correlation score showed a positive correlation. The bar plots represent average EGFR gene expression in cells with large ecEGFR signal size and small ecEGFR signal size. The unit of signal size is μm. (median signal size = 2.412 μm, large size ≥ 2.412 μm, small size < 2.412 μm). 49 single-cell images were analyzed.

Comment in

References

    1. Gillies RJ, Verduzco D, Gatenby RA. Evolutionary dynamics of carcinogenesis and why targeted therapy does not work. Nature Reviews Cancer 2012;12(7):487–93. - PMC - PubMed
    1. Andor N, Graham TA, Jansen M, Xia LC, Aktipis CA, Petritsch C, et al. Pan-cancer analysis of the extent and consequences of intratumor heterogeneity. Nature medicine 2016;22(1):105. - PMC - PubMed
    1. Amirouchene-Angelozzi N, Swanton C, Bardelli A. Tumor Evolution as a Therapeutic Target. Cancer discovery 2017;7:805–817 doi 10.1158/2159-8290.cd-17-0343. - DOI - PubMed
    1. Li Y, Roberts ND, Wala JA, Shapira O, Schumacher SE, Kumar K, et al. Patterns of somatic structural variation in human cancer genomes. Nature 2020;578(7793):112–21 doi 10.1038/s41586-019-1913-9. - DOI - PMC - PubMed
    1. Turner KM, Deshpande V, Beyter D, Koga T, Rusert J, Lee C, et al. Extrachromosomal oncogene amplification drives tumour evolution and genetic heterogeneity. Nature 2017;543(7643):122–5. - PMC - PubMed

Publication types