. 2021 Nov 30;118(48):e2105138118.
doi: 10.1073/pnas.2105138118.

A traveling-wave solution for bacterial chemotaxis with growth

Affiliations

A traveling-wave solution for bacterial chemotaxis with growth

Avaneesh V Narla et al. Proc Natl Acad Sci U S A. .

Abstract

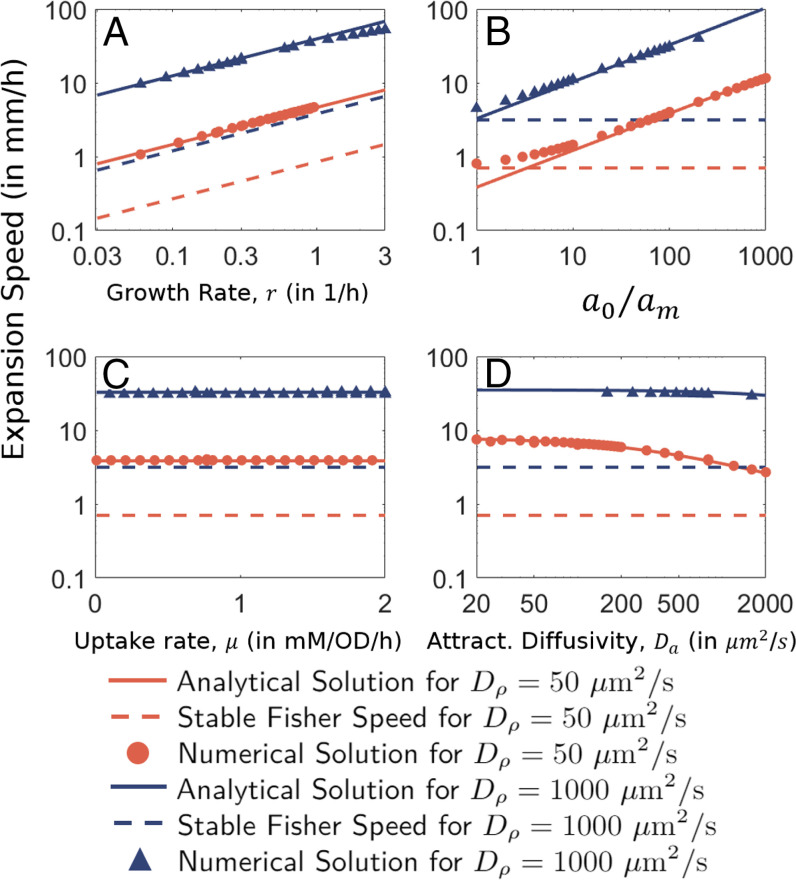
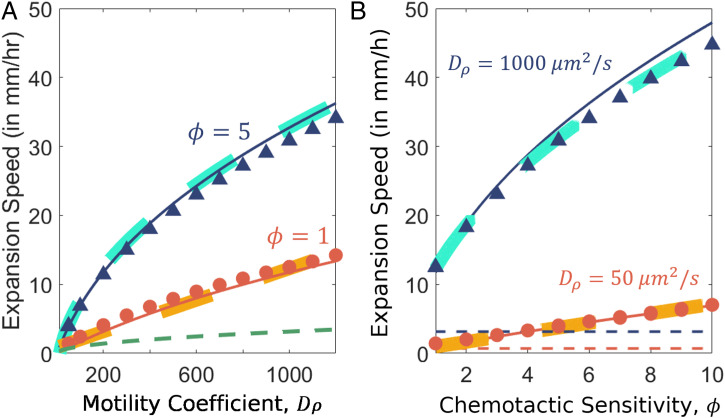
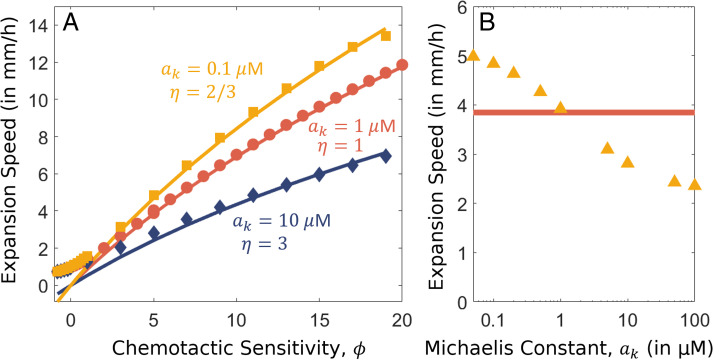
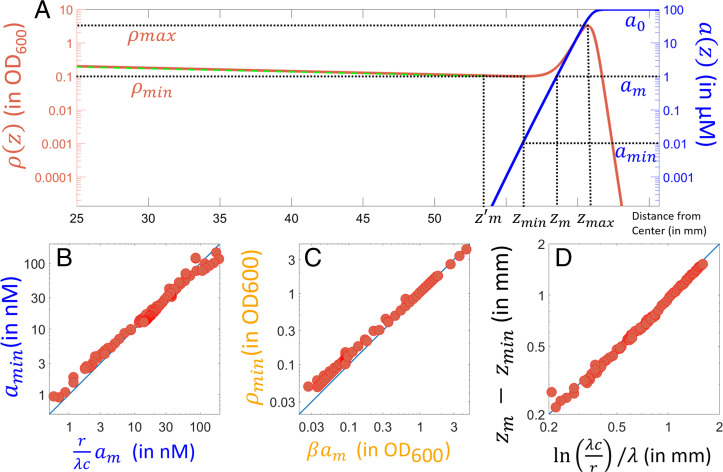
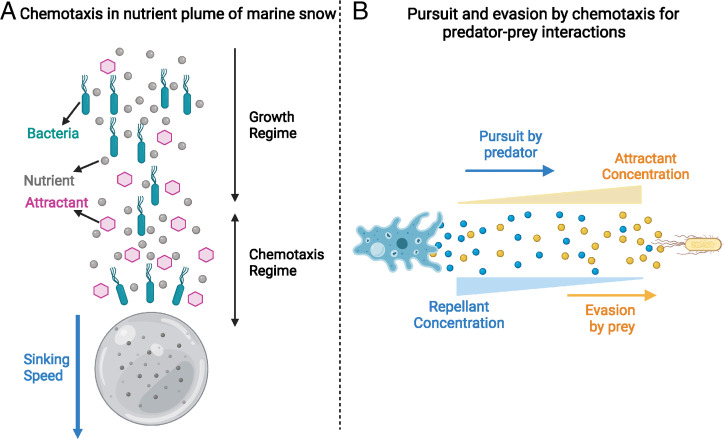
Bacterial cells navigate their environment by directing their movement along chemical gradients. This process, known as chemotaxis, can promote the rapid expansion of bacterial populations into previously unoccupied territories. However, despite numerous experimental and theoretical studies on this classical topic, chemotaxis-driven population expansion is not understood in quantitative terms. Building on recent experimental progress, we here present a detailed analytical study that provides a quantitative understanding of how chemotaxis and cell growth lead to rapid and stable expansion of bacterial populations. We provide analytical relations that accurately describe the dependence of the expansion speed and density profile of the expanding population on important molecular, cellular, and environmental parameters. In particular, expansion speeds can be boosted by orders of magnitude when the environmental availability of chemicals relative to the cellular limits of chemical sensing is high. Analytical understanding of such complex spatiotemporal dynamic processes is rare. Our analytical results and the methods employed to attain them provide a mathematical framework for investigations of the roles of taxis in diverse ecological contexts across broad parameter regimes.

Keywords: Fisher wave; Keller–Segel model; bacterial chemotaxis; front propagation; range expansion.


Conflict of interest statement

The authors declare no competing interest.

Figures

Fig. 1.
Fig. 1.
Profiles of bacterial density (solid red line, in optical density measured at a wavelength of 600 nm [OD600]), drift velocity (dashed green line, in mm/h), and attractant concentration (dotted blue line, in mM) for a steadily expanding population 14.5 h after the inoculation. Arrows indicate the different regimes used in the analytical consideration. Model parameters used are adapted from those determined in ref. and are provided in SI Appendix, Table S1 (this simulation used the low-motility parameters).
Fig. 2.
Fig. 2.
Dependence on (A) growth rate r, (B) uptake rate μ, (C) relative attractant levels a0/am, and (D) attractant diffusion Da. Analytical relation for the expansion speed (Eq. 23) is shown by solid lines (Dρ=50 μm2/s,1,000 μm2/s in red and blue, respectively). The corresponding Fisher speeds, cF=2Dρ·r, are denoted by corresponding dashed lines. Numerical solutions of the GE model (Eqs. 4 and 5) are shown by corresponding symbols. Unless specified, all parameter values are the default values given in SI Appendix, Table S1.
Fig. 3.
Fig. 3.
Dependence of expansion speed on motility parameters. (A) Dependence on cellular motility Dρ. Numerical solutions for ϕ=1 and ϕ=5 are shown by red circles and dark blue triangles, respectively. Analytical solutions following Eq. 23 are shown by corresponding solid red and blue lines. The green dashed line represents the stable Fisher speed, cF=2Dρr, the minimum expansion speed of our system. (B) Dependence on the chemotactic sensitivity, ϕ. Numerical solutions for Dρ=50 μm2/s and Dρ=1,000 μm2/s are shown by red and dark blue circles, respectively. Analytic solutions following Eq. 23 are shown by the corresponding solid lines. Thick yellow and cyan dashed lines are best fits for the respective values of ϕ and Dρ to demonstrate that cDρϕ for DρϕDa and that cDρϕ if Dρϕ is large compared to Da. Unless specified, all parameter values are the default values given in SI Appendix, Table S1.
Fig. 4.
Fig. 4.
Effect of carrying capacity. (A) Dependence of expansion speed on the ambient attractant concentration when the carrying capacity is finite (ρc=10 OD600). Markers (red circles and blue triangles) indicate numerical values, solid lines indicate analytical predictions as per Eq. 24, and dashed lines indicate analytical predictions with ρc. All results in red are for Dρ=50 μm2/s, and all results in blue are for Dρ=1,000 μm2/s. (B) The ambient attractant concentration resulting in maximum expansion speed a0max is shown depending on the dimensionless parameter μρc/(ram). The analytical solution, Eq. 24, is shown as corresponding solid lines. Dashed lines show the solutions (c) without a limiting carrying capacity (ρc, as shown in Fig. 3). Different symbols in B denote which model parameter was varied from its default value (square if μ, circle if ρc, triangle if r, and diamond if am) for Dρ=50 μm2/s (red) and Dρ=1,000 μm2/s (blue). For details, refer to SI Appendix, Supplemental Methods, and to SI Appendix, Table S2, for range of values used for each parameter. Parameters have the default values from SI Appendix, Table S1, unless specified.
Fig. 5.
Fig. 5.
Effect of varying Michaelis constant, ak. (A) Dependence of expansion speed on the chemotactic sensitivity, ϕ, for different values of ak and Dρ=50 μm2/s. Solid lines indicate analytical solutions for corresponding best fit values of η, and markers denote the numerical solutions. Results for ak=0.1 μM,1 μM, and 10 μM are shown in yellow, red, and blue, respectively. (B) Dependence of the expansion speed on model parameter ak. The numerical solutions obtained for Dρ=50 μm2/s,ϕ=5 are represented by yellow triangles, and the analytic solution found in Eq. 21 for ak=am=103 mM is shown by the red line. Parameters have the default values from SI Appendix, Table S1, unless specified.
Fig. 6.
Fig. 6.
Transition from the chemotaxis to the growth regime. (A) Steady expansion profiles of ρ(z) (solid red line) and a(z) (solid blue line) for the standard parameters (SI Appendix, Table S1; Dρ=50 μm2/s,χ0=300μm2/s). The profile of ρ(z) as predicted by the ansatz Eq. 7 is shown using the dashed green line. Dashed horizontal lines indicate distinct values of a and ρ as indicated. (BD) Numerically obtained values of a(zmin), ρ(zmin), and zmzmin for a broad variation of parameters. Seven model parameters in Eqs. 4 and 5 (other than ρc, which was >1, 000 OD600 for all results here) were varied across many decades (see SI Appendix, Supplemental Methods, for details of what was done and SI Appendix, Table S3, for the range of values investigated). Blue lines show y = x to demonstrate agreement with the predicted values of a(zmin),ρ(zmin), and zmzmin.
Fig. 7.
Fig. 7.
Schematic of the dynamics of the transition between chemotaxis and growth regimes. (A) In a short time δt, the density bulge shown near x0 (dotted red line) moves forward to be near x0+cδt (solid red line). In that time, the density bulge grows by an amount rN0δt and is diminished by leakage given by an amount J0δt. During steady expansion, these values match the expressions given by our ansatz (Eqs. 7 and 37). The leaked cells are deposited behind the density bulge where the bacterial density is roughly constant for a distance δx. Thus, ρ(x0,t0+δt)ρmin, and the total deposition over time δt, given by δN0, is also equal to J0δt. (B) After a long time Δt, the density bulge moves to be near a position x0+cΔt (dashed red line). Cells behind the density bulge grow at a rate r, and the density thus accumulates as ρ(x0,t)=ρminexp(rΔt).
Fig. 8.
Fig. 8.
Illustrations of possible extensions of our analysis. (A) Chemotaxis in marine bacteria in the plume of sinking marine particles. The gray bead is the sinking particulate organic matter. A flux of nutrients (gray circles) and attractants (pink hexagons) diffuse into the wake of the particle. The cyan motile bacteria are able to direct their motion up the attractant gradient and thus move toward the sinking particle and keep up with it. (B) Chemotaxis in pursuit–evasion dynamics in a predator–prey system. A predator (shown as a blue amoeba) may pursue gradients of chemicals (attractant; yellow beads) left by a motile prey (a yellow bacterial cell). The motile prey may, in turn, evade the predator by performing chemotaxis and moving away from chemicals (repellent; blue beads) secreted by the predator.

References

    1. Sourjik V., Wingreen N. S., Responding to chemical gradients: Bacterial chemotaxis. Curr. Opin. Cell Biol. 24, 262–268 (2012). - PMC - PubMed
    1. Stocker R., Marine microbes see a sea of gradients. Science 338, 628–633 (2012). - PubMed
    1. Berg H. C., “Chemotaxis” in Quantitative Biology: From Molecular to Cellular Systems, Wall M. E., Ed. (Taylor and Francis, 2013), pp. 341–364.
    1. Wong-Ng J., Celani A., Vergassola M., Exploring the function of bacterial chemotaxis. Curr. Opin. Microbiol. 45, 16–21 (2018). - PubMed
    1. Waite A. J., Frankel N. W., Emonet T., Behavioral variability and phenotypic diversity in bacterial chemotaxis. Annu. Rev. Biophys. 47, 595–616 (2018). - PMC - PubMed

Publication types