. 2021 Nov 30;44(11):843-850.
doi: 10.14348/molcells.2021.0169.

Q-omics: Smart Software for Assisting Oncology and Cancer Research

Affiliations

Q-omics: Smart Software for Assisting Oncology and Cancer Research

Jieun Lee et al. Mol Cells. .

Abstract

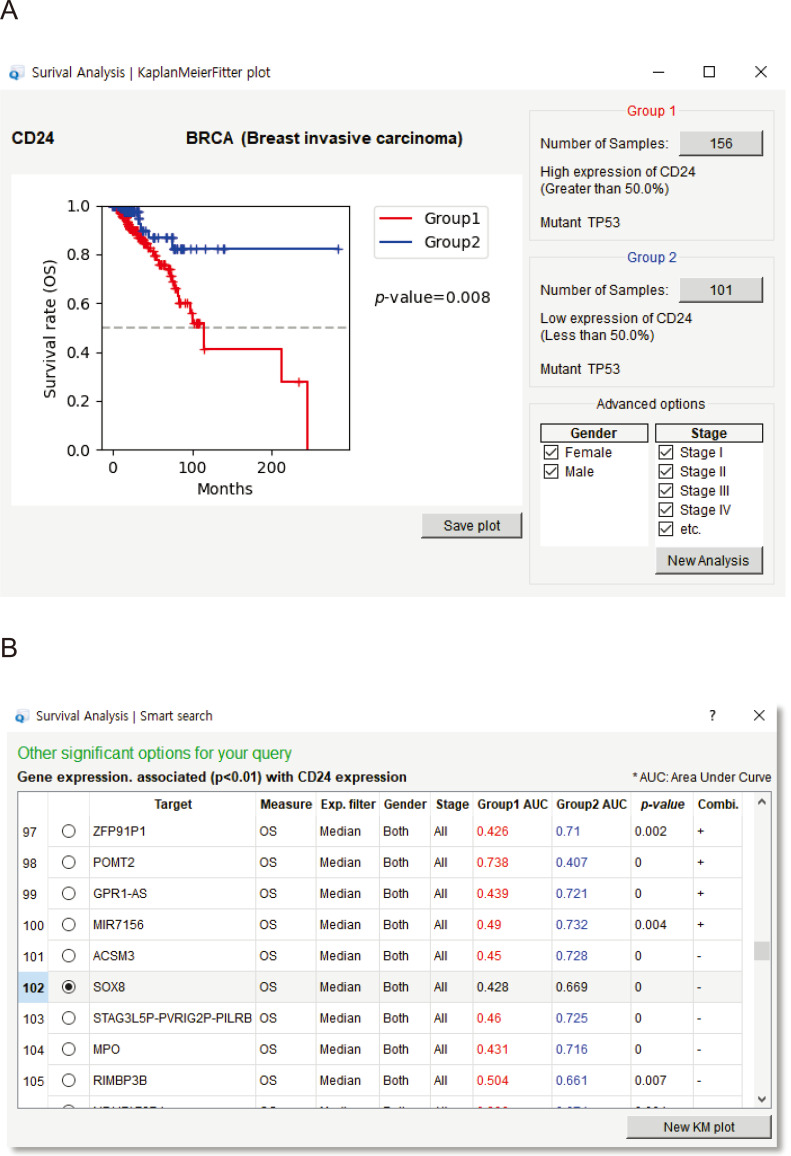
The rapid increase in collateral omics and phenotypic data has enabled data-driven studies for the fast discovery of cancer targets and biomarkers. Thus, it is necessary to develop convenient tools for general oncologists and cancer scientists to carry out customized data mining without computational expertise. For this purpose, we developed innovative software that enables user-driven analyses assisted by knowledge-based smart systems. Publicly available data on mutations, gene expression, patient survival, immune score, drug screening and RNAi screening were integrated from the TCGA, GDSC, CCLE, NCI, and DepMap databases. The optimal selection of samples and other filtering options were guided by the smart function of the software for data mining and visualization on Kaplan-Meier plots, box plots and scatter plots of publication quality. We implemented unique algorithms for both data mining and visualization, thus simplifying and accelerating user-driven discovery activities on large multiomics datasets. The present Q-omics software program (v0.95) is available at http://qomics.sookmyung.ac.kr.

Keywords: Kaplan-Meier plot; biomarker; cancer bioinformatics; immune infiltrate; omics data mining; smart software.


Conflict of interest statement

CONFLICT OF INTEREST

The authors have no potential conflicts of interest to disclose.

Figures

Fig. 1
Fig. 1. Overview of data integration in Q-omics software.
Public datasets from the TCGA, GDSC, CCLE, NCI and DepMap were integrated for the cross-association analysis (blue arrow) of between any two datasets.
Fig. 2
Fig. 2. Software workflow and user interface.
(A) The workflow of functional modules and databases between the local software and server-side knowledge base in Q-omics. (B) Main interface of Q-omics software. Search options are separated into “Browse smart data” and “Query-oriented analysis”. “Ouick start examples” are comprehensive options for first-time users. Knowledge-based smart search is enabled for all of the search options.
Fig. 3
Fig. 3. Graphical interface of patient survival analysis and related smart search results.
(A) The panel of survival analyses included Kaplan–Meier (KM) plots, sample group information and advanced options for plotting. (B) The panel of gene lists retrieved by the smart algorithm from the server-side knowledge base. In this example, the list shows genes that are significantly (P < 0.01) associated with the user’s query in the KM plot.
Fig. 4
Fig. 4. Graphical interface of cross-association analysis between datasets using cell lines.
(A) The panel of cross-associations displaying the predictivity and descriptivity scores of all data points. The list on the right side shows hits with significant P values. (B and C) Box plot and scatter plot of a selected hit from the cross-association panel. Box plots and scatter plots are also available for patient sample analyses.

References

    1. Aran D., Hu Z., Butte A.J. xCell: digitally portraying the tissue cellular heterogeneity landscape. Genome Biol. 2017;18:220. doi: 10.1186/s13059-017-1349-1. - DOI - PMC - PubMed
    1. Barretina J., Caponigro G., Stransky N., Venkatesan K., Margolin A.A., Kim S., Wilson C.J., Lehar J., Kryukov G.V., Sonkin D., et al. The Cancer Cell Line Encyclopedia enables predictive modelling of anticancer drug sensitivity. Nature. 2012;483:603–607. doi: 10.1038/nature11003. - DOI - PMC - PubMed
    1. Biswas A., Haldane A., Arnold E., Levy R.M. Epistasis and entrenchment of drug resistance in HIV-1 subtype B. Elife. 2019;8:e50524. doi: 10.7554/eLife.50524. - DOI - PMC - PubMed
    1. Cancer Genome Atlas Research Network , Weinstein J.N., Collisson E.A., Mills G.B., Shaw K.R., Ozenberger B.A., Ellrott K., Shmulevich I., Sander C., Stuart J.M. The Cancer Genome Atlas Pan-Cancer analysis project. Nat. Genet. 2013;45:1113–1120. doi: 10.1038/ng.2764. - DOI - PMC - PubMed
    1. Cao R., Yuan L., Ma B., Wang G., Qiu W., Tian Y. An EMT-related gene signature for the prognosis of human bladder cancer. J. Cell. Mol. Med. 2020;24:605–617. doi: 10.1111/jcmm.14767. - DOI - PMC - PubMed