. 2021 Nov 24;12(1):6826.
doi: 10.1038/s41467-021-27069-y.

Listeria monocytogenes faecal carriage is common and depends on the gut microbiota

Affiliations

Listeria monocytogenes faecal carriage is common and depends on the gut microbiota

Lukas Hafner et al. Nat Commun. .

Abstract

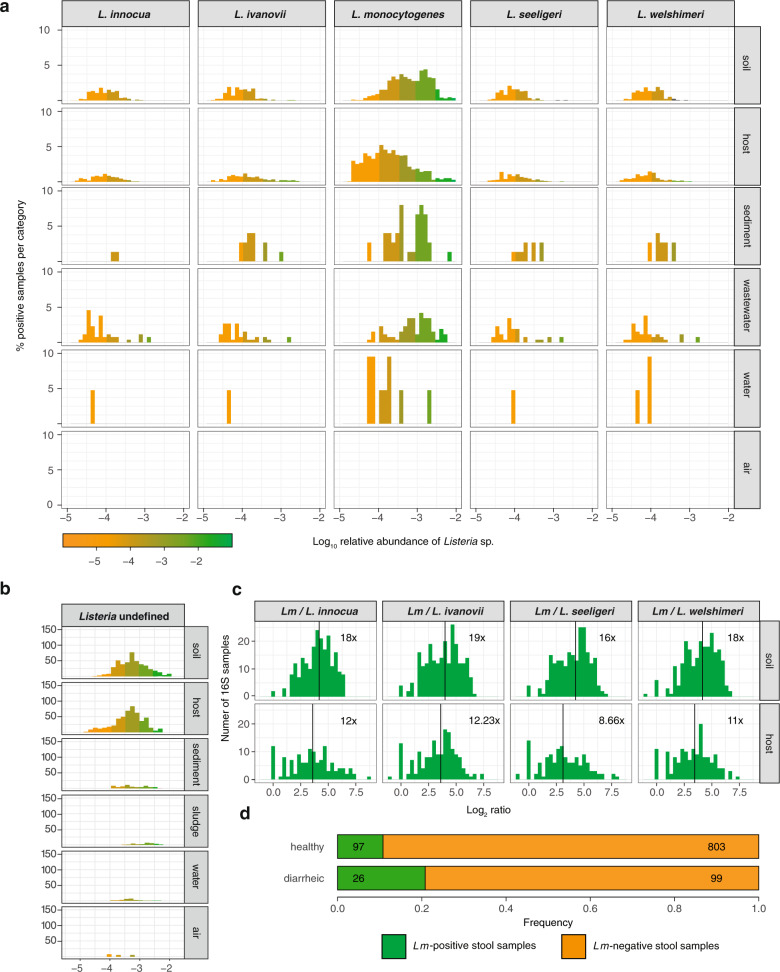
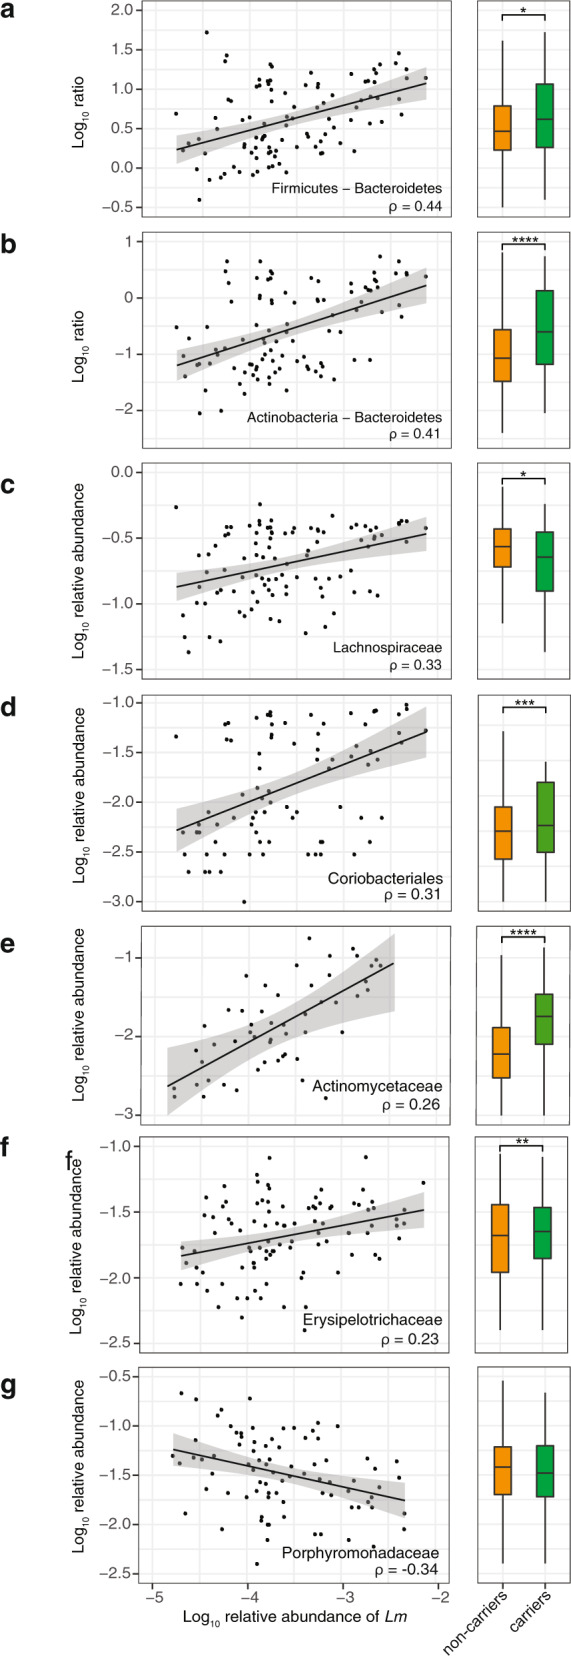
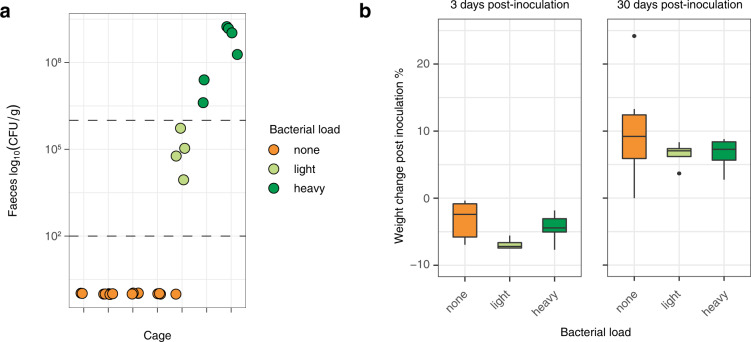
Listeria genus comprises two pathogenic species, L. monocytogenes (Lm) and L. ivanovii, and non-pathogenic species. All can thrive as saprophytes, whereas only pathogenic species cause systemic infections. Identifying Listeria species' respective biotopes is critical to understand the ecological contribution of Listeria virulence. In order to investigate the prevalence and abundance of Listeria species in various sources, we retrieved and analyzed 16S rRNA datasets from MG-RAST metagenomic database. 26% of datasets contain Listeria sensu stricto sequences, and Lm is the most prevalent species, most abundant in soil and host-associated environments, including 5% of human stools. Lm is also detected in 10% of human stool samples from an independent cohort of 900 healthy asymptomatic donors. A specific microbiota signature is associated with Lm faecal carriage, both in humans and experimentally inoculated mice, in which it precedes Lm faecal carriage. These results indicate that Lm faecal carriage is common and depends on the gut microbiota, and suggest that Lm faecal carriage is a crucial yet overlooked consequence of its virulence.


Conflict of interest statement

The authors declare no competing interests.

Figures

Fig. 1
Fig. 1. Lm is more prevalent in host-associated environments than non-pathogenic Listeria species.
Relative abundance and prevalence of Listeria sensu stricto species in 16S rRNA gene datasets in a different environments, b in selected host datasets (i.e. farm animals and/or known Lm reservoirs which were present >100x in our datasets) for which metadata detailing the host species were available and c from different sampling sites of healthy human hosts for which detailed metadata on body sampling site were available. Numbers on the right indicate samples per category.
Fig. 2
Fig. 2. Lm is more abundant than other Listeria species in all environments and Lm carriage is common in healthy individuals.
a Same as Fig. 1a, normalised by category. b Relative abundance and prevalence of Listeria undefined in 16S rRNA gene datasets in different environments. c Log2 of ratio of Lm to each other evaluated Listeria species in samples where the species co-occurred. Vertical lines and numbers indicate the mean of the distribution. d Prevalence of Lm in human faecal samples from healthy (n = 900) and diarrhoeic donors (n = 125) from France.
Fig. 3
Fig. 3. Lm faecal carriage correlates with a specific microbiota signature in humans.
All significant correlations with more than 75 associated samples and rho >0.2 or < −0.2 between Lm and commensal relative abundance in 108 healthy carrier (left panels) and comparison between carriers and non-carriers (nnon-carriers = 2130) for the same groups (right panels). The lines in the left panels corresponds to linear regression models and the grey area to their 95% confidence interval: a The ratio of Firmicutes to Bacteroidetes phyla (rho = 0.44, p = 2.75 × 10−5; non-carriers vs. carriers: 0.019; note that Lm species was excluded when the relative abundance of Firmicutes was calculated), b The ratio of Actinobacteria to Bacteroidetes (rho = 0.414, P = 6.1 × 10−5; non-carriers vs. carriers: P = 9 × 10−15), c Lachnospiraceae (rho = 0.326, P = 1.25 × 10−3; non-carriers vs. carriers: P = 0.026), d Coriobacteriales (rho = 0.314, P = 4.01 × 10−2; non-carriers vs. carriers: P =  0.000459), e Actinomycetaceae (rho = 0.265, P = 7.18 × 10−11; non-carriers vs. carriers: P = 3.093 × 10−48), f Erysipelotrichaceae (rho = 0.226, P = 4.51 × 10−2; non-carriers vs. carriers: P = 0.000361), g Porphyromonadaceae (rho = −0.337, P = 4.28 × 10−3; non-carriers vs. carriers: P = 0.215). The rho values are Spearman correlation coefficients. Statistical comparison between carriers and non-carriers were performed with two-sided Wilcoxon rank-sum test with Benjamini–Hochberg correction for multiple test. * P < 0.05, ** P < 0.01, *** P < 0.001, **** P < 0.0001. For boxplots, the hinges represent the first and third quartile of the distribution. The whiskers extend from the hinge to the largest or smallest value no further than 1.5 x IQR from the respective hinge (where IQR is the inter-quartile range or distance between the first and third quartiles).
Fig. 4
Fig. 4. Lm faecal carriage correlates with low α-diversity in humans.
α-diversity, measured by ENS between carriers and non-carriers (ncarriers = 108, nnoncarriers = 2130, P < 10−15). Statistical comparison was performed with a two-sided Wilcoxon rank-sum test. For boxplots, the hinges represent the first and third quartile of the distribution. The whiskers extend from the hinge to the largest or smallest value no further than 1.5 x IQR from the respective hinge (where IQR is the inter-quartile range or distance between the first and third quartiles). Points beyond this limit are shown.
Fig. 5
Fig. 5. Lm faecal carriage in mice is cage-dependent.
a CFU/g of the stool of male mice 30 days after an iv challenge with Lm at 5 × 103 CFU from different cages (2–6 mice per cage). Colour indicates carriage group (<100 CFU/g: none, 100–106 CFU/g: light, >106 CFU/g: heavy). Horizontal lines indicate the threshold between the groups. b Body weight change of mice after inoculation at 3 days post-inoculation and 30 days post-inoculation according to their carriage group (nnone = 16, nlow = 4, nhigh = 6; 3 dpi: none vs. heavy P = 0.37, low vs. heavy P = 0.11; 30 dpi: none vs. heavy P = 0.37, low vs. heavy P = 0.91). The statistical comparison was performed with a two-sided Wilcoxon rank-sum test. For boxplots, the hinges represent the first and third quartile of the distribution. The whiskers extend from the hinge to the largest or smallest value no further than 1.5 x IQR from the respective hinge (where IQR is the inter-quartile range or distance between the first and third quartiles). Points beyond this limit are shown.
Fig. 6
Fig. 6. Lm faecal carriage correlates with a specific microbiota signature in mice.
a Carriage groups differ in α-diversity, measured by observed species (left), abundance-based coverage estimate (middle) and Shannon index (right), (Observed: none vs. heavy: P = 0.00017, light vs. heavy: P = 0.014, ACE: none vs. heavy: P = 0.00026, light vs. heavy: P = 0.0095, Shannon: none vs. heavy: P = 0.0001, light vs. heavy: P = 0.0095). b β-diversity of mice microbiomes using MDS and Bray–Curtis distance. The colour indicates the carriage group (<100 CFU/g: none, 100–106 CFU/g: light, >106 CFU/g: heavy). All groups differed in composition (PERMANOVA overall P = 0.001, heavy/none P = 0.006, heavy/light P = 0.0075, light/none P = 0.031, with Benjamini–Hochberg correction). Light carriers were more homogeneous than other groups (permutation test for homogeneity of multivariate dispersion, heavy/none, P = 0.246, heavy/light P = 0.0160, light/none P = 0.0193, with Benjamini–Hochberg correction) c Microbiota composition of mice from Fig. 2c at phyla level and d family level within the Bacteroidetes phylum. Statistical comparison performed with two-sided Wilcoxon rank-sum test. *P < 0.05, **P < 0.01, ***P < 0.001, ****P < 0.0001.
Fig. 7
Fig. 7. Microbiota composition in mice differs according to Lm faecal carriage.
a Count of all OTUs enriched in non-carriers (left) or heavy carriers (right) identified by DESeq2. Opaque bars represent significantly different OTUs (after Benjamini–Hochberg correction). b Mean abundance and fold change of all OTUs between carrier and noncarrier mice determined by DESeq2. Opaque points significantly differ between the two groups (P after Benjamini–Hochberg correction). c Relative abundance of Porphyromonadaceae in 16S rRNA data from mice from different carriage groups (nnone = 16, nlow  = 4, nheavy = 6, none vs. heavy: P = 0.0001, light vs. heavy: P = 0.0095). The statistical comparison was performed with a two-sided Wilcoxon rank-sum test. **P < 0.01, ***P < 0.001.
Fig. 8
Fig. 8. Lm faecal carriage depends on the microbiota.
a Comparison of microbiota pre-inoculation and 30-days post-inoculation. β-diversity of mice microbiomes using MDS and Bray–Curtis distance. The colour indicates the carriage group (<100 CFU/g: none, >106 CFU/g: heavy), the shape of the timepoint (round: Pre-inoculation, square: 30-days post-inoculation) and opacity of the treatment (plain: untreated or PBS-treated, striped: antibiotic treated) b Distribution of fold change determined by DESeq2 of OTUs between heavy and non-carriers (top) and pre- and post-infection (bottom). Dark bars indicate significantly differently present OTUs identified by DESeq2 (P < 0.05 after Benjamini–Hochberg correction). The dashed bar indicates the median of the respective distribution. c Comparison of α-diversity, measured by observed species (left), abundance-based coverage estimates (middle) and Shannon index (right) between antibiotic- and PBS-treated mice 4 weeks after antibiotic treatment/before inoculation and 4 weeks after Lm inoculation. (nAbx-treated = 7, nPBS-treated = 9, PBS-treated vs. Abx-treated pre-infection P = 0.00017, 30dpi P = 0.00017). d Body weight change of mice at 3 days post-inoculation and 30-days post-inoculation according to their treatment group (nPBS-treated = 9, nAbx-treated = 7, PBS-treated vs. Abx-treated 3 dpi: P = 0.76, 30dpi: P = 0.84). e CFU/g of the stool of female mice 30 days after an iv challenge with Lm at 5 × 103 CFU. Mice were either treated with antibiotics or PBS 4 weeks prior to inoculation. Statistical comparison performed with two-sided Wilcoxon rank-sum test (PBS-treated vs. Abx-treated: P = 0.0013). The statistical comparison was performed with a two-sided Wilcoxon rank-sum test. For boxplots, the hinges represent the first and third quartile of the distribution. The whiskers extend from the hinge to the largest or smallest value no further than 1.5 x IQR from the respective hinge (where IQR is the inter-quartile range or distance between the first and third quartiles). Points beyond this limit are shown.

References

    1. Ruhl CR, et al. Mycobacterium tuberculosis Sulfolipid-1 activates nociceptive neurons and induces cough. Cell. 2020;181:293–305. - PMC - PubMed
    1. Charlier C, et al. Clinical features and prognostic factors of listeriosis: the MONALISA national prospective cohort study. Lancet Infect. Dis. 2017;17:510–519. - PubMed
    1. Dreyer, M. et al. Listeria monocytogenes sequence type 1 is predominant in ruminant rhombencephalitis. Sci. Rep. 6, 36419 (2016). - PMC - PubMed
    1. Toledo-Arana A, et al. The Listeria transcriptional landscape from saprophytism to virulence. Nature. 2009;459:950–956. - PubMed
    1. Moura A, et al. Whole genome-based population biology and epidemiological surveillance of Listeria monocytogenes. Nat. Microbiol. 2016;2:1–10. - PMC - PubMed

Publication types

MeSH terms