. 2021 Nov 24;12(1):6813.
doi: 10.1038/s41467-021-27057-2.

ATR inhibition enables complete tumour regression in ALK-driven NB mouse models

Affiliations

ATR inhibition enables complete tumour regression in ALK-driven NB mouse models

Joanna Szydzik et al. Nat Commun. .

Abstract

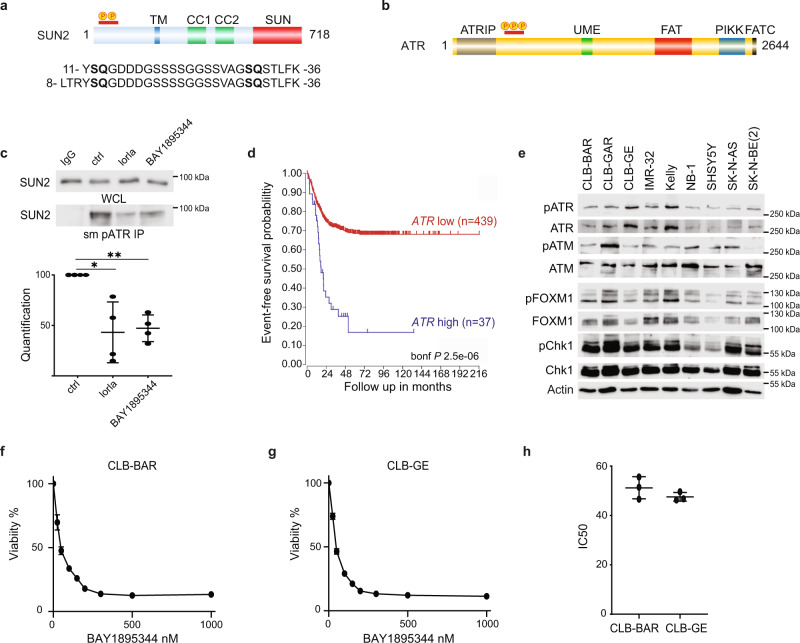
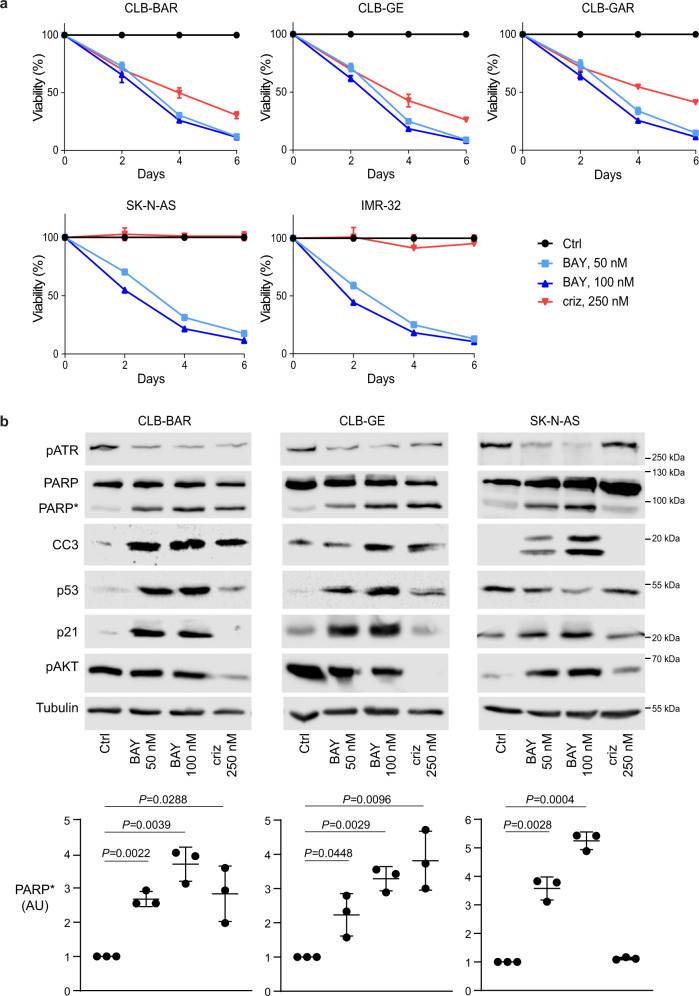
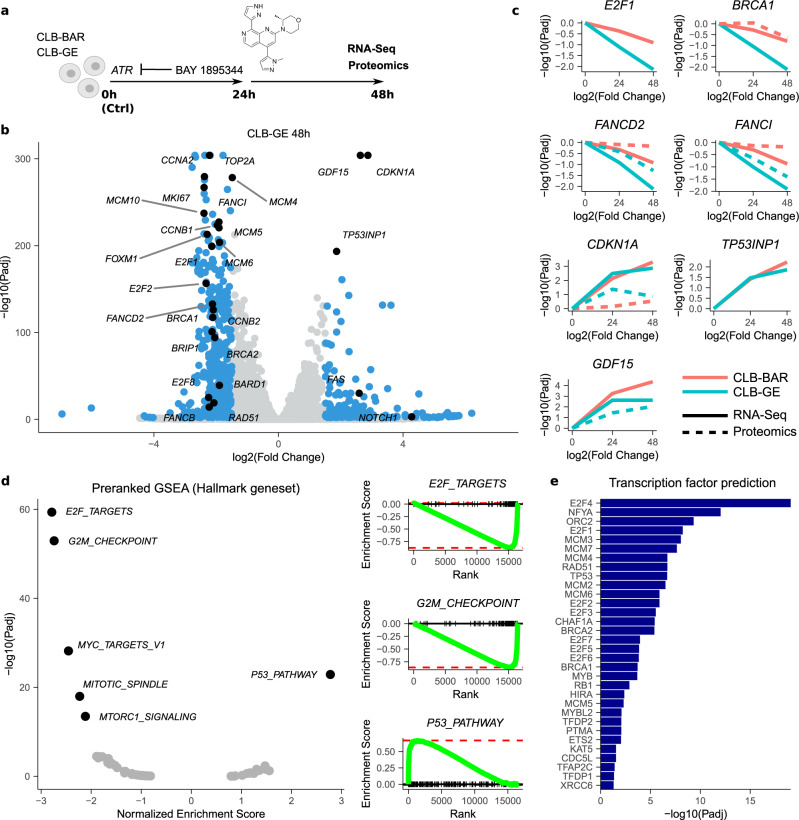
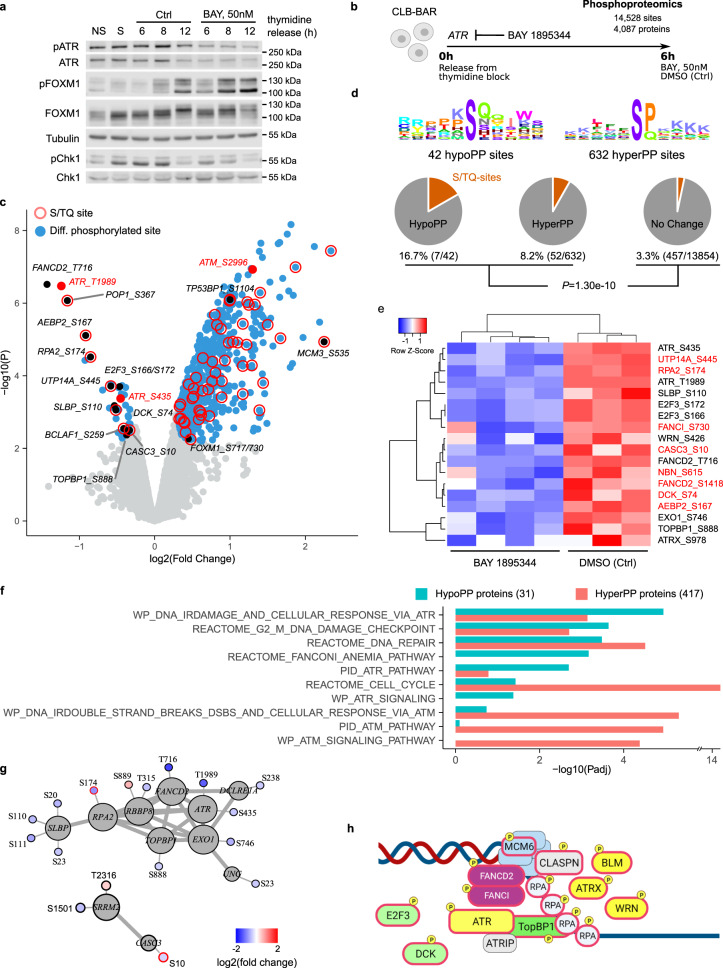
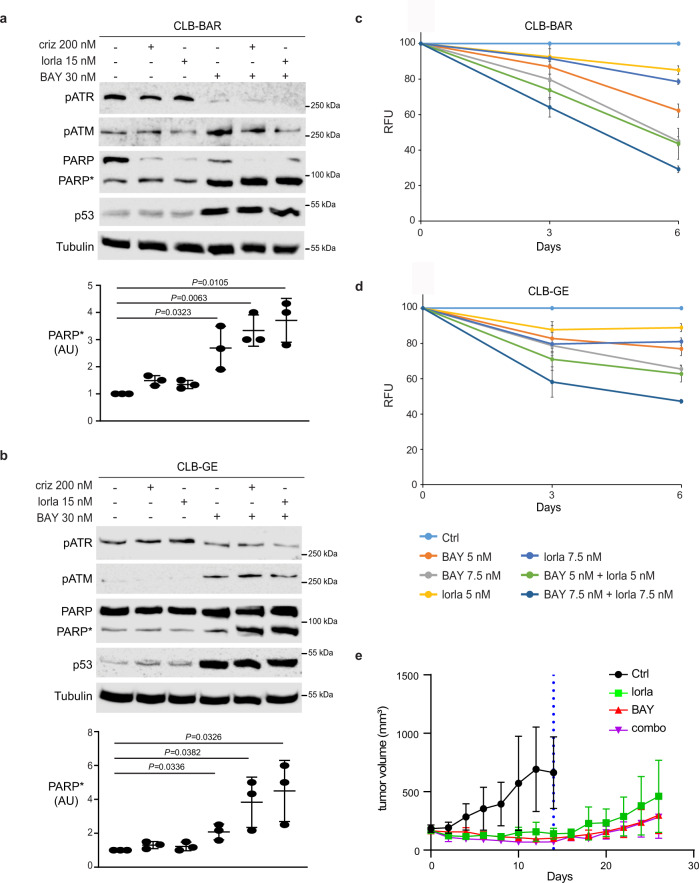
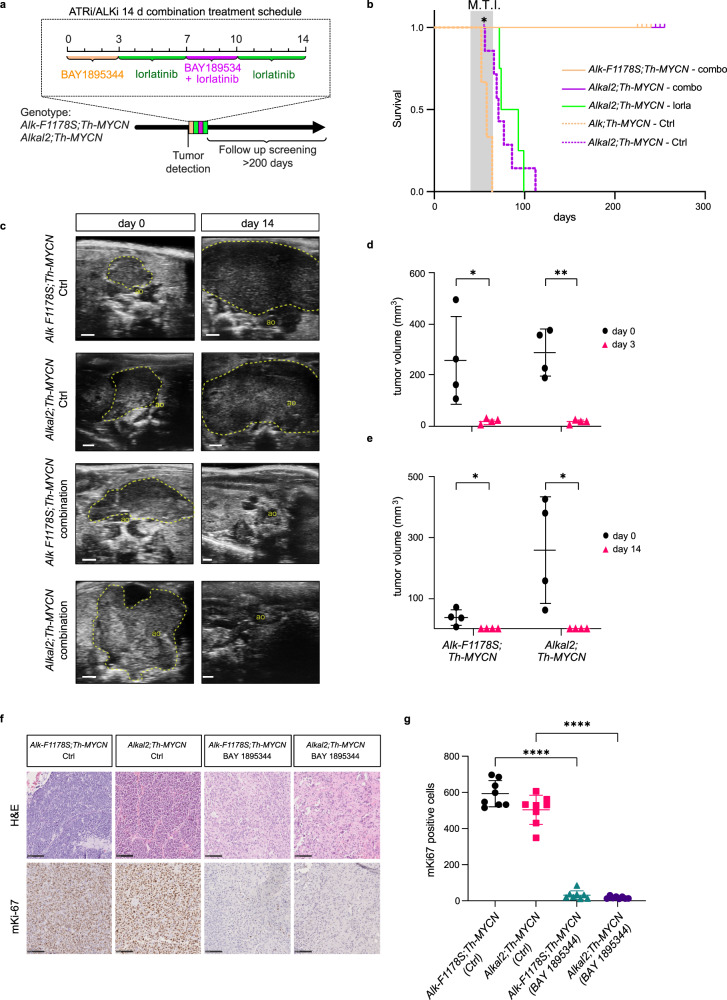
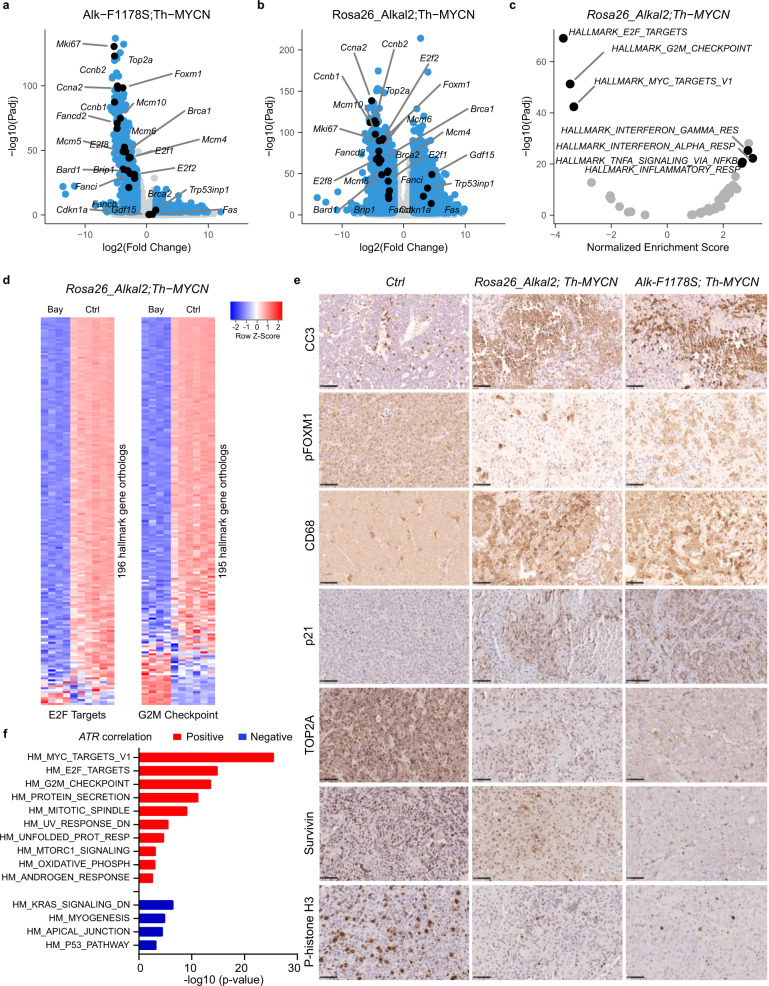
High-risk neuroblastoma (NB) often involves MYCN amplification as well as mutations in ALK. Currently, high-risk NB presents significant clinical challenges, and additional therapeutic options are needed. Oncogenes like MYCN and ALK result in increased replication stress in cancer cells, offering therapeutically exploitable options. We have pursued phosphoproteomic analyses highlighting ATR activity in ALK-driven NB cells, identifying the BAY1895344 ATR inhibitor as a potent inhibitor of NB cell growth and proliferation. Using RNA-Seq, proteomics and phosphoproteomics we characterize NB cell and tumour responses to ATR inhibition, identifying key components of the DNA damage response as ATR targets in NB cells. ATR inhibition also produces robust responses in mouse models. Remarkably, a 2-week combined ATR/ALK inhibition protocol leads to complete tumor regression in two independent genetically modified mouse NB models. These results suggest that NB patients, particularly in high-risk groups with oncogene-induced replication stress, may benefit from ATR inhibition as therapeutic intervention.


Conflict of interest statement

The authors declare no competing interests.

Figures

Fig. 1
Fig. 1. ATR signalling is required for survival in ALK-driven NB cell lines.
a Graphic representation of SUN2 protein with localisation of the phosphorylation sites regulated by ALK signalling activity. SUN2 contains transmembrane domain (TM, blue), two coiled-coil domains (CC1 and CC2, green) and SUN (red) domains. The amino acid sequence of the two independent phosphopeptides identified by MS/MS is shown below with *SQ ATR phosphorylation motifs highlighted in bold. b Graphic representation of ATR protein structure with localisation of phosphorylation sites (S435, S436 and S437) regulated by ALK signalling activity. ATR contains HEAT repeats, an ATRIP binding (ATRIP) domain (grey), a nuclear localisation sequence, a UVSB PI3 kinase, MEI-41 and ESR1 (UME) domain (green), a FRAP-ATM-TRRAP (FAT) domain (red), a phosphatidylinositol-3 kinase-related protein kinase (PIKK) domain (blue) and a FRAP-ATM-TRRAP-C-terminal (FATC) domain (black). c Immunoprecipitation using ATR/ATM phospho-substrate motif antibodies in the presence or absence of ALK (lorlatinib) or ATR inhibitors (BAY 1895344) as indicated, followed by immunoblotting for SUN2 (WCL, whole-cell lysate; IP, immunoprecipitation) in CLB-BAR cells. Quantification of pATR immunoprecipitated SUN2 signal to total SUN2 signal is shown below. Data are presented as mean ± SD. n = 4 biologically independent experiments. *p = 0.032; **p = 0.0054, Student’s paired t-test, two-tailed distribution. d Kaplan-Meier event-free survival curves of 476 patients with NB from the Kocak cohort stratified according to ATR expression (https://r2.amc.nl). Patients with higher expression are highlighted in blue, whereas patients with lower expression are highlighted in red (p Bonferroni-corrected = 2.5 × 10−6). e Immunoblotting of whole-cell lysates from nine NB cell lines (CLB-BAR, CLB-GAR, CLB-GE, IMR-32, Kelly, NB-1, SHSY5Y, SK-N-AS and SK-N-BE(2)) probed with anti-: pATR, ATR, pATM, ATM, pFOXM1, FOXM1, pCHK1, CHK1 and actin antibodies. n = 3 biologically independent experiments. Cell lines are described in detail in Supplementary Table 1. f CLB-BAR cell viability in response to increasing concentrations of BAY 1895344. Data are presented as mean ± SD. n = 3 biologically independent experiments. g CLB-GE cell viability in response to increasing concentrations of BAY 1895344. Data are presented as mean ± SD. n = 3 biologically independent experiments. h IC50 values for CLB-BAR (51.24 ± 3.66 nM) and CLB-GE (47.57 ± 1.44 nM) cell lines calculated for BAY 1895344 from (f) and (g). Data are presented as mean ± SD. Source data are provided as a Source Data file.
Fig. 2
Fig. 2. Effect of BAY 1895344 on NB cells.
a Viability of NB cells treated with either 250 nM crizotinib (criz), 50 or 100 nM BAY 1895344 (BAY) as indicated. NB cell viability was measured after 2, 4 and 6 days for five different cell lines. ALK-addicted cell lines: CLB-BAR, CLB-GE, CLB-GAR; ALK non-addicted cell lines: SK-N-AS and IMR-32 (cell lines described in detail in Supplementary Table 1). b Apoptosis was monitored by immunoblotting for PARP cleavage (PARP*, quantified below), cleaved caspase 3 (CC3), p53, p21 and tubulin (as loading control) in NB cell lines after 24 h treatment with BAY 1895433 (50 or 100 nM). pAKT was employed as readout of ALK inhibition. 250 nM crizotinib was employed as positive control in CLB-BAR and CLB-GE cells. Data are presented as mean ± SEM. n = 3 biologically independent experiments. Student’s paired t-test, p values indicated. Source data are provided as a Source Data file.
Fig. 3
Fig. 3. Transcriptomic and proteomic response to BAY 1895344 treatment of NB cells.
a CLB-BAR and CLB-GE NB cells were treated for 24 or 48 h with 50 nM BAY 1895344 and differential gene and protein expression (DE) with untreated control conditions was determined using RNA-Seq or proteomics. See Supplementary Dataset 1 for the detailed results. b Volcano plot showing RNA-Seq DE response (log2FoldChange ±1.5 at 1% FDR) in CLB-GE cells 48 h post treatment. DE genes indicated in blue with genes discussed in the main text indicated and labelled in black. c Differential gene (full line) and protein (dashed line) expression dynamics after BAY 1895344 treatment for different genes as indicated. Response in CLB-BAR and CLB-GE cells indicated in red and green, respectively. d Preranked Hallmark GSEA results after ranking of genes following the DESeq2 statistic (CLB-GE response 48 h). Left panel shows normalised enrichment scores and corresponding FDR values with labelling of the most enriched gene sets. Right panels represent running score plots for the most enriched gene sets as indicated. e Transcription factor prediction based on a transcription factor target GSEA. GSEA was performed using Fisher’s exact test. Bars represent adjusted p values (−log scale) for enriched transcription factors at 5% FDR. Source data are provided as a Source Data file.
Fig. 4
Fig. 4. Phosphoproteomic response to BAY 1895344 treatment of NB cells.
CLB-BAR NB cells were synchronised by thymidine block and treated with either DMSO (Ctrl) or 50 nM BAY 1895344. a Immunoblotting with anti pATR, ATR, pFOXM1, FOXM1, pCHK1, CHK1 and tubulin antibodies after treatment for 6–12 h as indicated. NS, non-synchronised; S, synchronised. bg Phosphoproteomic analysis. b Differential phosphorylation (DP) upon 6 h BAY 1895344 treatment was determined by comparing the phosphoproteomic response with control (DMSO) conditions. See Supplementary Dataset 1 for the detailed results. c Volcano plot showing DP response. DP sites indicated in blue. ATR and ATM sites indicated and labelled in red. Other sites that are discussed in the main text in black. S/TQ sites indicated by red borders. d Linear motif analysis. Sequence logo plots showing position-specific enrichment ±5 amino acids centred around the phosphorylation site for hypo- and hyperphosphorylated sites as indicated. Pie charts showing the proportion of S/TQ motifs in hypophosphorylated, hyperphosphorylated and non-DP sites. p Value calculated using Fisher’s exact test, comparing S/TQ sites in DP versus non-DP sites. e Heatmap comparing z-score normalised phosphorylation signals between control (DMSO) and BAY 1895344 conditions for hypophosphorylated sites that are discussed in the main text. S/TQ sites labelled in red. f GSEA on 31 proteins with hypophosphorylated sites and 417 proteins with hyperphosphorylated sites. Bar plot showing a selection of Canonical pathways that were enriched at 5% FDR (q < 0.05). See Supplementary Dataset 2 for the detailed results. g STRING network analysis. Subnetworks showing all 1st-degree interacting proteins with hypophosphorylated sites. Log2 (fold change) values labelled by heatscale (key indicated on bottom right). S/TQ sites indicated by red borders. h Schematic highlighting key targets of ATR activity in NB cells. Source data are provided as a Source Data file.
Fig. 5
Fig. 5. BAY 1895344 treatment inhibits growth of NB xenografts.
a, b ALK-positive neuroblastoma cell lines CLB-BAR (a) and CLB-GE (b) were treated with crizotinib (criz), lorlatinib (lorla) or BAY 1895344 (BAY), either alone or in combination, as indicated. Cell lysates were immunoblotted for pATR, pATM, PARP/cleaved PARP (PARP*) and p53. Tubulin was used as a loading control. n = 3 biologically independent experiments. Student’s paired t-test, p values indicated. c, d Resazurin assay-based viability in NB cell lines CLB-BAR (c) and CLB-GE (d) treated with BAY 1895344 or lorlatinib alone or in combination, as indicated. Data are presented as mean ± SEM relative to untreated cells. n = 3 biologically independent experiments. e Female BALB/cAnNRj-Foxn1nu mice were treated with lorlatinib (10 mg/kg twice daily, n = 3), BAY 1895344 (50 mg/kg twice daily; with a 3 day on/4 day off cycle, n = 5) or as combination (n = 3) for 14 days (dotted line). Animals in each treated group were maintained for a further 12 days after treatment ended (14–26 days). Data are presented as mean tumour volumes (mm3) ±SD. One-way ANOVA followed by Sidak´s multiple comparisons test was used to calculate significant differences between groups. p = 0.003 for Ctrl v lorlatinib, p < 0.0001 for Ctrl v BAY 1895344 and Ctrl v combination. Source data are provided as a Source Data file.
Fig. 6
Fig. 6. BAY 1895344 treatment cures Alk/MYCN-driven NB in GEMMs.
a Schematic overview of treatment regimen for Alk/MYCN-driven GEMM tumours, consisting of 25 mg/kg BAY 1895355 for 3 days, followed by 10 mg/kg lorlatinib for 11 days, supplemented with BAY 1895344 at days 8–10, orally. All treatments were given twice daily. b Survival (from birth) in Alk-F1178S;Th-MYCN (tan, n = 4), Rosa26_Alkal2;Th-MYCN (magenta, n = 4) mice compared with mice treated continuously for 30 days with lorlatinib 10 mg/kg b.i.d. from tumour detection (green, n = 4) and Alk-F1178S;Th-MYCN (tan dashed, n = 3), Rosa26_Alkal2;Th-MYCN (magenta dashed, n = 7) that received no treatment. Shadowed areas represent mean tumour incidence (±SD) in the treatment group. n ≥ 4 for each treatment group. *Indicates one Rosa26_Alkal2;Th-MYCN animal that exhibited a complete response sacrificed after treatment. M.T.I., mean tumour incidence. c Representative ultrasound images from Alk-F1178S;Th-MYCN and Rosa26_Alkal2;Th-MYCN animals treated for 14 days with either combination or vehicle control. Abdominal aorta (ao), tumour border (dashed line). Scale bar is 1 mm. d Tumour volume (mm3) change in mice treated 25 mg/kg b.i.d. BAY 1895344 for 3 days. Data are presented as mean ± SD. n = 4 per genotype. *p = 0.0331, **p = 0.0057, one-tailed paired t-test. e Tumour volumes (mm3) at start and end of combination treatment. Data are presented as mean ± SD. n = 4 per genotype, *p = 0.0292 for Alk-F1178S;Th-MYCN, *p = 0.0301 for Rosa26_Alkal2;Th-MYCN, one-tailed paired t-test. f Representative immunohistochemical mKi67 staining for tumours of indicated genotype treated for 3 days with either BAY 1895344 25 mg/kg b.i.d. or vehicle control (scale bar 100 µm), quantified in (g). Data are presented as mean number of Ki67-positive cells ±SD in 8 representative fields of view, n = 4 biologically independent samples, ****p < 0.0001, one-way ANOVA with Sidak corrections for multiple comparisons. Source data are provided as a Source Data file.
Fig. 7
Fig. 7. Transcriptomic response to BAY 1895344 treatment in Alk/MYCN-driven NB in GEMMs.
RNA-Seq-based differential gene expression analysis between NB tumours from untreated control mice and mice treated with BAY 1895344 for 3 days. Two different mice models were used as indicated: Alk-F1178S;Th-MYCN; Rosa26_Alkal2;Th-MYCN (n = 4 treated per genotype, n = 6 controls). a, b Volcano plots with indication of DE genes in blue. DE thresholds are indicated by dashed lines. Orthologs of the genes indicated in Fig. 3b labelled. c Preranked Hallmark GSEA results after ranking of genes following the DESeq2 statistic. Plot shows normalised enrichment scores and corresponding FDR values with labelling of gene sets discussed in the main text. d Heatmap comparing z-score normalised gene expression counts between untreated control and BAY 1895344 treated Rosa26_Alkal2;Th-MYCN tumours for all genes from the Hallmark gene sets E2F Targets and G2M Checkpoints as indicated. Colour key at top right. e Histological examination of Rosa26_Alkal2; Th-MYCN, Alk-F1178S;Th-MYCN in response to BAY 1895344 treatment compared with vehicle control tumours. Staining for cleaved caspase 3 (CC3), pFOXM1, CD68, p21, TOP2A, Survivin and P-histone H3 is shown. Scale bars indicate 50 μm. n = 3 biologically independent samples. f Hallmark GSEA on genes with positive (red bars) or negative (blue bars) expression correlation to ATR gene expression in patient NB samples (correlation Padj < 0.01). Bar plot showing −log10 (p value) of Hallmark gene sets enriched with Padj < 0.01. Analysis and GSEA were performed on Kocak NB_649 tumour dataset (gse45547) using the R2: Genomics Analysis and Visualization Platform. Source data are provided as a Source Data file.

References

    1. Matthay KK, et al. Neuroblastoma. Nat. Rev. Dis. Prim. 2016;2:16078. - PubMed
    1. Ladenstein R, et al. Busulfan and melphalan versus carboplatin, etoposide, and melphalan as high-dose chemotherapy for high-risk neuroblastoma (HR-NBL1/SIOPEN): an international, randomised, multi-arm, open-label, phase 3 trial. Lancet Oncol. 2017;18:500–514. - PubMed
    1. Amoroso L, et al. Topotecan-Vincristine-Doxorubicin in stage 4 high-risk neuroblastoma patients failing to achieve a complete metastatic response to rapid COJEC: a SIOPEN study. Cancer Res. Treat. 2018;50:148–155. - PMC - PubMed
    1. De Brouwer S, et al. Meta-analysis of neuroblastomas reveals a skewed ALK mutation spectrum in tumors with MYCN amplification. Clin. Cancer Res. 2010;16:4353–4362. - PubMed
    1. Grobner SN, et al. The landscape of genomic alterations across childhood cancers. Nature. 2018;555:321–327. - PubMed

Publication types

MeSH terms