. 2021 Nov 24;11(1):22879.
doi: 10.1038/s41598-021-02048-x.

PERG adaptation for detection of retinal ganglion cell dysfunction in glaucoma: a pilot diagnostic accuracy study

Affiliations

PERG adaptation for detection of retinal ganglion cell dysfunction in glaucoma: a pilot diagnostic accuracy study

T Salgarello et al. Sci Rep. .

Abstract

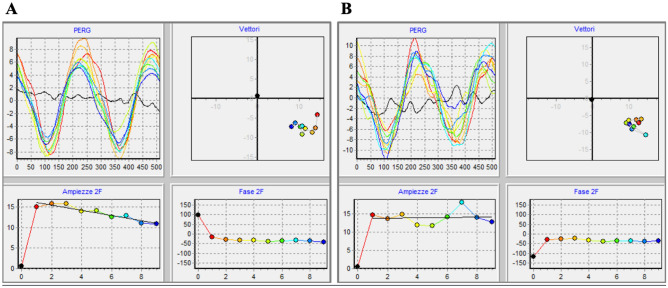
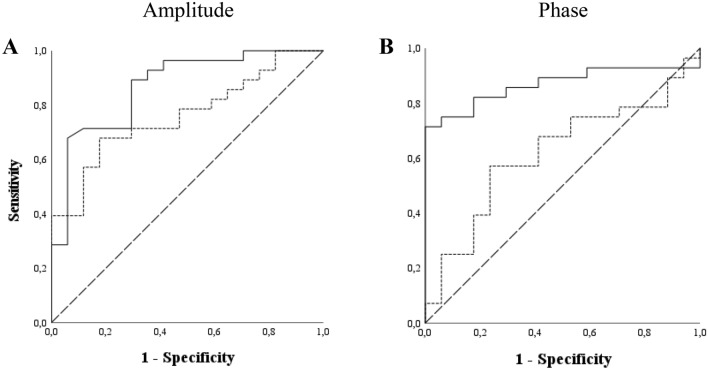
It has been previously demonstrated that the adaptive phase changes of steady-state pattern electroretinogram (SS-PERG), recorded during 4-min presentation of patterned stimuli, are reduced in glaucoma suspects and patients compared to normal subjects. Our study aims at testing the hypothesis that adaptive changes of SS-PERG, recorded using the novel optimized Next Generation PERG (PERGx) protocol, differ between glaucoma patients and controls. In this pilot cross-sectional study, we included 28 glaucoma patients and 17 age-matched normal subjects. Both patients and controls underwent a full ophthalmologic examination, visual field testing, OCT and PERGx. The PERGx signal was sampled over 2 min (providing 1 noise and 9 signal packets) in response to alternating gratings generated on an OLED display. PERGx amplitude and phase were analyzed to quantify adaptive changes over recording time. Receiver operating characteristic (ROC) curves were used to study the diagnostic accuracy of PERGx parameters in distinguishing glaucoma patients from normal subjects. PERGx amplitude and phase data showed declining trends in both groups. PERGx amplitude slope and grand-average vector amplitude and phase were significantly different in patients compared to controls (p < 0.01), whereas phase angular dispersion was greater in patients but not significantly different between the two groups. The area under the ROC curves were 0.87 and 0.76 for PERGx amplitude slope and grand-average vector amplitude, and 0.62 and 0.87 for PERGx angular dispersion and grand-average vector phase, respectively. The PERGx paradigm resulted highly accurate in detecting the reduction of amplitude adaptive changes in glaucoma patients, presumably due to the loss of functional retinal ganglion cell autoregulation. Thus, PERG adaptation, recorded by this new protocol, might be helpful in the identification and diagnosis of early glaucomatous dysfunction.


Conflict of interest statement

The authors declare no competing interests.

Figures

Figure 1
Figure 1
Representative examples of sequential PERGx samples recorded in two random subjects from control group (A top left panel) and patient group (B top left panel). The black waveform represents the noise recorded during an initial 10-s presentation of a grey uniform background, whereas the 9 coloured superimposed waveforms correspond to the responses obtained by high-contrast reversing black-and-white gratings. Data represent successive averages of 60 epochs each (~ 10 s sampling time). Top right graphs show PERGx vector changes over the recording time in the control subject (A top right panel) and the patient (B top right panel), respectively. The bottom graphs display how the PERGx amplitude and phase of successive samples (filled coloured symbols) change over time in the control (A) and in the patient (B), respectively.
Figure 2
Figure 2
Scatter plots of scalar 2P amplitude (A) and phase (B) averaged across all subjects of both control (open circles) and patient (filled circles) groups as a function of packet number. The linear regression (R and p values are shown) applied to the amplitude and phase data shows a steeper decline (i.e. more negative slope) in controls compared with patients.
Figure 3
Figure 3
Box plots show the average, median and 25–75% percentiles of PERGx parameters, with whiskers and cross symbols representing the 5–95% and 1–99% percentiles, respectively. The statistical significance (p-value) of t-test comparisons between group parameters is shown.
Figure 4
Figure 4
Receiver Operating Characteristic (ROC) curve and Area Under the Curve (AUC) calculated for (A) PERGx amplitude slope (solid line; AUC = 0.87) and grand-average vector amplitude (densely dashed line; AUC = 0.76) and for (B) PERGx grand-average vector phase (solid line; AUC = 0.87) and phase angular dispersion (densely dashed line; AUC = 0.62). The dashed diagonal line serves as an imaginary reference line representing a non-discriminatory test.

References

    1. Weinreb RN, Khaw PT. Primary open-angle glaucoma. Lancet. 2004;363:1711–1720. doi: 10.1016/S0140-6736(04)16257-0. - DOI - PubMed
    1. Kolko M. Present and new treatment strategies in the management of glaucoma. Open Ophthalmol. J. 2015;9:89–100. doi: 10.2174/1874364101509010089. - DOI - PMC - PubMed
    1. Porciatti V. Electrophysiological assessment of retinal ganglion cell function. Exp. Eye Res. 2015;141:164–170. doi: 10.1016/j.exer.2015.05.008. - DOI - PMC - PubMed
    1. Porciatti V, Ventura LM. Retinal ganglion cell functional plasticity and optic neuropathy: A comprehensive model. J. Neuro-Ophthalmol. 2012;32:354–358. doi: 10.1097/WNO.0b013e3182745600. - DOI - PMC - PubMed
    1. Quigley HA, Dunkelberger GR, Green WR. Retinal ganglion cell atrophy correlated with automated perimetry in human eyes with glaucoma. Am. J. Ophthalmol. 1989;107:453–464. doi: 10.1016/0002-9394(89)90488-1. - DOI - PubMed