. 2021 Nov 24;11(1):22863.
doi: 10.1038/s41598-021-02197-z.

Diagnostic performance of rapid antigen tests (RATs) for SARS-CoV-2 and their efficacy in monitoring the infectiousness of COVID-19 patients

Affiliations

Diagnostic performance of rapid antigen tests (RATs) for SARS-CoV-2 and their efficacy in monitoring the infectiousness of COVID-19 patients

John G Routsias et al. Sci Rep. .

Abstract

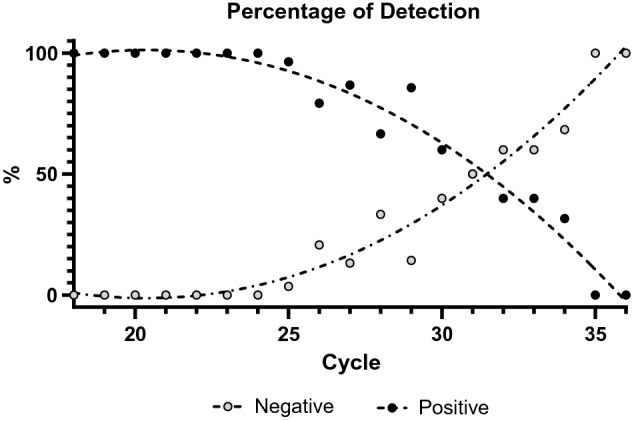
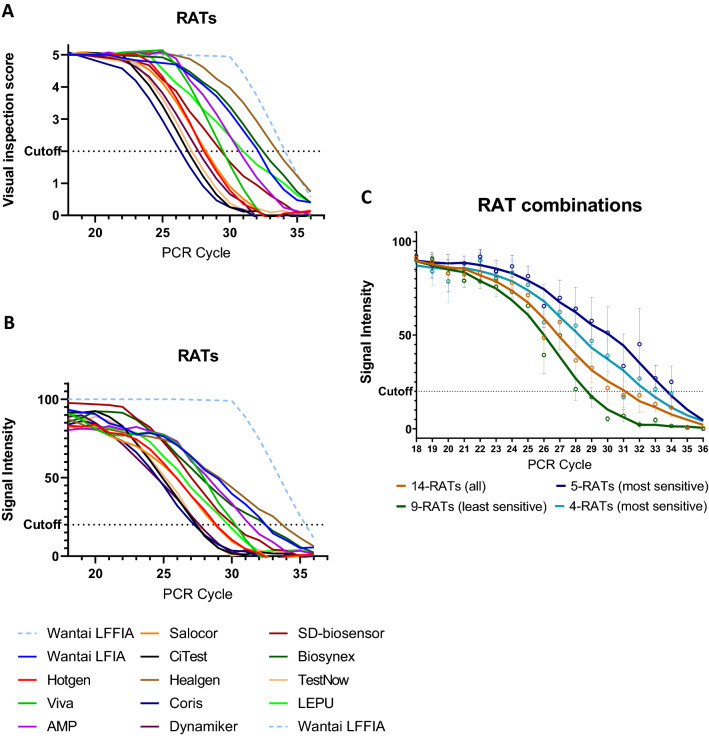
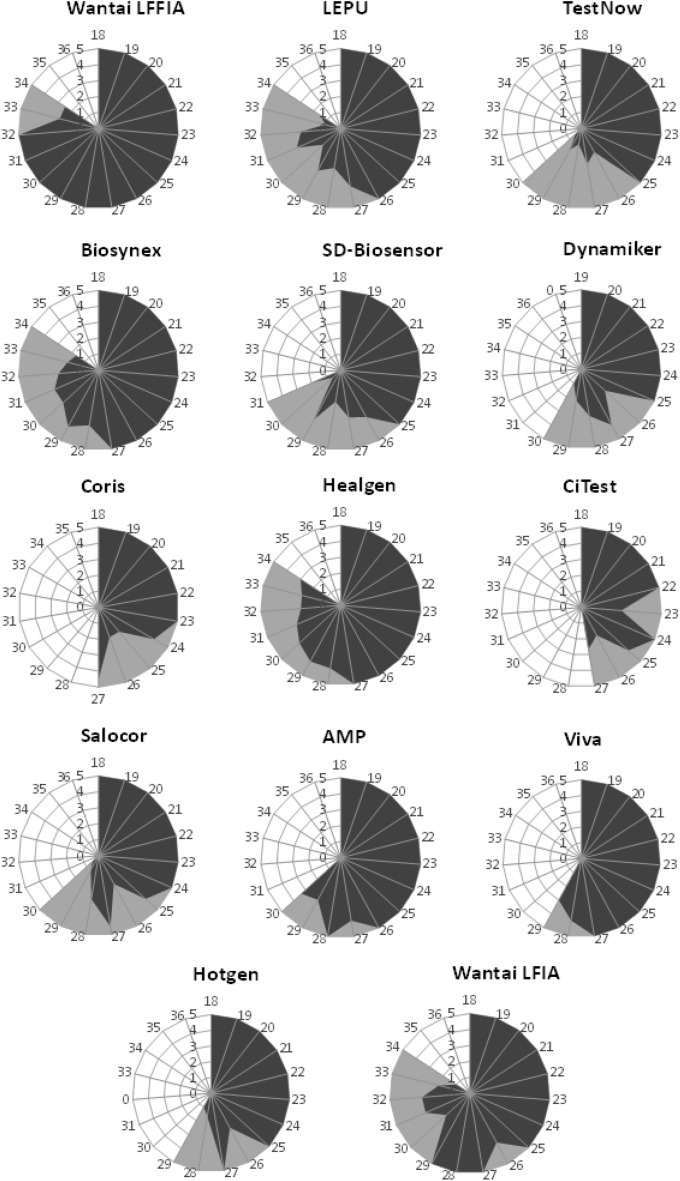
The most widely used test for the diagnosis of SARS-CoV-2 infection is a PCR test. PCR has very high sensitivity and is able to detect very low amounts of RNA. However, many individuals receiving a positive test result in a context of a PCR-based surveillance might be infected with SARS-CoV-2, but they are not contagious at the time of the test. The question arises regards if the cost effective, portable rapid antigen tests (RATs) have a better performance than PCR in identification of infectious individuals. In this direction, we examined the diagnostic performance of RATs from 14 different manufacturers in 400 clinical samples with known rRT-PCR cycles threshold (cT) and 50 control samples. Substantial variability was observed in the limit of detection (LOD) of different RATs (cT = 26.8-34.7). The fluorescence-based RAT exhibited a LOD of cT = 34.7. The use of the most effective RATs leads to true positive rates (sensitivities) of 99.1% and 90.9% for samples with cT ≤ 30 and cT ≤ 33, respectively, percentages that can guarantee a sensitivity high enough to identify contagious patients. RAT testing may also substantially reduce the quarantine period for infected individuals without compromising personal or public safety.


Conflict of interest statement

The authors declare no competing interests.

Figures

Figure 1
Figure 1
(A) The percentage of PCR positive samples that were found positive by RATs decreases as the PCR cT increases and the percentage of RAT-negative/PCR-positive samples is rising. 50% of samples are correctly identified as positive at cT = 31.5. (B) A significantly larger part of the RAT positive cases has cT values in the mid and lower range, while the highest cT values were more often observed in RAT negative cases.
Figure 2
Figure 2
(A) A reverse correlation of the visual inspection score of the band with the PCR cT was found (Pearson’s r = − 0.704, p < 0.0001). The cutoff value of each RAT was determined as the average cT that produces a test band with at least a score of 2 in the optical observation (which can be surely visually observed). (B) A reverse correlation of the colorimetric intensity of the band with the PCR cT was found (Pearson’s r = − 0.733, p < 0.0001). The cutoff value of each RAT was determined as the average cT that produces a test band with an intensity of 20% compared to the control band. The detection limit varied between cT = 27.2 and cT = 33.6 amongst conventional individual LFIA/VFIA assays and was found at cT = 35.3 for the fluorescence LFFIA assay. Especially for the LFFIA assay, positive samples were considered to have an intensity of 100 and negative samples an intensity of 0, due to the lack of quantitative data. (C) RAT combinations. Overall, the detection limit of the 14 RATs tested was cT = 31.1. The best 5 (most sensitive) RATs, including the LFFIA assay, showed a detection limit of cT = 33.7 and excluding the fluorescence LFFIA assay (4 top) had a detection limit of ct = 32.5. On the other hand, the 9 less sensitive RATs showed a significantly lower detection limit of cT= 28.6.
Figure 3
Figure 3
The diagnostic performance of each RAT is depicted as a spider graph. The length of each angular spoke (in dark grey) represents the average score (0–5) obtained by naked-eye visual inspection of the band for different samples of a designated cT. Different angles represent different cTs. The larger the area covered in blue, the strongest the test bands produced by this RAT. The second qualitative variable (in light gray) illustrates all the cTs of the samples that were successfully detected by this RAT and the area in gray defines the maximum sample’s cT that was found positive by this RAT.

References

    1. Mandavilli, A. Your Coronavirus Test Is Positive. Maybe It Shouldn’t Be.https://www.nytimes.com/2020/08/29/health/coronavirus-testing.html(2020) (Accessed 11 November 2021).
    1. Mina MJ, Parker R, Larremore DB. Rethinking Covid-19 test sensitivity—A strategy for containment. N. Engl. J. Med. 2020;383:e120. doi: 10.1056/NEJMp2025631. - DOI - PubMed
    1. Gniazdowski V, et al. Repeat COVID-19 molecular testing: Correlation with recovery of infectious virus, molecular assay cycle thresholds, and analytical sensitivity. medRxiv. 2020 doi: 10.1101/2020.08.05.20168963. - DOI - PubMed
    1. Young BE, et al. Viral dynamics and immune correlates of COVID-19 disease severity. Clin. Infect. Dis. 2020 doi: 10.1093/cid/ciaa1280. - DOI - PMC - PubMed
    1. Bullard J, et al. Predicting infectious SARS-CoV-2 from diagnostic samples. Clin. Infect. Dis. 2020 doi: 10.1093/cid/ciaa638. - DOI - PMC - PubMed

Substances