Comparative Study
. 2021 Nov 24;11(1):22858.
doi: 10.1038/s41598-021-02322-y.

Nasopharyngeal microbiota in hospitalized children with Bordetella pertussis and Rhinovirus infection

Affiliations
Comparative Study

Nasopharyngeal microbiota in hospitalized children with Bordetella pertussis and Rhinovirus infection

A E Tozzi et al. Sci Rep. .

Abstract

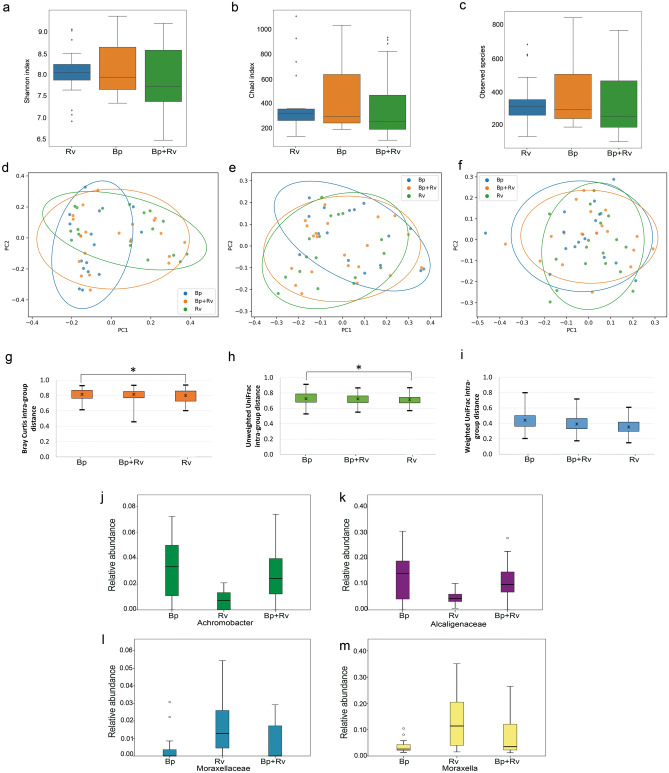
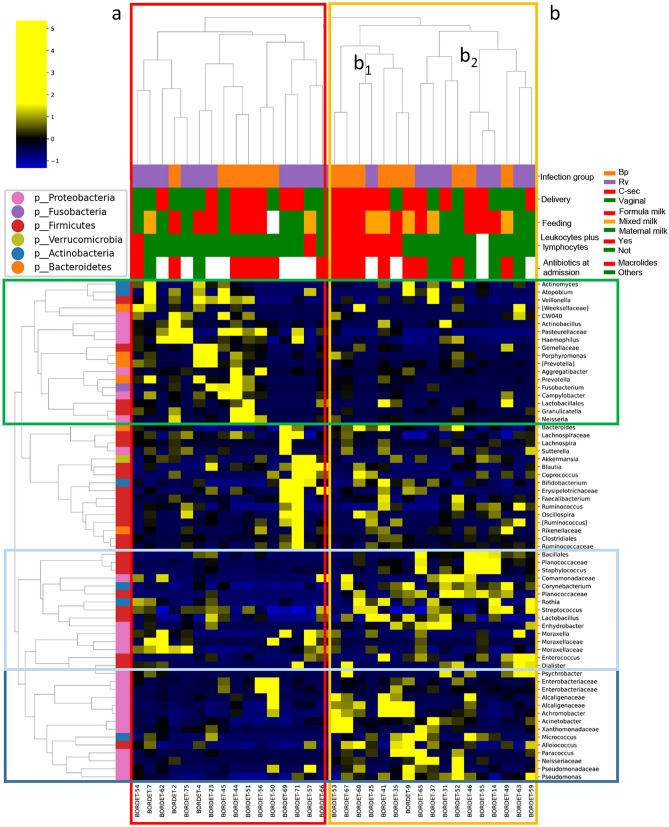
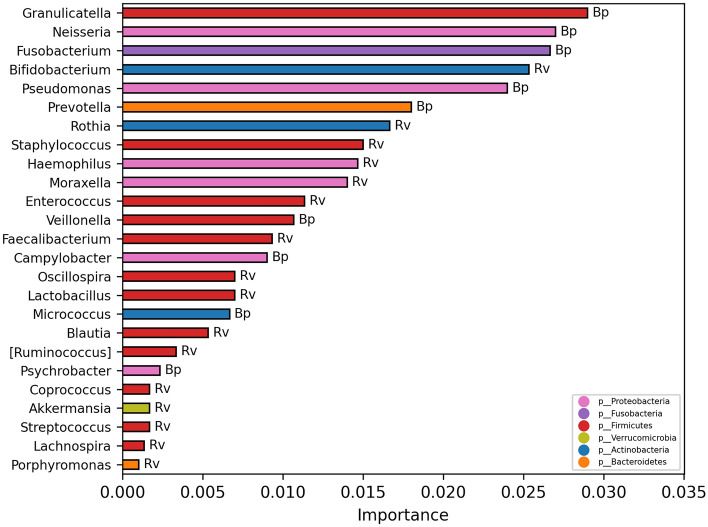
Despite great advances in describing Bordetella pertussis infection, the role of the host microbiota in pertussis pathogenesis remains unexplored. Indeed, the microbiota plays important role in defending against bacterial and viral respiratory infections. We investigated the nasopharyngeal microbiota in infants infected by B. pertussis (Bp), Rhinovirus (Rv) and simultaneously by both infectious agents (Bp + Rv). We demonstrated a specific nasopharyngeal microbiome profiles for Bp group, compared to Rv and Bp + Rv groups, and a reduction of microbial richness during coinfection compared to the single infections. The comparison amongst the three groups showed the increase of Alcaligenaceae and Achromobacter in Bp and Moraxellaceae and Moraxella in Rv group. Furthermore, correlation analysis between patients' features and nasopharyngeal microbiota profile highlighted a link between delivery and feeding modality, antibiotic administration and B. pertussis infection. A model classification demonstrated a microbiota fingerprinting specific of Bp and Rv infections. In conclusion, external factors since the first moments of life contribute to the alteration of nasopharyngeal microbiota, indeed increasing the susceptibility of the host to the pathogens' infections. When the infection is triggered, the presence of infectious agents modifies the microbiota favoring the overgrowth of commensal bacteria that turn in pathobionts, hence contributing to the disease severity.


Conflict of interest statement

The authors declare no competing interests.

Figures

Figure 1
Figure 1
Microbiota diversity analysis. Alpha diversity analysis (ac). Box plots show Shannon, Chao1, and Observed species indexes for each patients’ group. Microbiota beta diversity analysis (df). Principal coordinates analysis (PCoA) plot of bacterial beta-diversity based on Bray Curtis dissimilarity (d) and unweighted (e) and weighted (f) UniFrac phylogenetic distance. The plots show the first two principal coordinates (axes) of PCoA. Beta diversity distance box plots (gi). Data are expressed as minimum, maximum and median values, and 25th and 75th percentiles values. The statistical significant differences are determined by permanova-pairwise tests and indicated by the star. Box plots of OTUs statistically significant by Kruskal–Wallis test (jm). In y-axis are reported OTU’s relative abundances; in x-axis are reported median, minimum and maximum values, and the 25th and 75th percentile values.
Figure 2
Figure 2
Pearson’s heat-map correlation. The Pearson’s correlation is calculated between clinical features and OTUs’ relative abundances at family (a) and genus (b) levels. The color scale represents the scaled level of each variable: red, positive correlation values; blue, negative correlation values. The stars indicate the statistically significant correlations (p value ≤ 0.05).
Figure 3
Figure 3
Hierarchical cluster of Bp and Rv patients according to OTU distribution at the genus level. The heat-map reports the hierarchical Ward-linkage clustering based on the Pearson’s correlation coefficient amongst OTUs at genus level. The color scale represents the scaled level of each variable: yellow, high level; blue, low level. The column bar is colored according to the subject category and clinical features’ groups. The left bar is colored according to the phylum level taxonomy.
Figure 4
Figure 4
Important OTUs selected by model classification analysis. The bars represent the importance scores of each OTUs in the prediction of models.

References

    1. Jones N. The nose and paranasal sinuses physiology and anatomy. Adv. Drug Deliv. Rev. 2001;51:5–19. doi: 10.1016/S0169-409X(01)00172-7. - DOI - PubMed
    1. Yan M, et al. Nasal microenvironments and interspecific interactions influence nasal microbiota complexity and S. aureus carriage. Cell Host Microbe. 2013;14:631–640. doi: 10.1016/j.chom.2013.11.005. - DOI - PMC - PubMed
    1. Teo SM, et al. The infant nasopharyngeal microbiome impacts severity of lower respiratory infection and risk of asthma development. Cell Host Microbe. 2015;17:704–715. doi: 10.1016/j.chom.2015.03.008. - DOI - PMC - PubMed
    1. Iorio, A. et al. Cross-correlation of virome–bacteriome–host–metabolome to study respiratory health. Trends Microbiol. S0966842X21001220 (2021) 10.1016/j.tim.2021.04.011. - PubMed
    1. Liu CM, et al. Staphylococcus aureus and the ecology of the nasal microbiome. Sci. Adv. 2015;1:e1400216. doi: 10.1126/sciadv.1400216. - DOI - PMC - PubMed

Publication types

MeSH terms