. 2021 Nov 24;11(1):22872.
doi: 10.1038/s41598-021-02311-1.

Weeklong improved colour contrasts sensitivity after single 670 nm exposures associated with enhanced mitochondrial function

Affiliations

Weeklong improved colour contrasts sensitivity after single 670 nm exposures associated with enhanced mitochondrial function

Harpreet Shinhmar et al. Sci Rep. .

Abstract

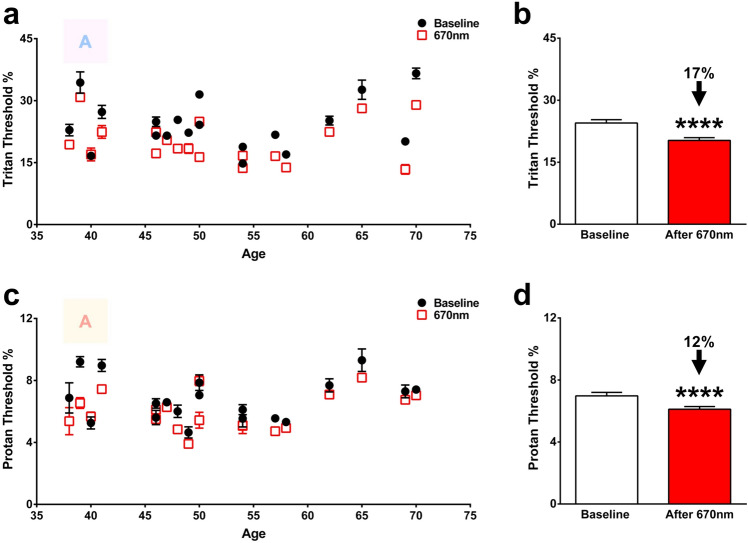
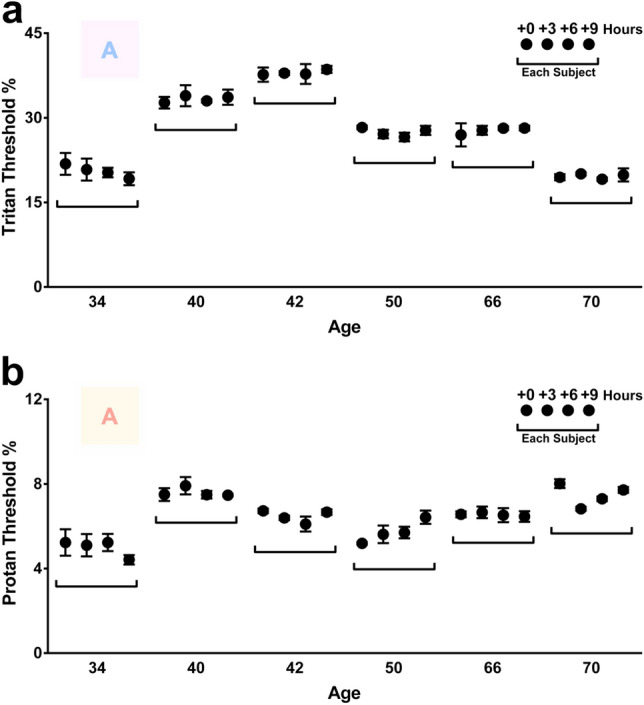
Mitochondrial decline in ageing robs cells of ATP. However, animal studies show that long wavelength exposure (650-900 nm) over weeks partially restores ATP and improves function. The likely mechanism is via long wavelengths reducing nanoscopic interfacial water viscosity around ATP rota pumps, improving their efficiency. Recently, repeated 670 nm exposures have been used on the aged human retina, which has high-energy demands and significant mitochondrial and functional decline, to improve vision. We show here that single 3 min 670 nm exposures, at much lower energies than previously used, are sufficient to significantly improve for 1 week cone mediated colour contrast thresholds (detection) in ageing populations (37-70 years) to levels associated with younger subjects. But light needs to be delivered at specific times. In environments with artificial lighting humans are rarely dark-adapted, hence cone function becomes critical. This intervention, demonstrated to improve aged mitochondrial function can be applied to enhance colour vision in old age.


Conflict of interest statement

The authors declare no competing interests.

The authors declare no competing interests.

Figures

Figure 1
Figure 1
Colour contrast sensitivities (CCS) measured 3 h following a morning exposure (8-9AM) of 670 nm. CCS of tritan (a) and protan (c) axes measured in 20 healthy subjects and their response to 670 nm exposure. Black closed circles represent baseline measurements and red open boxes are those in the same individuals measured 3 h following a single 3 min 670 nm exposure delivered in the morning. The colour letter A in both graphs is an example of the target to be identified as it appeared on the screen. (b) Thresholds for tritan function in individuals 38–70 years. Most subjects displayed a significant decrease to their tritan thresholds following light exposure. Overall, there was a 17% reduction to thresholds across the population. (d) Thresholds for protan function in individuals 38–70 years, with half the population displaying a significant decrease to their protan thresholds after 670 nm exposure. Total protan thresholds were reduced by 12% across all subjects. Wilcoxon matched-pairs signed rank test was used for statistical analysis. Data are presented as means ± SEM. ****p < 0.0001. Age related differences were not apparent in the baseline measurements as was apparent in Shinhmar et al. (2020). This was because the age range covered here was shorter than in the previous study with a tendency for clustering in the middle age range.
Figure 2
Figure 2
Colour contrast sensitivities (CCS) from a control cohort measured at the same time of day (8-9AM) with no 670 nm light exposure. CCS of tritan (a) and protan (b) axes measured in 10 subjects (34–70 years) at 8-9AM and 3 h later in the same manner as morning 670 nm light exposure and re-testing. Black closed circles represent measurements taken at 8-9AM to mimic baseline measures and time of 670 nm light exposure. Grey open boxes are those in the same individuals measured 3 h later between 11AM-12PM to mimic the time interval a perceived effect to 670 nm light exposure was achieved. The colour letter A in both graphs is an example of the target to be identified as it appeared on the screen. Thresholds for tritan function revealed no significant difference (p = 0.4648) when measured 3 h apart, simulating the same time of day for morning 670 nm light exposures. Similarly, thresholds for protan function revealed no significant difference (p = 0.9658) across all 10 subjects. Wilcoxon matched-pairs signed rank test was used for statistical analysis. Data are presented as means ± SEM.
Figure 3
Figure 3
Colour contrast sensitivities measured 3 h following an afternoon exposure (12-1PM) of 670 nm. CCS of tritan (a) and protan (c) axes measured in 6 healthy subjects and their response to 670 nm exposure. Black closed circles represent baseline measurements and red open boxes are those in the same individuals measured 3 h following a single 3 min 670 nm exposure delivered in the afternoon. The colour letter A in both graphs is an example of the target to be identified as it appeared on the screen. (b) Thresholds for tritan function in individuals 38–69 years. No significant change to tritan thresholds (p = 0.3047) were found when subjects were exposed to 670 nm light in the afternoon. (d) Thresholds for protan function in individuals 38–69 years. 670 nm exposure showed no effect on protan thresholds (p = 0.2577) when it was delivered in the afternoon. Wilcoxon matched-pairs signed rank test was used for statistical analysis. Data are presented as means ± SEM.
Figure 4
Figure 4
Variation in colour contrast sensitivities (CCS) across the day in 6 subjects. CCS of tritan (a) and protan (b) axes measured in 6 subjects (34–70 years) in 3 h intervals across the day. The four black closed circles within the bar represent each subject, measurements were taken in 3 h intervals at 8AM, 11AM, 2PM and 5PM. The colour letter A in both graphs is an example of the target to be identified as it appeared on the screen. Thresholds for tritan function revealed no significant variation across the day when measured in a 34 (p = 0.6898), 40 (p = 0.8902), 42 (p = 0.9388), 50 (p = 0.3890), 66 (p = 0.8592), and 70 (p = 0.7613) year-old. Similarly, thresholds for protan function revealed no significant variation across the day when measured in a 34 (p = 0.5802), 40 (p = 0.6149), 42 (p = 0.1937), 50 (p = 0.0943), 66 (0.9588), and 70 (p = 0.2222) year-old. An ordinary 1-way ANOVA and a multiple comparison test was used for inter-subject comparison and statistical analysis. Data are presented as means ± SEM.
Figure 5
Figure 5
Colour contrast sensitivities measured 1 week later from a morning exposure of 670 nm. CCS of tritan (a) and protan (c) axes from 10 healthy subjects with their response to a single dose of 670 nm measured 1 week later, without any further 670 nm exposure in the intermediary period Black closed circles represent baseline measurements and red open boxes are those in the same individuals measured 1 week later from a single 3 min 670 nm light exposure delivered in the morning. Some subjects displayed a return of their thresholds to baseline, whereas some still had a reduction. The colour letter A in both graphs is an example of the target to be identified as it appeared on the screen. (b) Thresholds for tritan function in individuals 39–70 years. There was a 10% sustained reduction to tritan thresholds (p = 0.0001) across the population from baseline measures. (d) Thresholds for protan function in individuals 39–70 years. There was an 8% sustained reduction to protan thresholds (p < 0.0001) across the population from baseline measures a week following 670 nm exposure. Wilcoxon matched-pairs signed rank test was used for statistical analysis. Data are presented as means ± SEM. ***p ≤ 0.0001, ****p < 0.0001.

References

    1. López-Otín C, Blasco MA, Partridge L, Serrano M, Kroemer G. The hallmarks of aging. Cell. 2013;153:1194. doi: 10.1016/j.cell.2013.05.039. - DOI - PMC - PubMed
    1. Wong-Riley M. Energy metabolism of the visual system. Eye Brain. 2010;2:99–116. doi: 10.2147/EB.S9078. - DOI - PMC - PubMed
    1. Shinhmar H, et al. Optically improved mitochondrial function redeems aged human visual decline. J. Gerontol. Ser. A Biol. Sci. Med. Sci. 2020;75:e49–e52. doi: 10.1093/gerona/glaa155. - DOI - PubMed
    1. Curcio CA, Millican CL, Allen KA, Kalina RE. Aging of the human photoreceptor mosaic: Evidence for selective vulnerability of rods in central retina. Investig. Ophthalmol. Vis. Sci. 1993;34:3278–3296. - PubMed
    1. Neveu MM, et al. Electroretinogram measures in a septuagenarian population. Doc. Ophthalmol. 2011;123:75–81. doi: 10.1007/s10633-011-9282-1. - DOI - PubMed

Publication types

Substances