. 2022 Mar;27(3):1774-1791.
doi: 10.1038/s41380-021-01375-9. Epub 2021 Nov 24.

A neuropsychosocial signature predicts longitudinal symptom changes in women with irritable bowel syndrome

Affiliations

A neuropsychosocial signature predicts longitudinal symptom changes in women with irritable bowel syndrome

Ravi R Bhatt et al. Mol Psychiatry. 2022 Mar.

Abstract

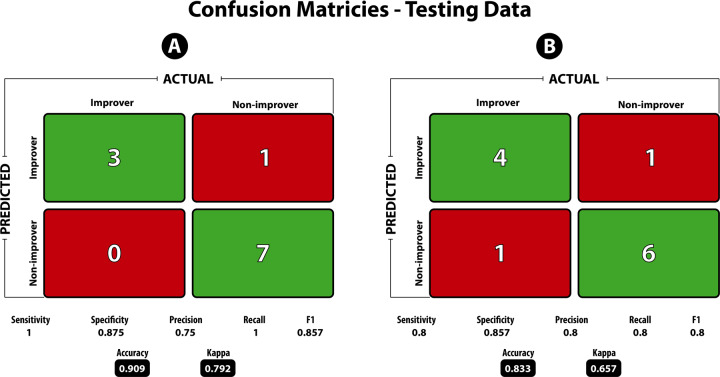
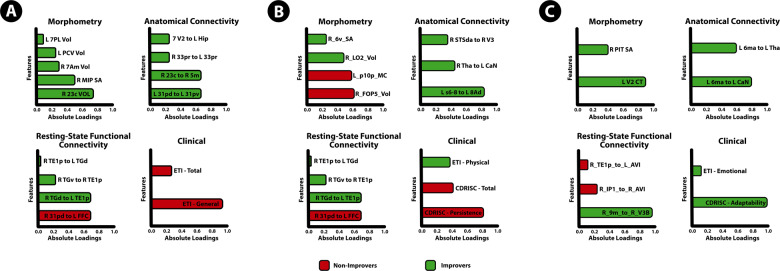
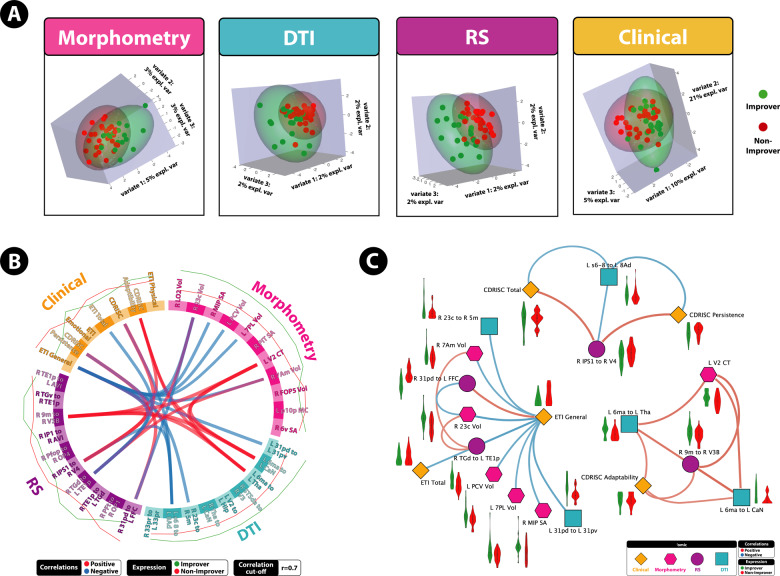
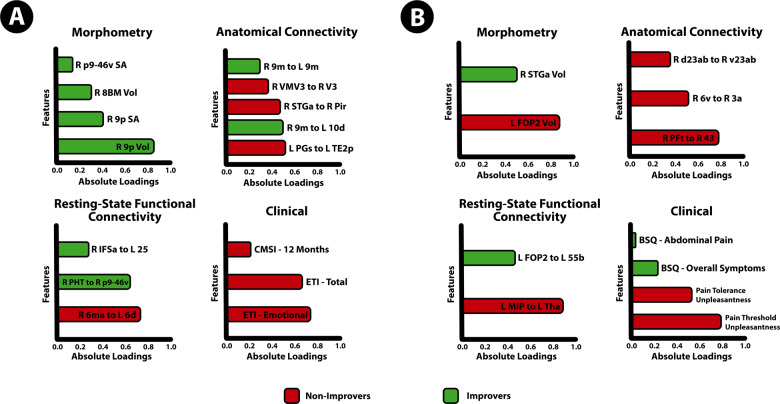
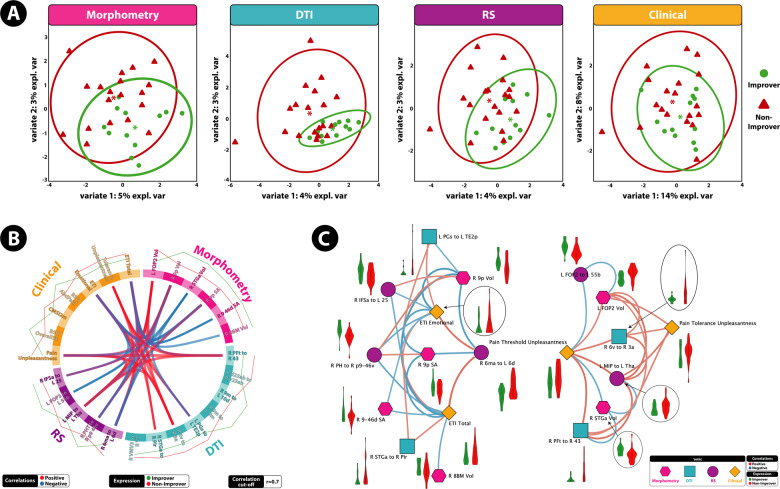
Irritable bowel syndrome (IBS) is a common disorder of brain-gut interactions characterized by chronic abdominal pain, altered bowel movements, often accompanied by somatic and psychiatric comorbidities. We aimed to test the hypothesis that a baseline phenotype composed of multi-modal neuroimaging and clinical features predicts clinical improvement on the IBS Symptom Severity Scale (IBS-SSS) at 3 and 12 months without any targeted intervention. Female participants (N = 60) were identified as "improvers" (50-point decrease on IBS-SSS from baseline) or "non-improvers." Data integration analysis using latent components (DIABLO) was applied to a training and test dataset to determine whether a limited number of sets of multiple correlated baseline'omics data types, including brain morphometry, anatomical connectivity, resting-state functional connectivity, and clinical features could accurately predict improver status. The derived predictive models predicted improvement status at 3-months and 12-months with 91% and 83% accuracy, respectively. Across both time points, non-improvers were classified as having greater correlated morphometry, anatomical connectivity and resting-state functional connectivity characteristics within salience and sensorimotor networks associated with greater pain unpleasantness, but lower default mode network integrity and connectivity. This suggests that non-improvers have a greater engagement of attentional systems to perseverate on painful visceral stimuli, predicting IBS exacerbation. The ability of baseline multimodal brain-clinical signatures to predict symptom trajectories may have implications in guiding integrative treatment in the age of precision medicine, such as treatments targeted at changing attentional systems such as mindfulness or cognitive behavioral therapy.


Conflict of interest statement

Emeran A. Mayer, MD is a scientific advisory board member of Danone, Axial Biotherapeutics, Viome, Amare, Mahana Therapeutics, Pendulum, Bloom Biosciences and APC Microbiome Ireland. No other authors have no conflicts of interest to disclose.

Figures

Fig. 1
Fig. 1. Confusion matrix statistics on the testing dataset for the model predicting 3-month and 12-month improvers and non-improvers.
Sensitivity and recall are defined as the true positive rate (i.e., number of predicted improvers divided by the total number of improvers), Specificity is defined as the true negative rate (i.e., number of predicted non-improvers divided by the total number of non-improvers). Precision is the ability of the classifier to not label a true negative as a positive (i.e., the ability to not label a non-improver an improver). The F1 score is the harmonic mean of precision and recall, with values closer to 1 being a better score. Accuracy is defined as the number of true positives and true negatives divided by the total population. The Kappa statistic is known to be a better measure compared to accuracy, especially in the case of imbalanced classes. Kappa values between 0.61 and 0.80 are said to be “Substantial” and between 0.81 and 1.0 to be “Almost Perfect”.
Fig. 2
Fig. 2. Features contributing to the multi-modal neuropsychosocial signature predicting improvers vs. non-improvers in IBS symptoms after 3 months.
Absolute loadings depict the relative importance of each feature. Colors represent which group has the higher mean value for that feature. A Component 1 Morphometry: 23c Area 23C (posterior cingulate cortex [PCC]), MIP medial intraparietal area; 7 Am medial area 7A (SPC); PCV precuneus, 7 PL lateral area 7P (superior parietal cortex [SPC]). Anatomical Connectivity: 31pd area 31pd (PCC), 31pv area 31p ventral (PCC), 23c area 23c (PCC), 5 m area 5 m (paracentral lobule); 33pr area 33 prime, V2 second visual area, Hip Hippocampus. Resting-State Functional Connectivity: 31pd area 31pd (PCC), FFC fusiform face cortex, TGd area TG dorsal (LTC), TE1p area TE1 posterior (LTC), TGv area TG ventral. Clinical: ETI general early trauma inventory general score, ETI total early trauma inventory total score B: Component 2 Abbreviations: Clinical: CDRISC persistence Connor-Davidson resilience persistence subscale, CDRISC total Connor-Davidson resilience persistence total score, ETI physical early trauma inventory physical score. Morphometry: FOP5 area frontal opercular 5, p10p area posterior 10p, LO2 area lateral occipital 2; 6 v ventral area 6. Anatomical connectivity: s6–8 superior 6–8 transitional area, 8Ad area 8Ad, Tha. Thalamus, CaN Caudate nucleus, STSda area STSd anterior, V3 third visual area. Resting-State Functional Connectivity: IPS1 intraparietal sulcus area 1, V4 fourth visual area, PFt area PFt, area OP1 area OP1/SII, PFop area PF opercular, OP4 area OP4/PV C: Component 3 Abbreviations: Clinical: CDRISC adaptability Connor-Davidson resilience adaptability subscale, ETI emotional early trauma inventory emotional score. Morphometry: V2 second visual area, PIT posterior inferotemporal cortex. Anatomical Connectivity: 6 ma area 6m anterior, CaN Caudate nucleus, Tha Thalamus. Resting-State Functional Connectivity: 9 m area 9 middle, IP1 area intraparietal 1, AVI anterior ventral insular area, TE1p area TE1 posterior.
Fig. 3
Fig. 3. A highly correlated multi-modal, brain-clinical signature predicts 3 month IBS symptom trajectories via DIABLO.
A Sample plots for morphometry, anatomical connectivity, resting-state functional connectivity, and clinical variables for the 3 month DIABLO analysis. Samples are represented as points according to their projection across three latent variables. B Circos plot for the 3 month DIABLO analysis representing all of the features in the DIABLO model, and the correlations between variables of different data types. Correlation cut-off is set to r = 0.7. Lines along the outside of the circle represent the mean “expression” levels. Greater levels are in accordance to the line being farther away from the circle. C Relevance network for the 3 month DIABLO analysis representing the correlation between variables of different data types. Red lines represent positive correlations and blue lines represent negative correlations. Boxplots with violin plots represent the distribution of each group for each feature. Correlation cut-off is set to r = 0.7.
Fig. 4
Fig. 4. Features contributing to the multi-modal neuropsychosocial signature predicting improvers vs. non-improvers in IBS symptoms after 12 months.
Absolute loadings depict the relative importance of each feature. Colors represent which group has the maximal mean value for that feature. Component 1 Abbreviations: Morphometry: 9p area 9 posterior (dlPFC), 8BM area 8BM (mPFC), p9-46v area posterior 9-46v (dlPFC). Anatomical Connectivity: 9 m area 9 middle (medial prefrontal cortex [mPFC]), VMV3 ventromedial visual area 1, V3 third visual area, STGa area STGa, Pir Pirform cortex (anterior insula [aINS]), 10d area 10d (OFC), PGs area PGs; TE2p area TE2 posterior Resting-State Functional Connectivity: 6 ma area 6m anterior, 6d dorsal area 6, PHT area PHT, p9-46v area posterior 9-46v, IFSa area IFSa, 25 Area 25 Clinical: ETI total early trauma inventory total score, ETI emotional early trauma inventory emotional subscale score, CMSI 12 months complex multi-symptom inventory in the past 12 months. Component 2: Abbreviations: Morphometry: FOP2 frontal opercular area 2; STGa area STGa Anatomical Connectivity: PFt area Pft; 43 area 43; 6v ventral area 6, d23ab area dorsal 23 a + b, v23ab area ventral dorsal a + b Resting-State Functional Connectivity: MIP medial intraparietal area, Tha Thalamus, FOP2 frontal opercular area 2, 55b area 55b Clinical: pain threshold unpleasantness, pain tolerance unpleasantness; BSQ overall symptoms Bowel Symptom Questionnaire (overall symptom score), BSQ abdominal pain Bowel Symptom Questionnaire (overall abdominal pain).
Fig. 5
Fig. 5. A highly correlated multi-modal, brain-clinical signature predicts 12 month IBS symptom trajectories via DIABLO.
A Sample plots for morphometry, anatomical connectivity, resting-state functional connectivity, and clinical variables for the 12-month DIABLO analysis. Samples are represented as points according to their projection across two latent variables. Explained variance across each component is listed. B Circos plot for the 12-month DIABLO analysis representing all of the features in the DIABLO model, and the correlations between variables of different data types. Correlation cut-off is set to r = 0.7. Lines along the outside of the circle represent the mean “expression” levels. Greater levels are in accordance to the line being farther away from the circle. C Relevance network for the 12-month DIABLO analysis representing the correlation between variables of different data types. Red lines represent positive correlations and blue lines represent negative correlations. Boxplots with violin plots represent the distribution of each group for each feature. Correlation cut-off is set to r = 0.7.

Similar articles

Cited by

References

    1. Enck P, Aziz Q, Barbara G, Farmer AD, Fukudo S, Mayer EA, et al. Irritable bowel syndrome. Nat Rev Dis Prim. 2016;2:404–13. - PMC - PubMed
    1. Lovell RM, Ford AC. Global prevalence of and risk factors for irritable bowel syndrome: a meta-analysis. Clin Gastroenterol Hepatol. 2012;10:712–21. doi: 10.1016/j.cgh.2012.02.029. - DOI - PubMed
    1. Chey WD, Kurlander J, Eswaran S. Irritable bowel syndrome: a clinical review. JAMA. 2015;313:949–58. - PubMed
    1. Gralnek IM, Hays RD, Kilbourne AA, Naliboff B, Mayer EA. The impact of irritable bowel syndrome on health-related quality of life. Gastroenterology. 2000;119:654–60. doi: 10.1053/gast.2000.16484. - DOI - PubMed
    1. Khan S, Chang L. Diagnosis and management of IBS. Nat Rev Gastroenterol Hepatol. 2010;7:565–81. doi: 10.1038/nrgastro.2010.137. - DOI - PubMed

Publication types