. 2021 Dec;6(12):1549-1560.
doi: 10.1038/s41564-021-01000-z. Epub 2021 Nov 24.

Global phylogeny of Treponema pallidum lineages reveals recent expansion and spread of contemporary syphilis

Affiliations

Global phylogeny of Treponema pallidum lineages reveals recent expansion and spread of contemporary syphilis

Mathew A Beale et al. Nat Microbiol. 2021 Dec.

Abstract

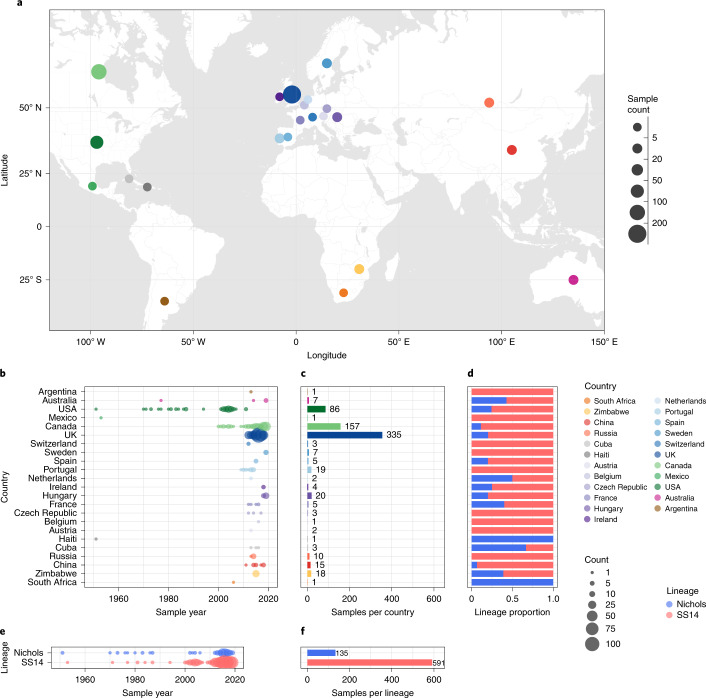
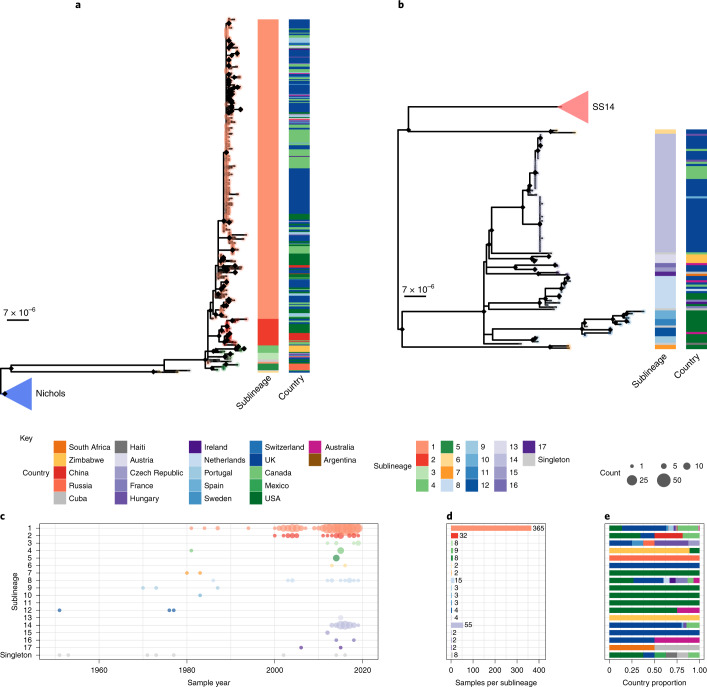
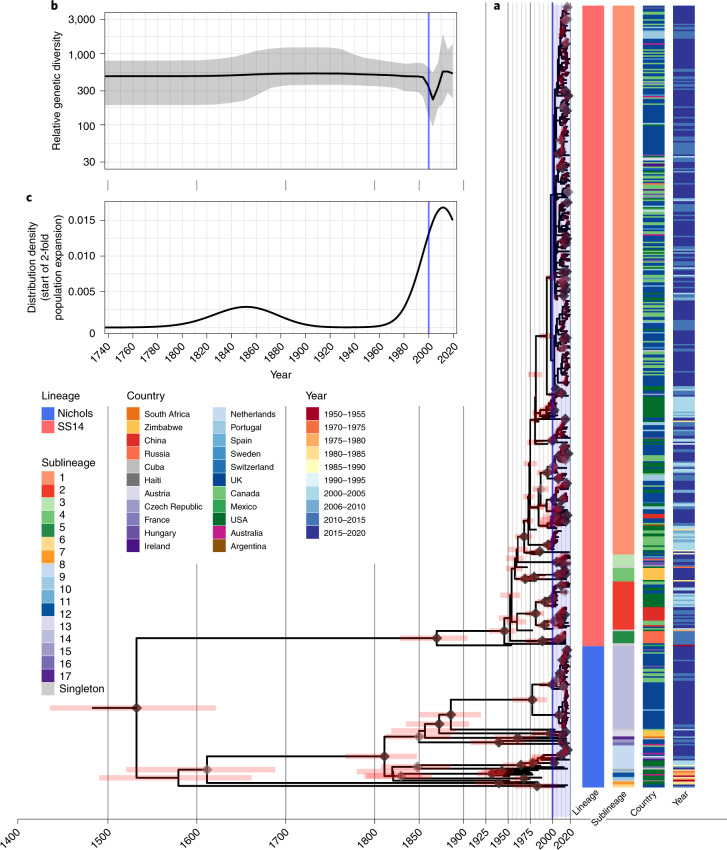
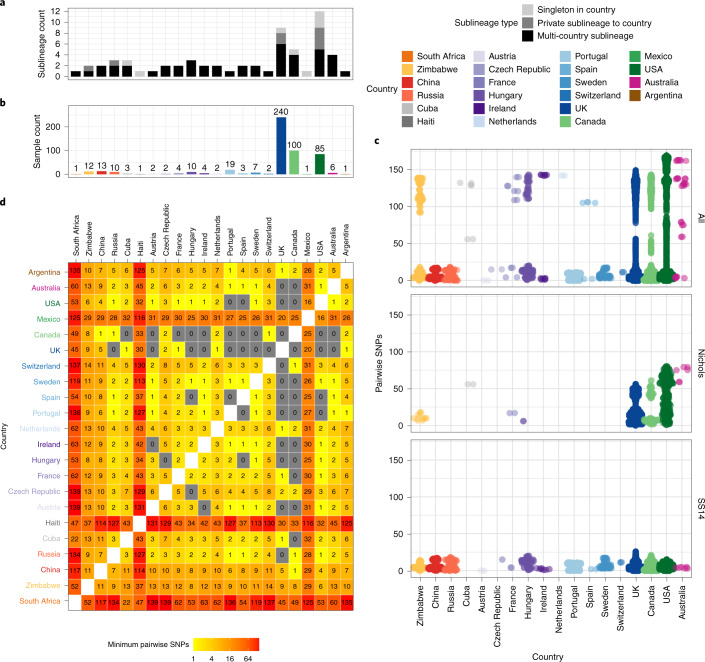
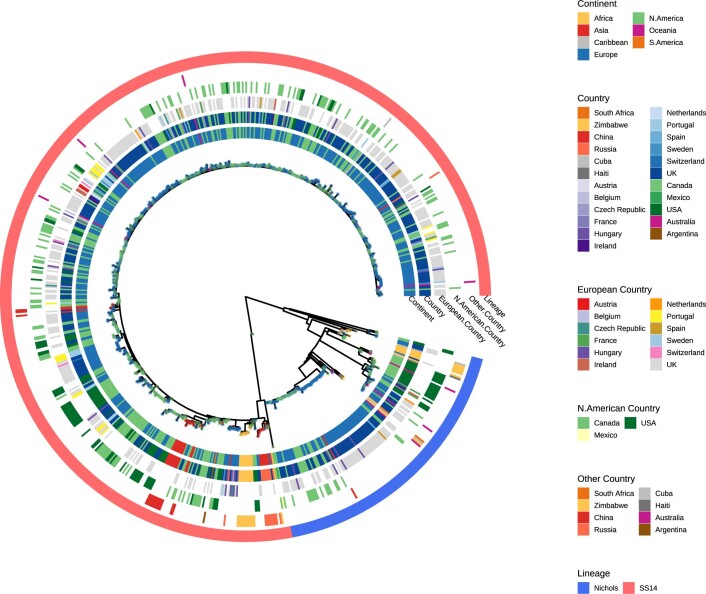
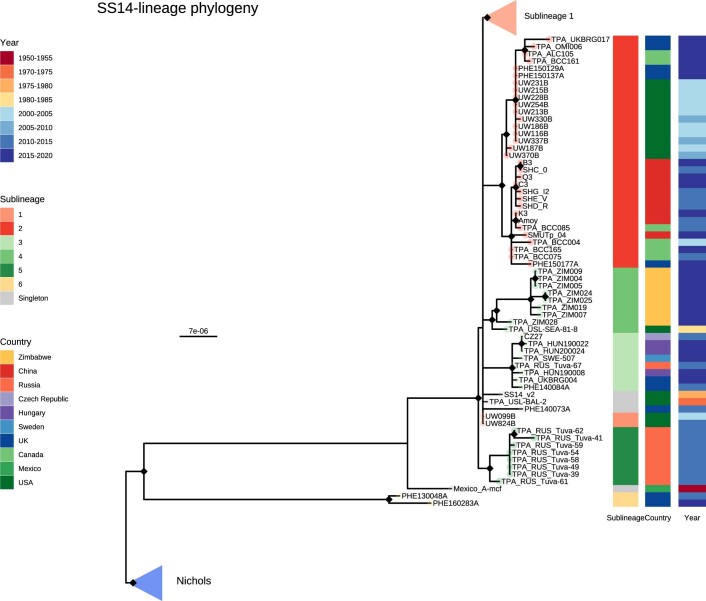
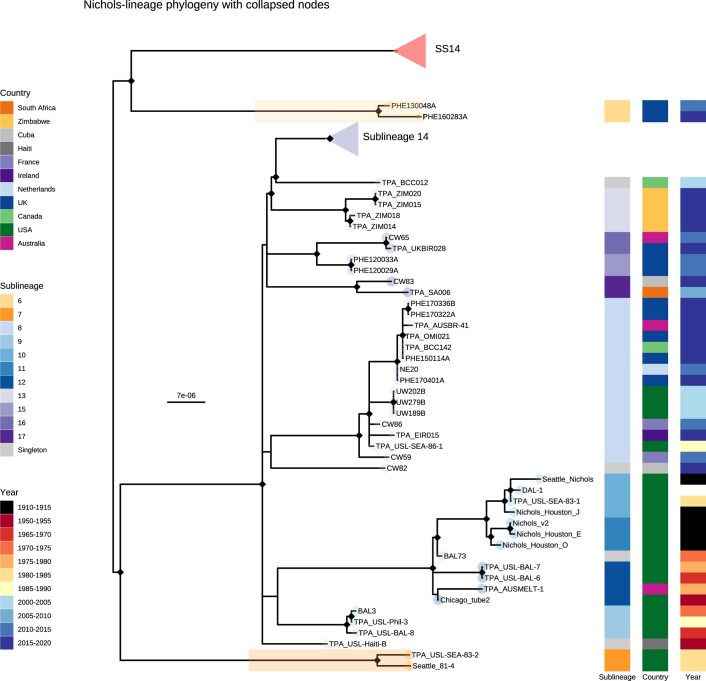
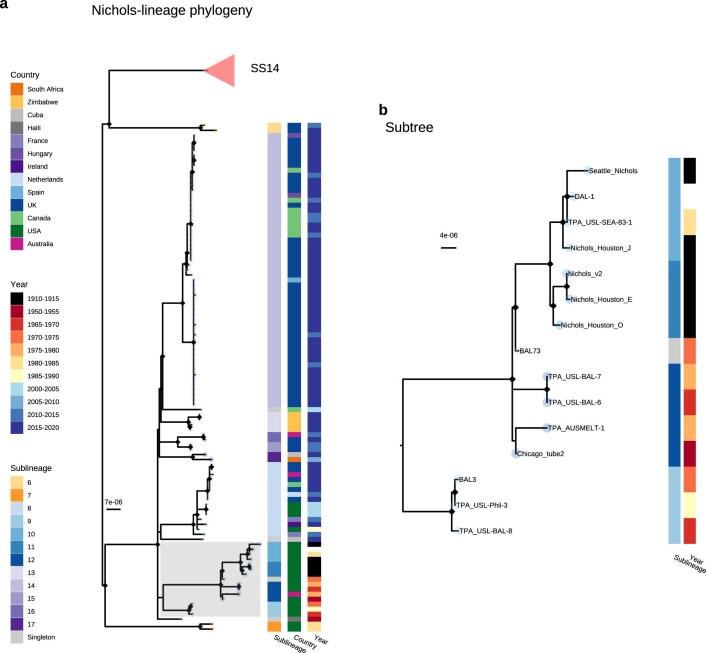
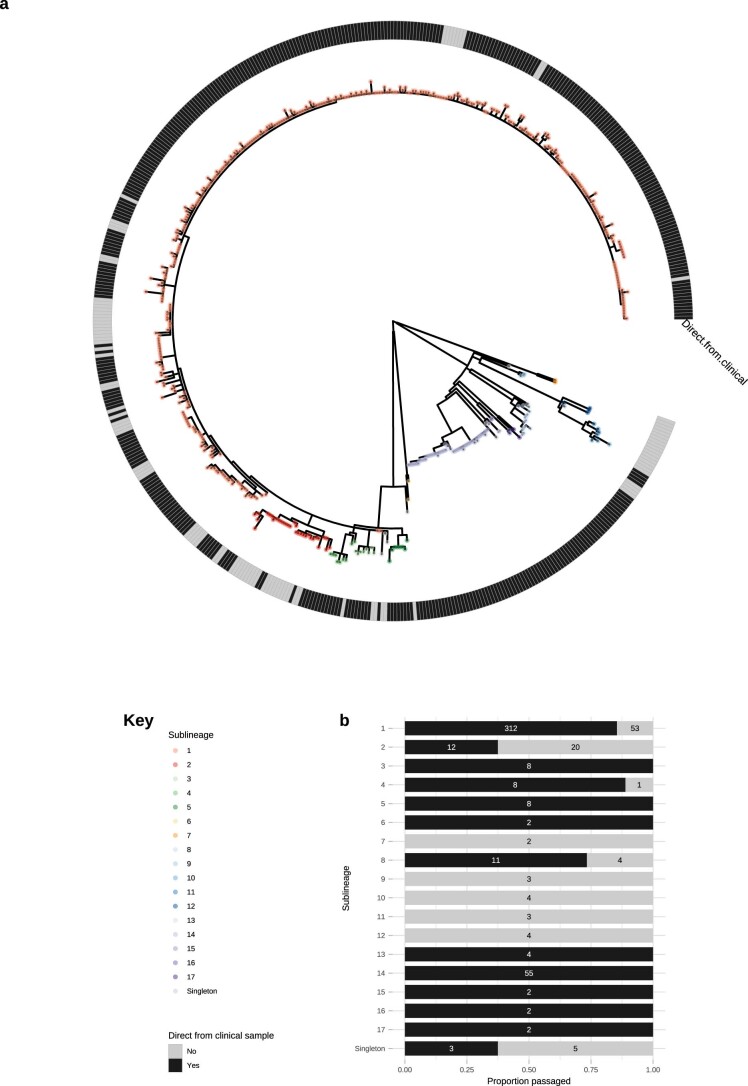
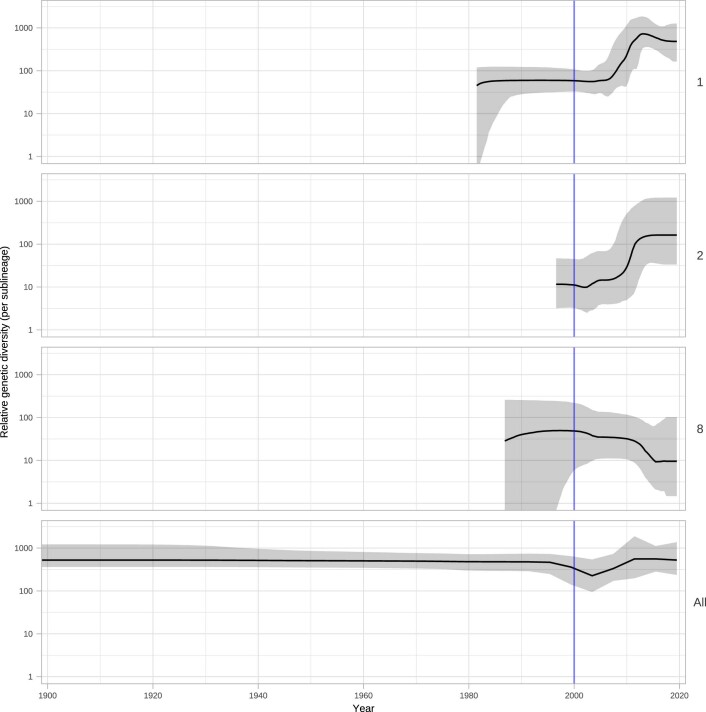
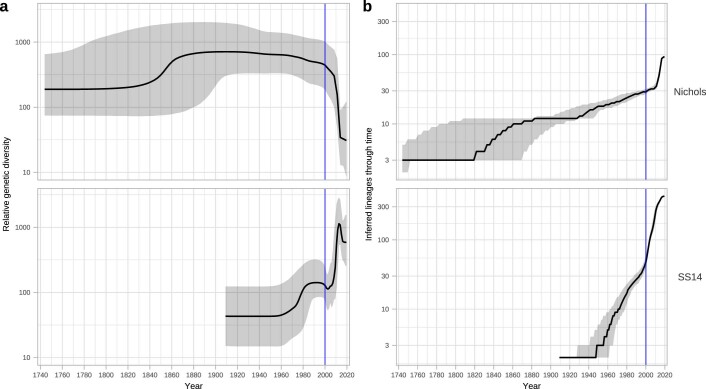
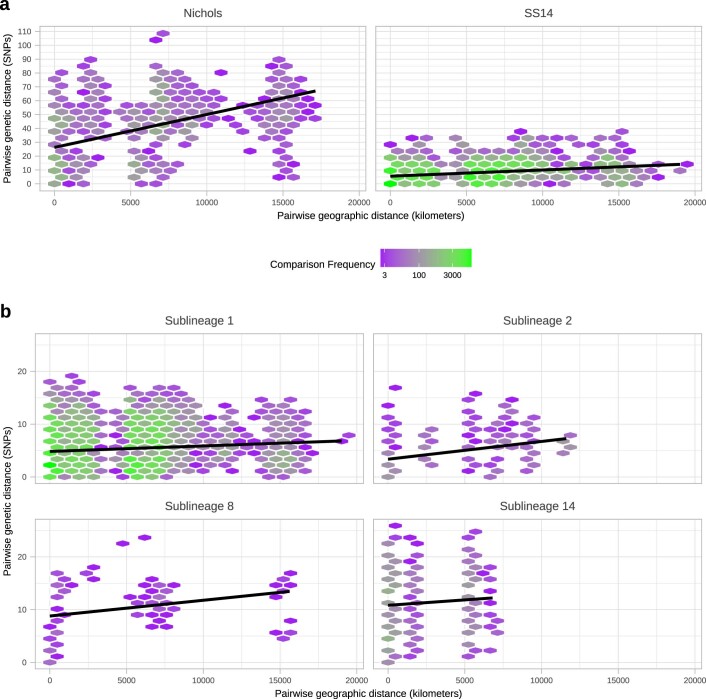
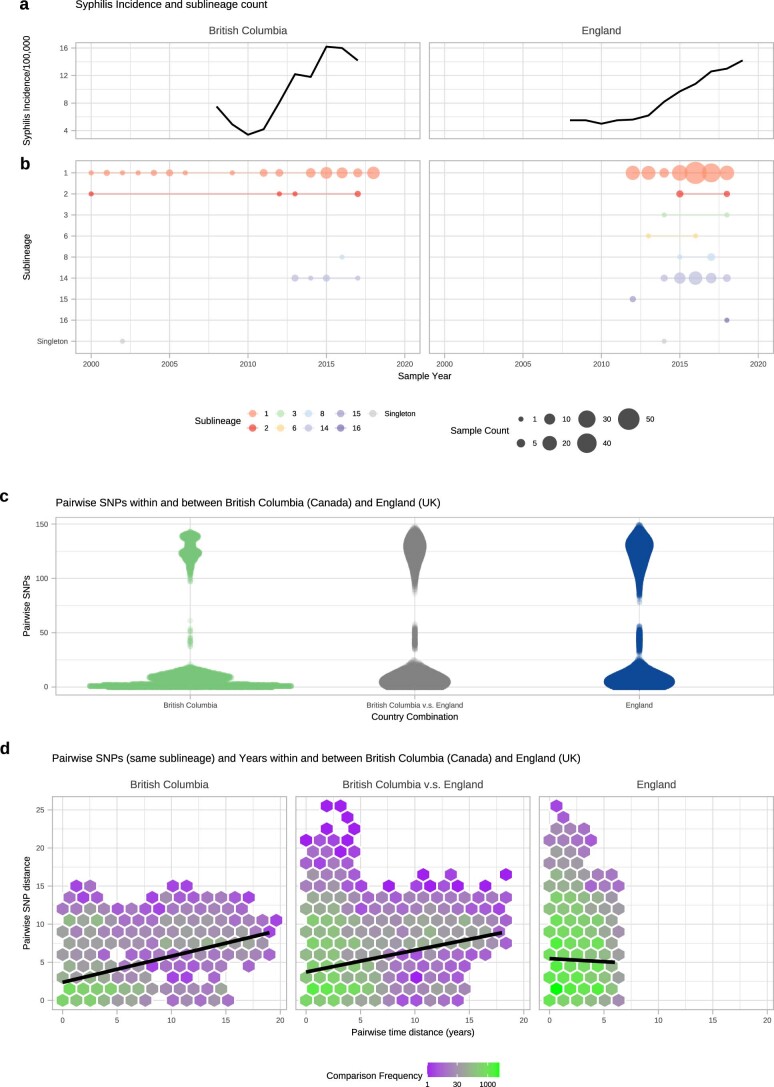
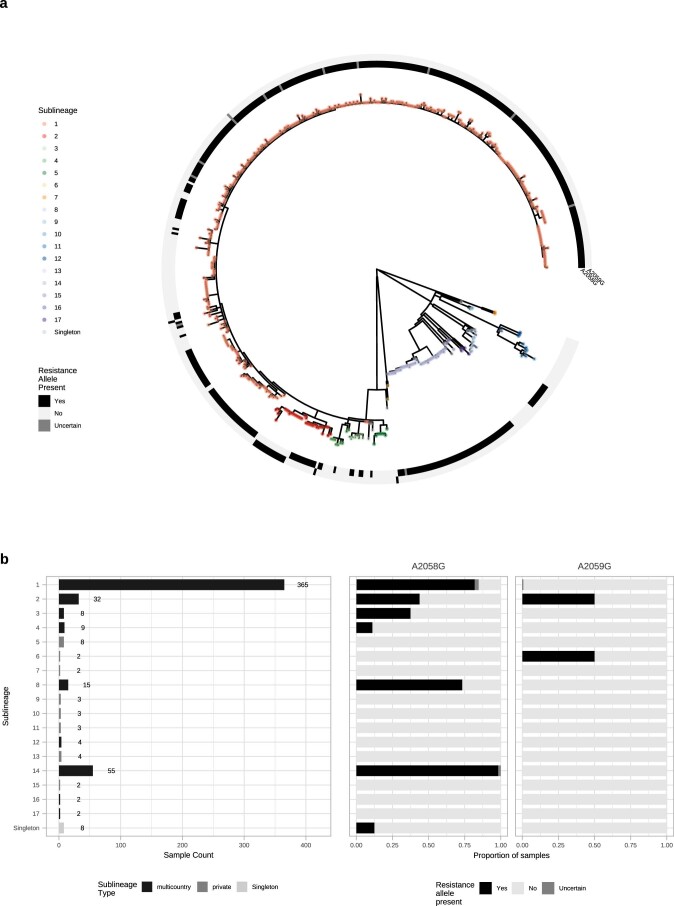
Syphilis, which is caused by the sexually transmitted bacterium Treponema pallidum subsp. pallidum, has an estimated 6.3 million cases worldwide per annum. In the past ten years, the incidence of syphilis has increased by more than 150% in some high-income countries, but the evolution and epidemiology of the epidemic are poorly understood. To characterize the global population structure of T. pallidum, we assembled a geographically and temporally diverse collection of 726 genomes from 626 clinical and 100 laboratory samples collected in 23 countries. We applied phylogenetic analyses and clustering, and found that the global syphilis population comprises just two deeply branching lineages, Nichols and SS14. Both lineages are currently circulating in 12 of the 23 countries sampled. We subdivided T. p. pallidum into 17 distinct sublineages to provide further phylodynamic resolution. Importantly, two Nichols sublineages have expanded clonally across 9 countries contemporaneously with SS14. Moreover, pairwise genome analyses revealed examples of isolates collected within the last 20 years from 14 different countries that had genetically identical core genomes, which might indicate frequent exchange through international transmission. It is striking that most samples collected before 1983 are phylogenetically distinct from more recently isolated sublineages. Using Bayesian temporal analysis, we detected a population bottleneck occurring during the late 1990s, followed by rapid population expansion in the 2000s that was driven by the dominant T. pallidum sublineages circulating today. This expansion may be linked to changing epidemiology, immune evasion or fitness under antimicrobial selection pressure, since many of the contemporary syphilis lineages we have characterized are resistant to macrolides.


Conflict of interest statement

M.K. declares institutional funding from Roche, Hologic and Siemens, which is unrelated to this work. The remaining authors declare no competing interests. The funders had no input into the study design, interpretation or decision to submit for publication.

Figures

Fig. 1
Fig. 1. Global distribution of 726 T. p.pallidum partial genomes.
a, Map of sampled countries for 726 partial (>25% of genome positions) genomes. Circle size corresponds to total number of genomes (binned into categories), and colour corresponds to country. Country coordinates used are the country centroid position, except for Russia (where the centroid for the Tuva Republic is used) and Mexico (where the location of Mexico City is used). Map tiles by Stamen Design (CC-BY 3.0), map data by OpenStreetMap (ODbl). b, Temporal distribution of samples by country. Size of circle indicates number of samples for that year. Three samples from Baltimore (USA) had uncertain sampling dates (1960–1980) and were set to 1970 for plotting dates in b and e. Genomes derived from passaged variants of the Nichols-1912 isolate or those with uncertain collection dates are not shown in plotted timeline (b, e). c, Total count of samples by country. d, Relative proportion of country samples corresponding to each TPA lineage (where only one sample was present per country, this shows the lineage it corresponds to). e, Temporal distribution of the samples by TPA lineage. f, Total count of samples by TPA lineage.
Fig. 2
Fig. 2. Fine-scale analysis of 528 high-quality (>75% reference sites) TPA genomes and sublineages.
a, Recombination-masked WGS phylogeny, highlighting the SS14 lineage (n = 426). b, Recombination-masked WGS phylogeny, highlighting the Nichols lineage (n = 102), including four outlying genomes (sublineages 6 and 7). For a and b, coloured strips show sublineage and country; tree tips show sublineage. Coloured triangle indicates node position of collapsed sister lineage. UltraFast bootstraps ≥95% are indicated with black diamond node marks. Note that sublineage 6 is shown in both trees (see main text). c, Temporal distribution of samples by sublineage (unrelated singleton genomes are grouped together). d, Total count of samples by sublineage. e, Relative proportion of each sublineage sample corresponding to country.
Fig. 3
Fig. 3. Bayesian maximum-credibility phylogeny of 520 TPA genomes shows population contraction during the 1990s, followed by rapid expansion from the early 2000s onwards.
a, Time-scaled phylogeny of 520 TPA genomes. Node points are shaded according to posterior support (black ≥96%, dark grey >91%, light grey >80%). Pink bars on nodes indicate 95% highest posterior density intervals. Blue line and shaded area highlight post-2000 expansion of lineages. b, Bayesian Skyline plot of genetic diversity shows small population expansion and contractions during the nineteenth and twentieth centuries, followed by a sharp decline and rapid re-emergence during the 1990s and 2000s. c, Posterior distribution of start dates for a 2-fold expansion above Skyline mean shows strong support for expansion after 1990 in 68.6% (9,263/13,503) of trees.
Fig. 4
Fig. 4. Substantial sharing of closely related strains within and between countries.
a, Number of sublineages found per country, classified by sublineage distribution (multi-country, black; private to one country, medium grey; singleton, light grey). b, Total high-quality genomes per country. c, Pairwise comparison of SNP distance distributions from samples in each country (with >1 sample), across all samples and within lineages. d, Minimum pairwise SNPs between samples from different countries. All pairwise SNP comparisons exclude comparisons with same samples. Haiti, South Africa and Mexico appear to be striking outliers in terms of genetic relatedness, but this reflects that the Haiti and Mexico samples were collected in the 1950s, and we had only a single genome from these countries.
Extended Data Fig. 1
Extended Data Fig. 1. Phylogenetic distribution of 726 Treponema pallidum ssp pallidum partial genomes.
Maximum likelihood phylogeny of 726 partial (>25% of genome positions) genomes shows two primary lineages (Nichols, SS14), with no obvious correlation by country or continent. Tree tip points are coloured by continent. Coloured strips show continent, country (all), countries separated by region (European Countries, North American Countries, Other Countries) and TPA lineage. One very low coverage sample (TPA_BCC144, Canada, 47% genome breadth, 7.9X mean coverage) appears basal to the SS14-lineage clade in this phylogeny, but due to low coverage it was not possible to determine the correct placement.
Extended Data Fig. 2
Extended Data Fig. 2. Detailed subtree of SS14-lineage.
Recombination masked WGS phylogeny, showing the SS14-lineage and sublineages. The low diversity globally distributed sublineage 1 has been collapsed to enable visualization of the remaining sublineages. Tip points are coloured by sublineage, and coloured strips show sublineage and country. Blue triangle indicates collapsed Nichols-lineage, pink triangle indicates collapsed sublineage 1. Two samples close to the root of the common SS14-lineage clades were clustered as sublineage 1, and are shown. Note that sublineage 6 diverges from a node close to the root of TPA, and appears on the SS14 side in this midpoint rooted tree.
Extended Data Fig. 3
Extended Data Fig. 3. Subtree highlighting novel Nichols-lineage strains.
Recombination masked WGS phylogeny, showing the Nichols-lineage and sublineages. Tip points are coloured by sublineage, and coloured strips show sublineage and country. Shaded boxes highlight basal Nichols-lineage outgroup sublineages 6 and 7. Note that sublineage 6 diverges from a node close to the root of TPA, and appears on the SS14 side in this midpoint rooted tree. The large clonal sublineage 14 has been collapsed to enable clearer visualization of the remaining taxa. The pink triangle indicates collapsed SS14-lineage, blue triangle indicates the collapsed sublineage 14.
Extended Data Fig. 4
Extended Data Fig. 4. Commonly used Nichols Reference genomes form a monophyletic clade distinct from contemporary clinical strains.
A- Recombination masked WGS phylogeny, showing the Nichols-lineage and sublineages. Shaded grey box shows a monophyletic clade containing commonly used reference genomes as well as genetically related strains. Tip points are coloured by sublineage, and coloured strips show sublineage and country. Pink triangle indicates collapsed SS14-lineage. B- Expanded view of a seemingly extinct clade containing common reference strains including Nichols_v2, DAL-1 and Seattle_Nichols. The most recent sample closely related to the reference strains (TPA_USL-SEA-83-1) was collected in 1983, while the latest sample for the entire clade (TPA_USL-Phil-3) was collected in 1987. The provenance of the sample originally used for sequencing the DAL-1 genome is uncertain, but in the literature the original isolation was in 1988. The placement of both DAL-1 and TPA_USL-SEA-83-1 within the diversity of Nichols-1912 derivatives suggests the possibility of the samples being mislabeled in the handling laboratories.
Extended Data Fig. 5
Extended Data Fig. 5. Finescale analysis of 528 high quality TPA genomes and sublineages, showing distribution of samples sequenced directly from clinical samples and those passaged in rabbit model.
A – Whole genome phylogeny showing distribution of samples sequenced directly from clinical sample or rabbit-passaged. B – Distribution of samples sequenced directly from clinical sample and rabbit-passaged samples according to sublineage, showing proportion (bar) and exact count (number). For both A and B, plots are coloured according to being directly sequenced from clinical samples (Black) or after rabbit passage (grey). Samples passaged in rabbits are distributed throughout the global TPA phylogeny, and present in 9/17 sublineages. Older samples from before 2000 were isolated via rabbit passage, and dominate extinct clusters, as well as clustering close to the most recent common ancestor of contemporary sublineages such as SS14 sublineage 1.
Extended Data Fig. 6
Extended Data Fig. 6. Bayesian Skyline analysis of sublineages.
Plots show population expansions occurring during the early 2000s for all sublineages with >15 samples apart from sublineage 14. Sublineage 14, which had low temporal signal, did not converge after multiple BEAST runs. Shows Skyline plots of sublineages 1, 2, 8 and plot for all samples from Fig. 3.
Extended Data Fig. 7
Extended Data Fig. 7. Independent analysis of SS14 and Nichols phylodynamics shows differential patterns of expansion and decline.
A – Independent Bayesian Skyline plots for Nichols- and SS14- lineages. B – Independent lineages through time plot for Nichols- and SS14-lineages. Skyline analysis indicates expansion of SS14-lineage after 2000 coincided with a decline of Nichols-lineage. However, analysis of lineage accumulation through time shows that both SS14 and Nichols continued to expand after 2000; whilst this is visible as a steep slope from 2000 in SS14, rapid expansion for Nichols occurred after 2010.
Extended Data Fig. 8
Extended Data Fig. 8. Effect of geographic distance on genetic distance.
A- Pairwise comparison of genetic distance (SNPs) and geographic distance (km; calculated using country centroids) within Nichols- and SS14-lineages, including linear regression (95% CI not visible). B- Pairwise comparison of genetic distance (SNPs) and geographic distance (km; calculated using country centroids) within the four major multi-country sublineages (SS14: 1, 2; Nichols: 8, 14). Includes linear regression (95% CI not visible).
Extended Data Fig. 9
Extended Data Fig. 9. Sharing of sublineages and closely related strains within and between British Columbia (Canada) and England (UK).
A- Syphilis incidence per 100,000 population by year for British Columbia, (Canada) and England (UK) using currently published data. B- TPA sublineage counts for each year, using high quality genomes from British Columbia (n = 84) and England (n = 240). British Columbia samples collected from 2000-2018, English samples collected from 2012-2018. C- Pairwise comparison of SNP distance distributions from samples within and between British Columbia and England. D- Comparison of SNP distance and temporal distance within and between British Columbia and England. The plot is divided into hexagonal bins, with the colour of each hexagon representing the number of comparisons (white = none, purple = few, green = many, see scale). Linear regression lines also shown (95% CI not visible).
Extended Data Fig. 10
Extended Data Fig. 10. Multicountry sublineages are broadly macrolide resistant.
A- Whole genome phylogeny showing distribution of macrolide resistance conferring SNPs (A2058G and A2059G). B- Distribution of macrolide resistance SNPs by sublineage, indicating number of samples per sublineage, and sublineage type. Note that while the common A2058G mutation was found in six sublineages (both Nichols- and SS14-lineages), we also found the less common A2059G in both SS14-lineage (sublineages 1, 2) and Nichols-lineage (sublineage 6).

Comment in

References

    1. McGough, L. J. & Erbelding, E. in Pathogenic Treponema: Molecular and Cellular Biology (eds Radolf, J. D. & Lukehart, S. A.) 183–195 (Caister Academic Press, 2006).
    1. Baker BJ, et al. Advancing the understanding of treponemal disease in the past and present. Am. J. Phys. Anthropol. 2020;171:5–41. - PubMed
    1. Arora N, et al. Origin of modern syphilis and emergence of a pandemic Treponema pallidum cluster. Nat. Microbiol. 2016;2:16245. - PubMed
    1. Beale MA, et al. Genomic epidemiology of syphilis reveals independent emergence of macrolide resistance across multiple circulating lineages. Nat. Commun. 2019;10:3255. - PMC - PubMed
    1. Giffin K, et al. A treponemal genome from an historic plague victim supports a recent emergence of yaws and its presence in 15th century Europe. Sci. Rep. 2020;10:9499. - PMC - PubMed

Publication types

MeSH terms