. 2021 Dec;600(7887):110-115.
doi: 10.1038/s41586-021-04091-0. Epub 2021 Nov 24.

The human microbiome encodes resistance to the antidiabetic drug acarbose

Affiliations

The human microbiome encodes resistance to the antidiabetic drug acarbose

Jared Balaich et al. Nature. 2021 Dec.

Abstract

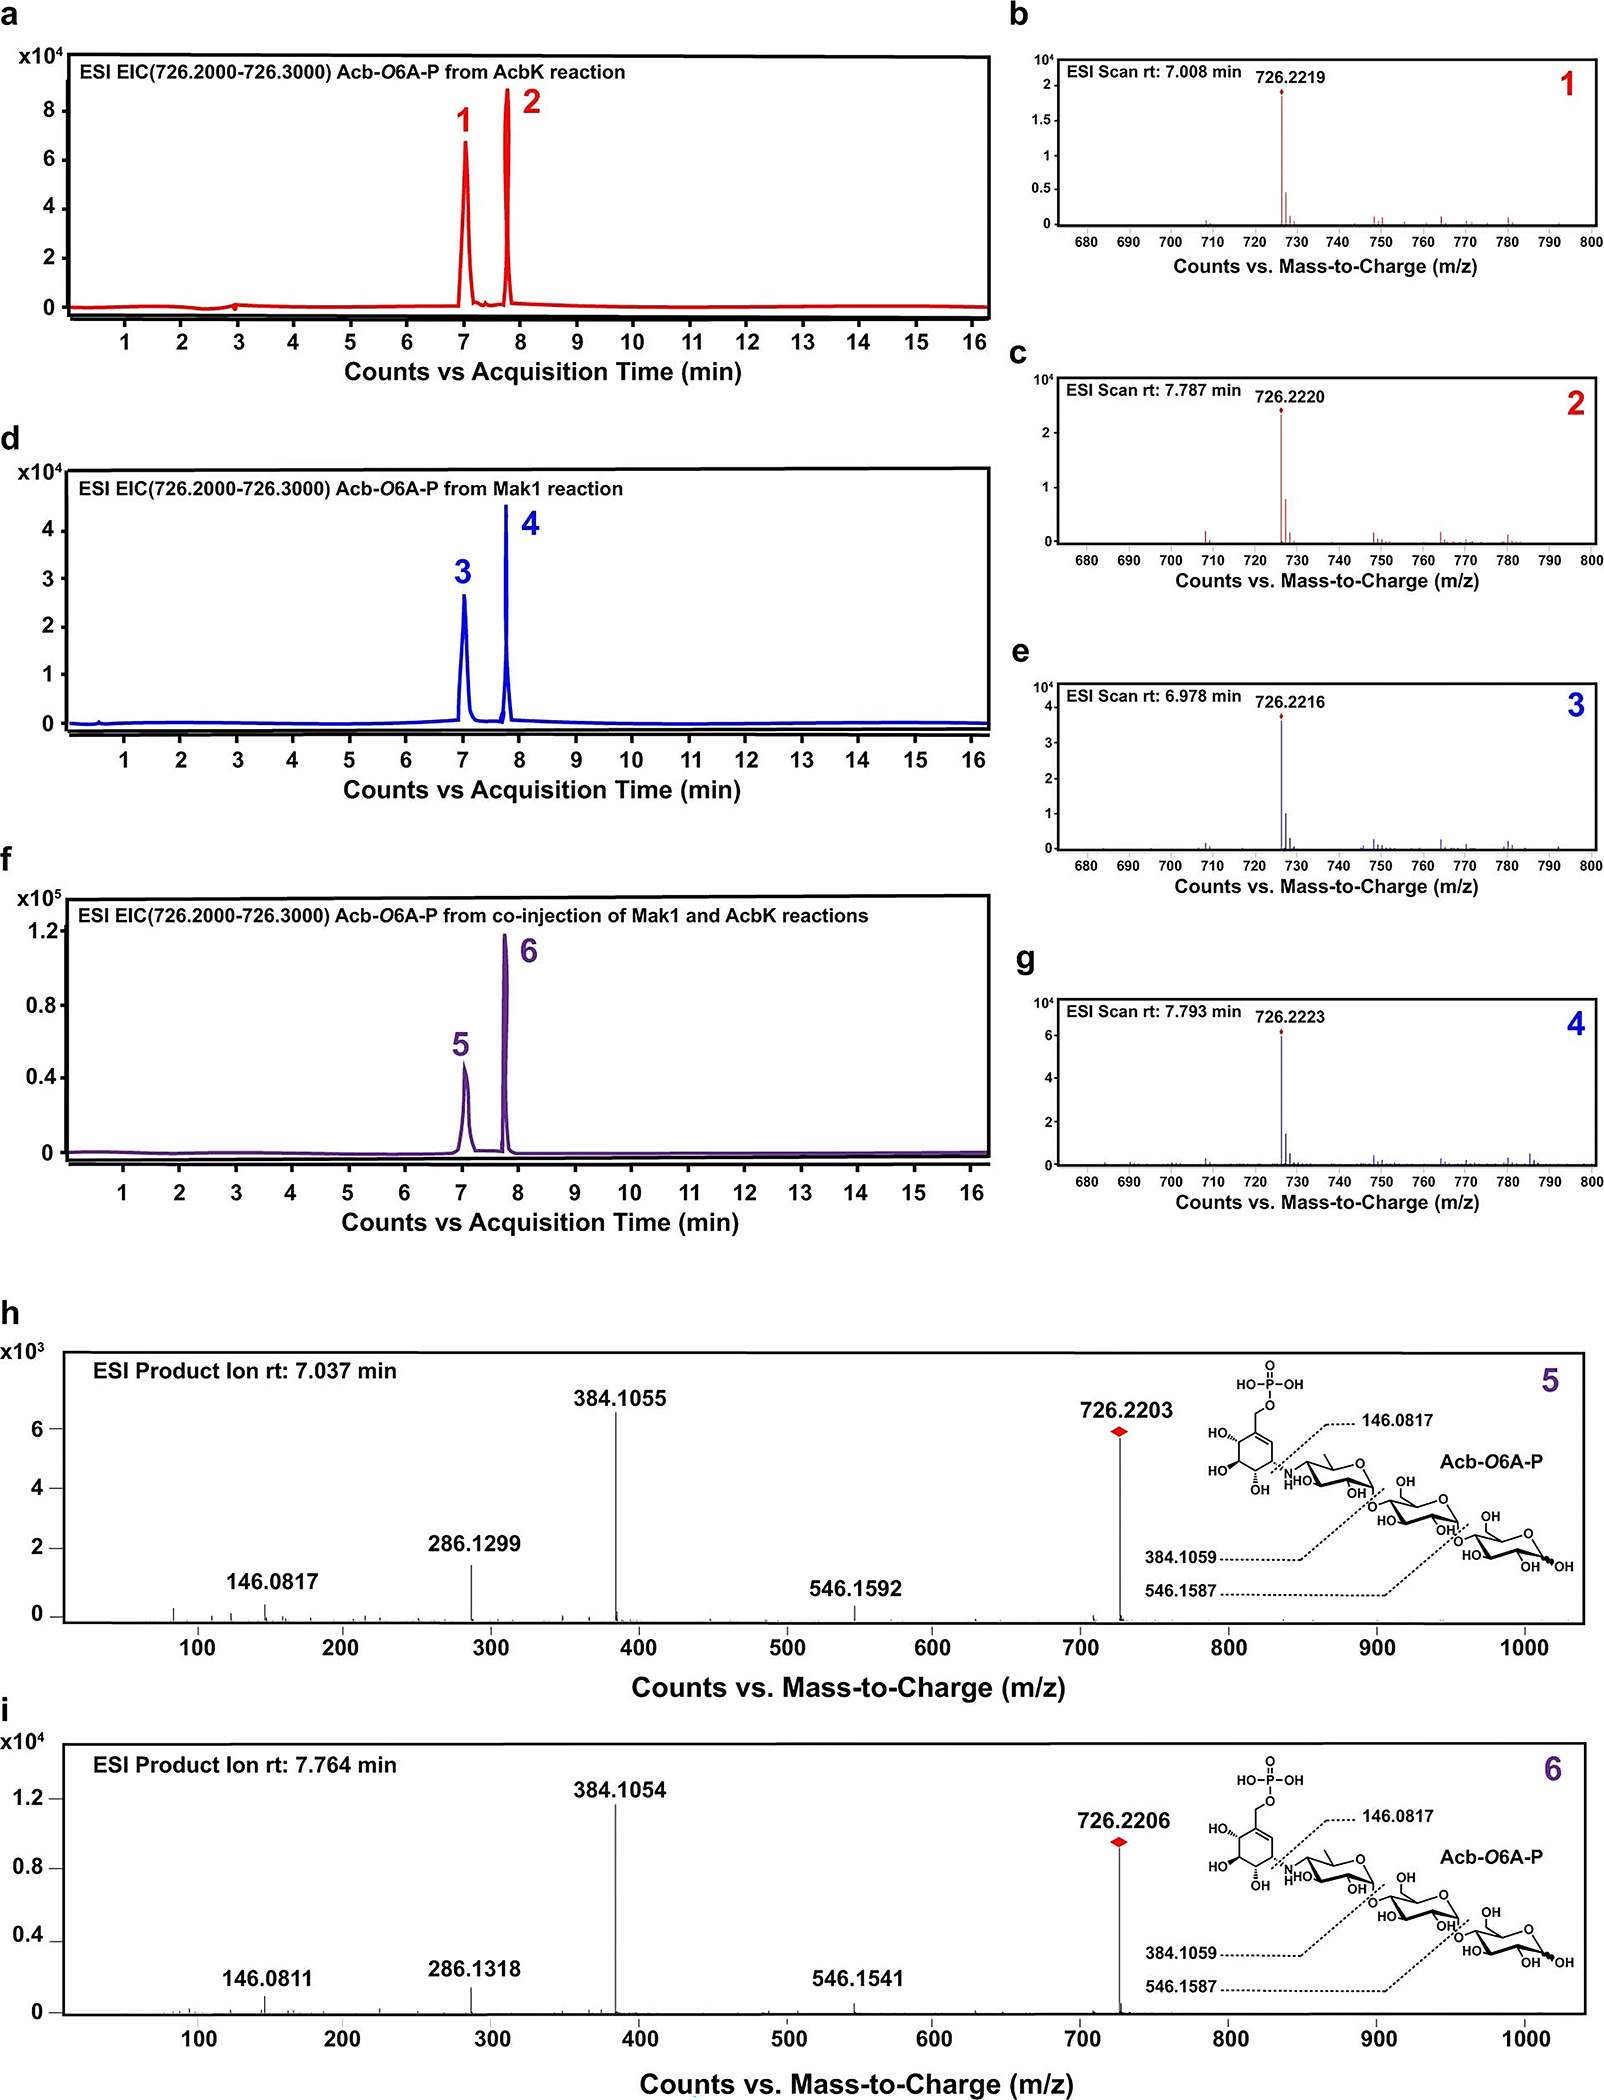
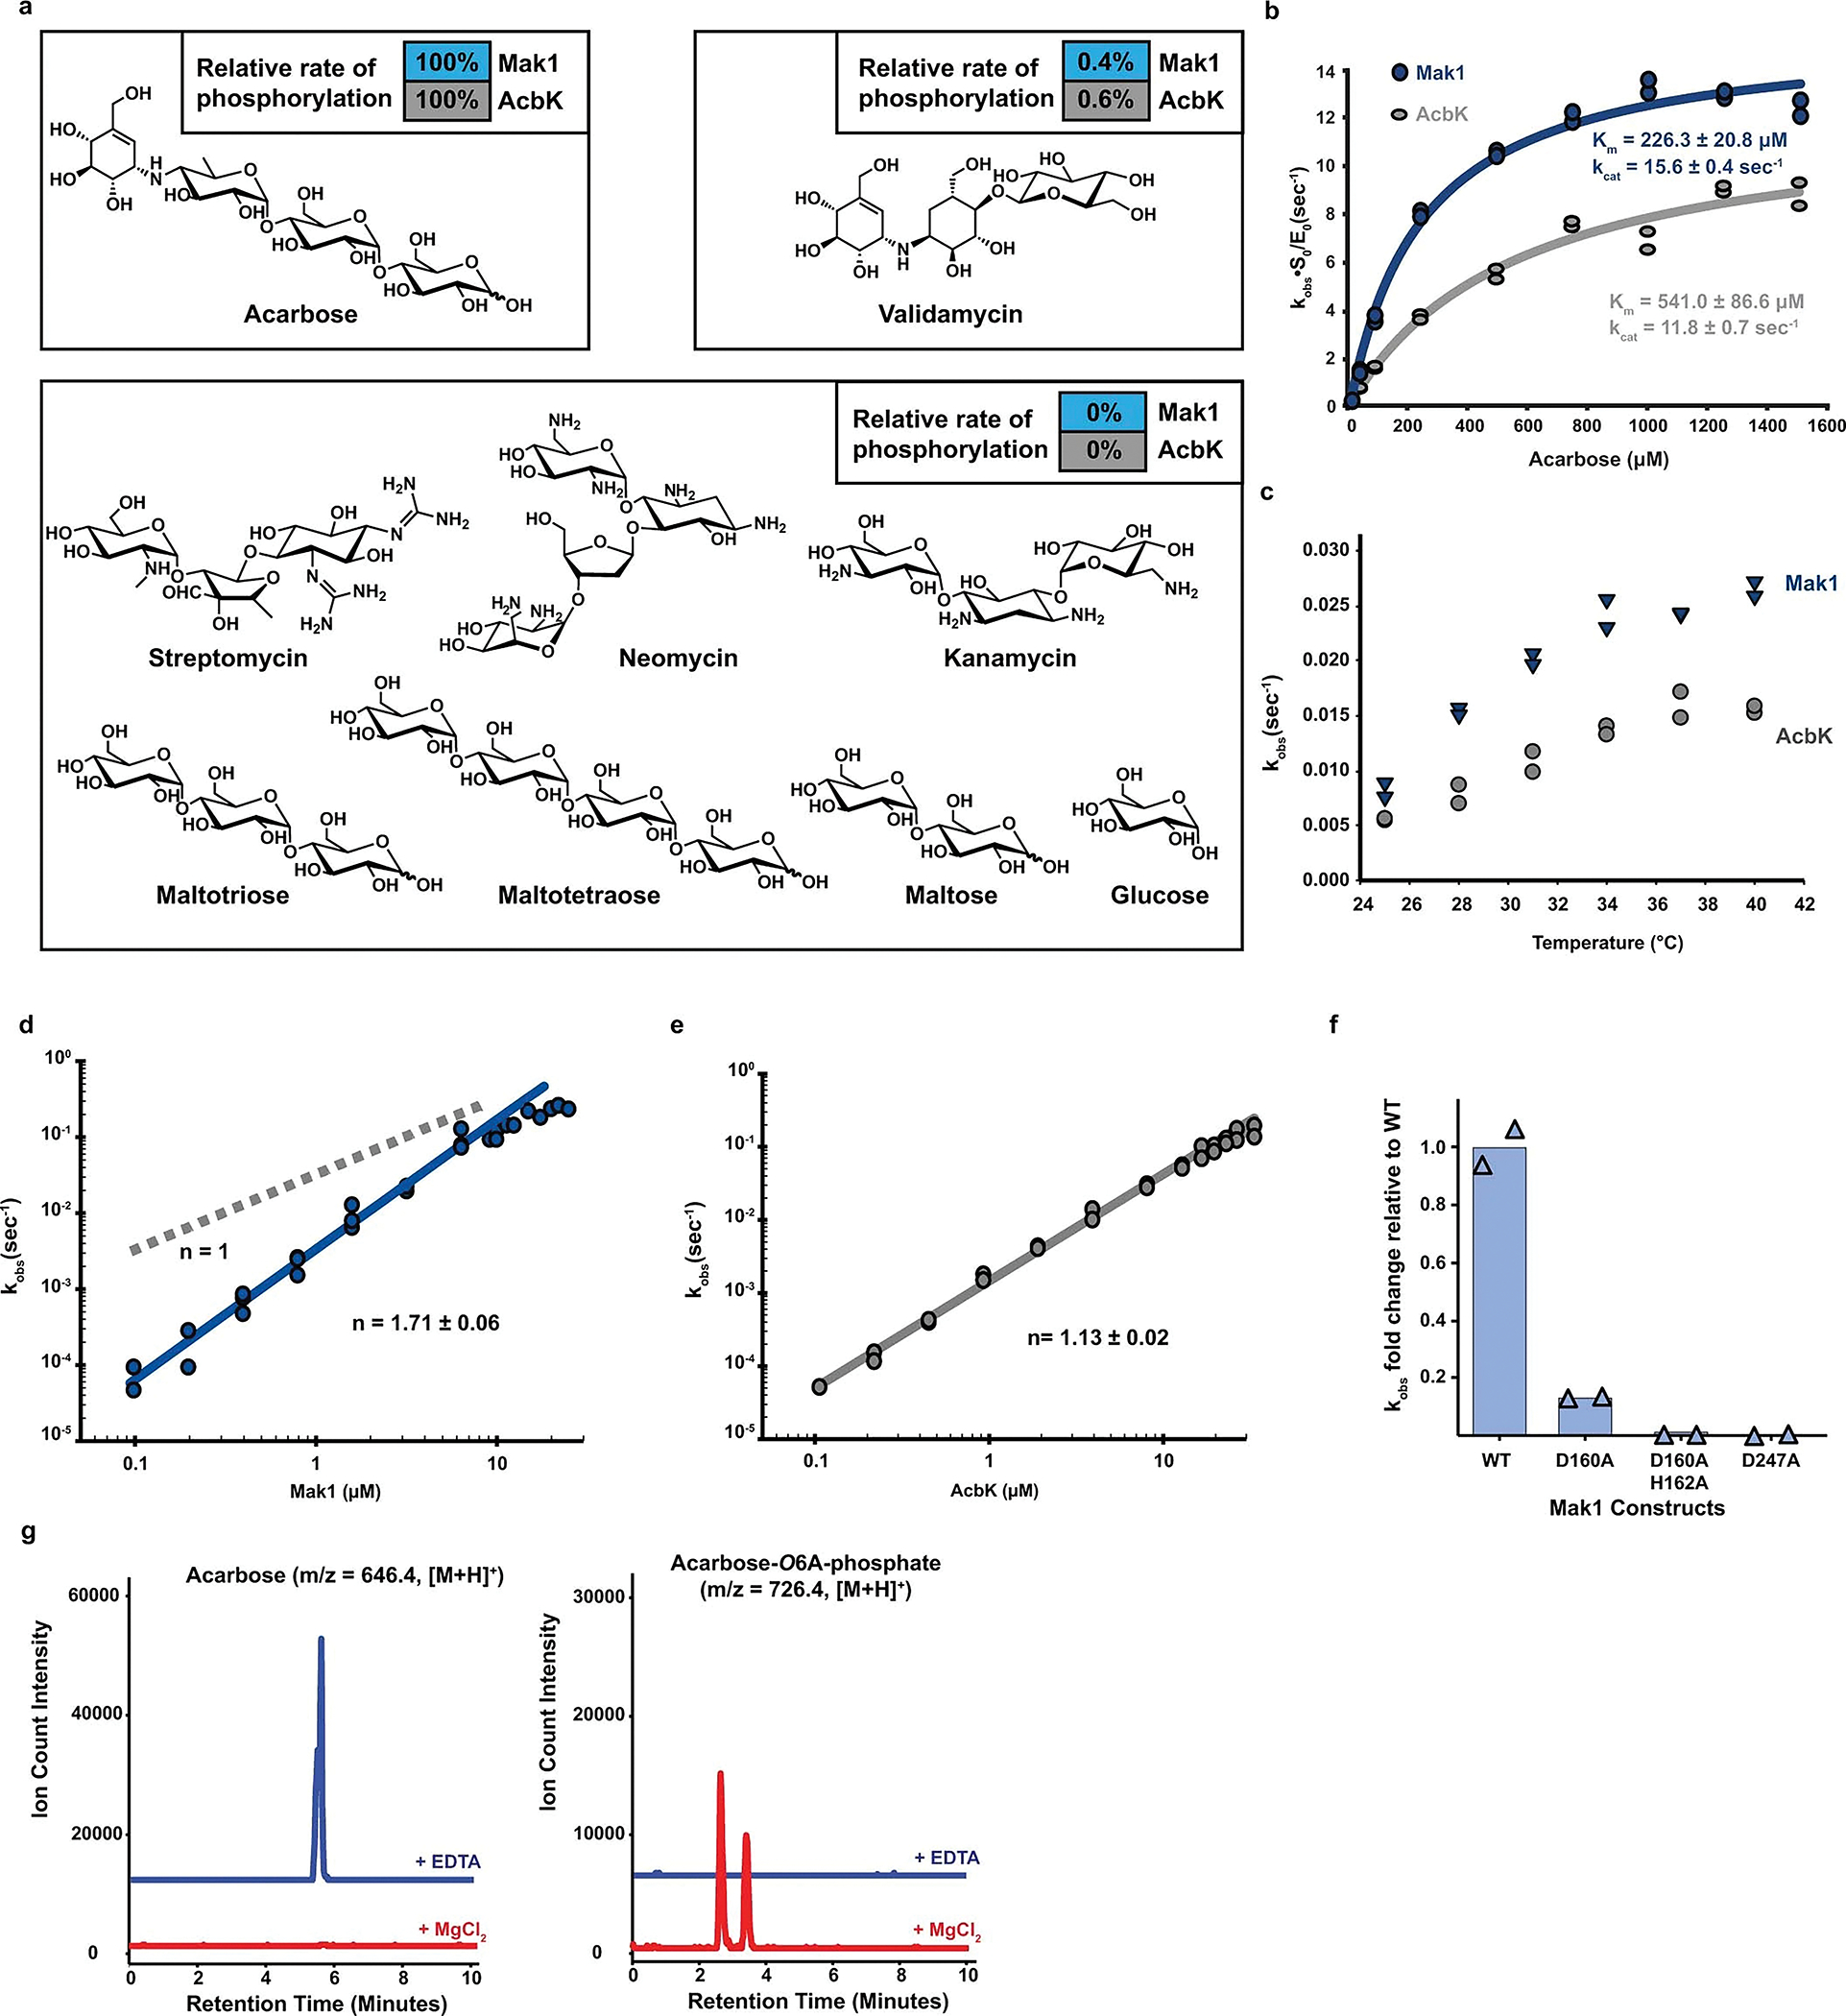
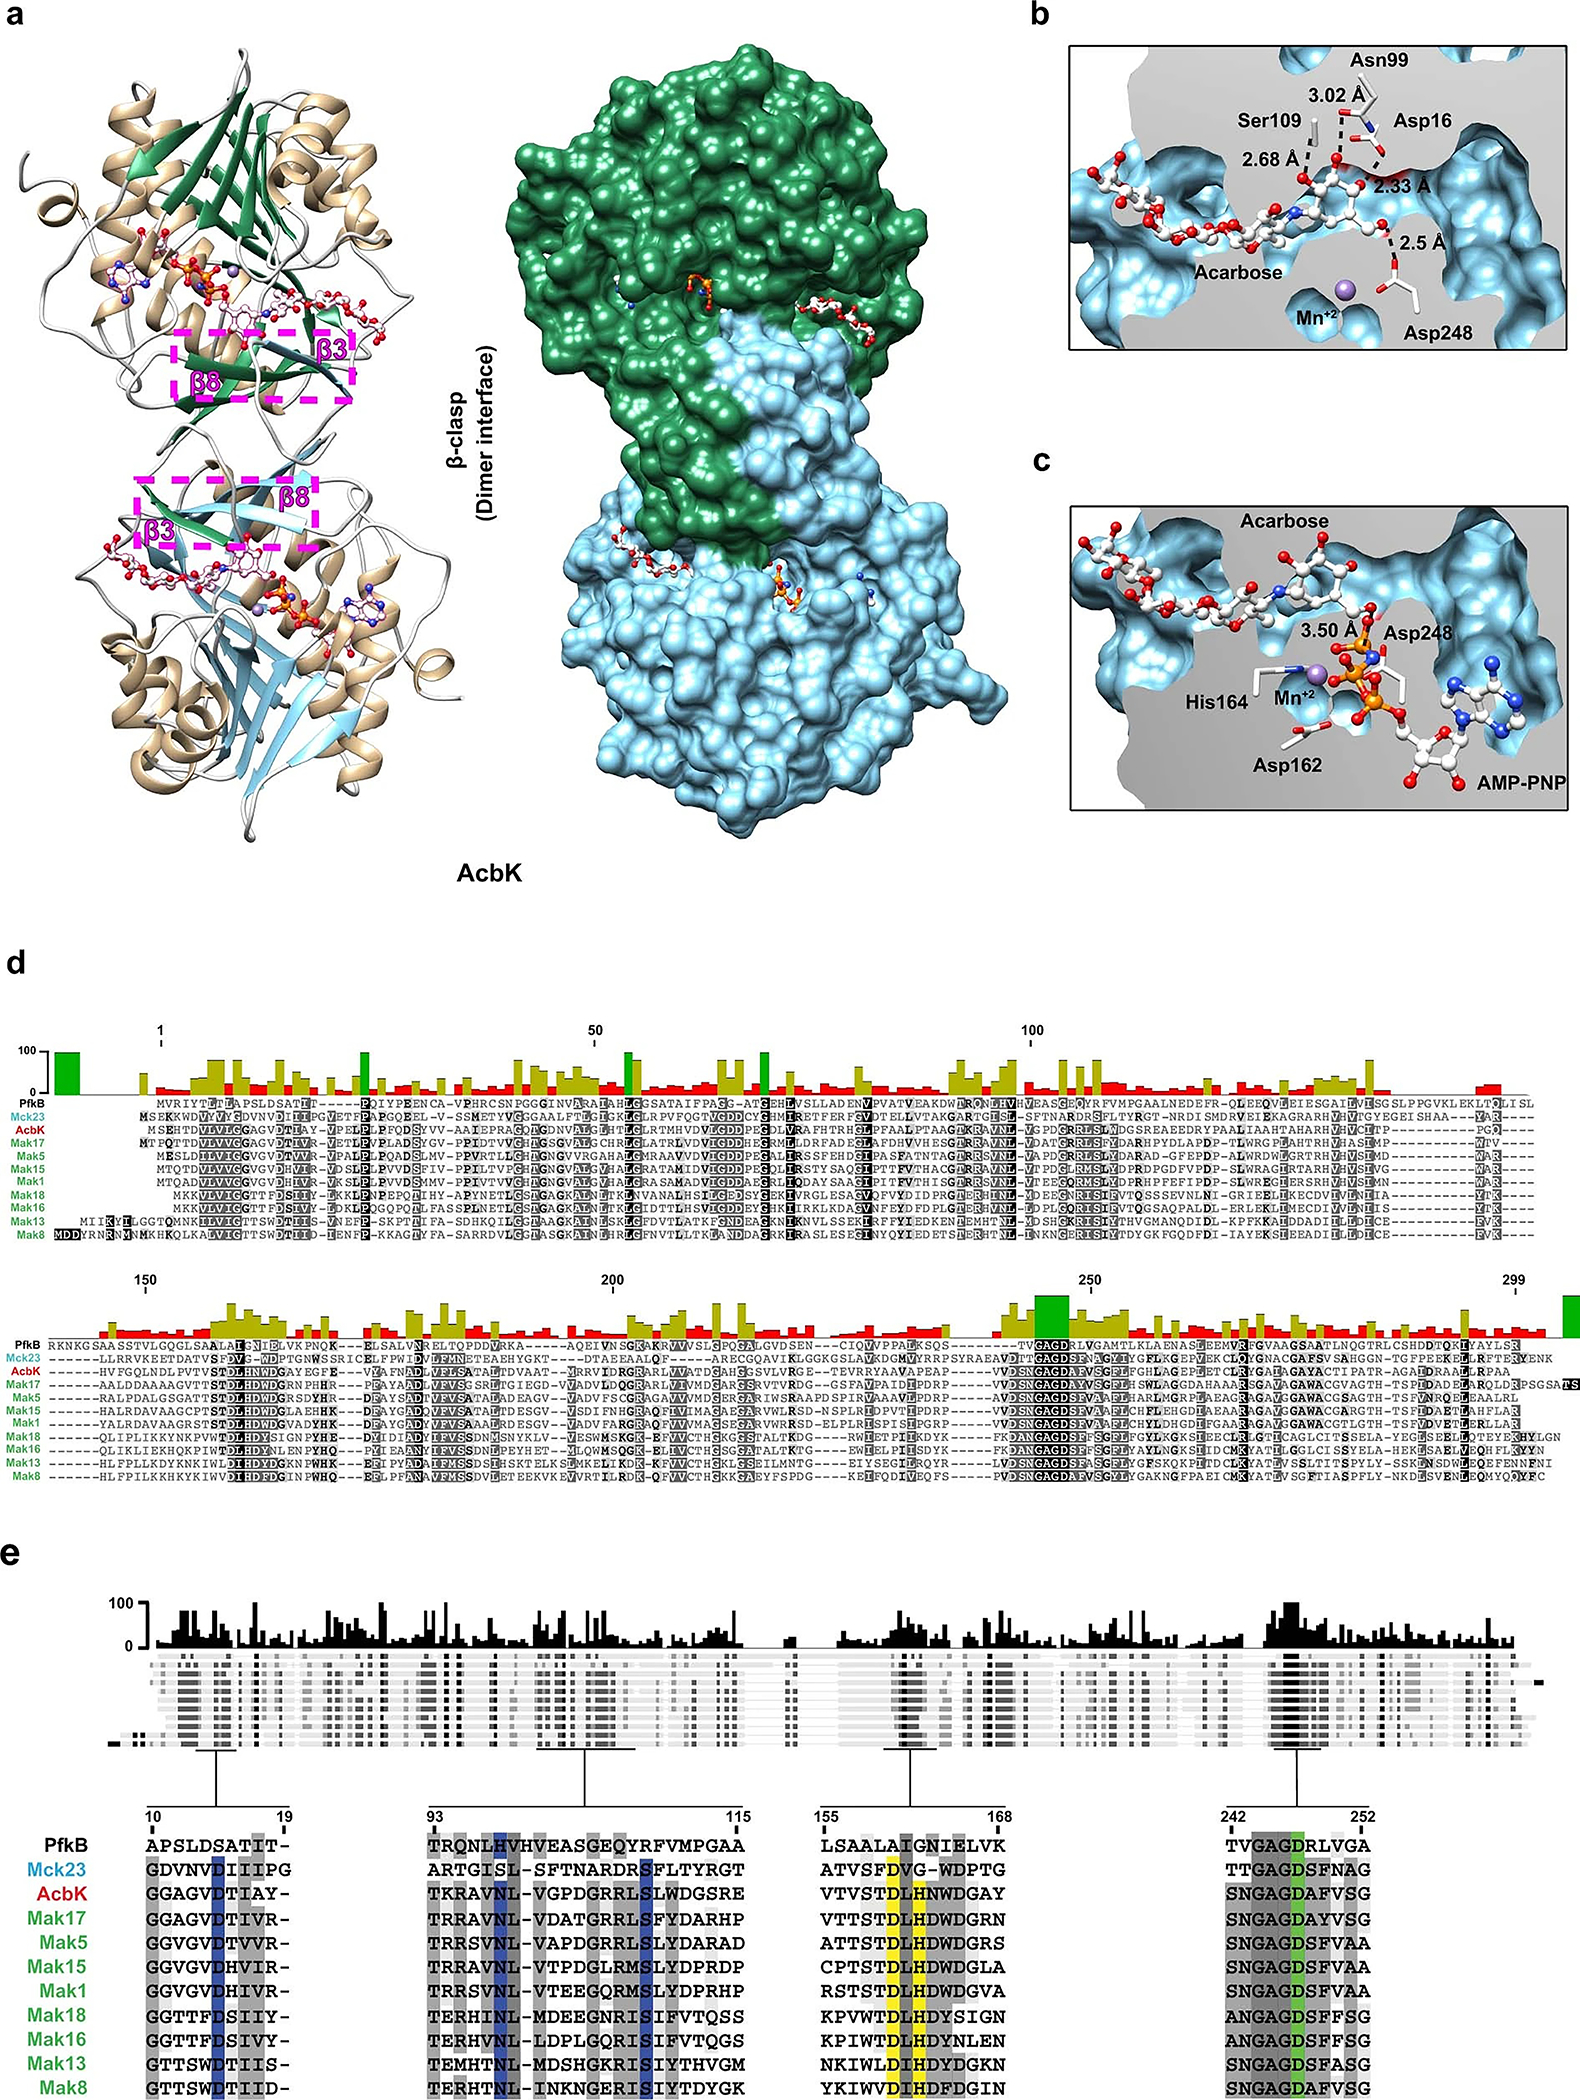
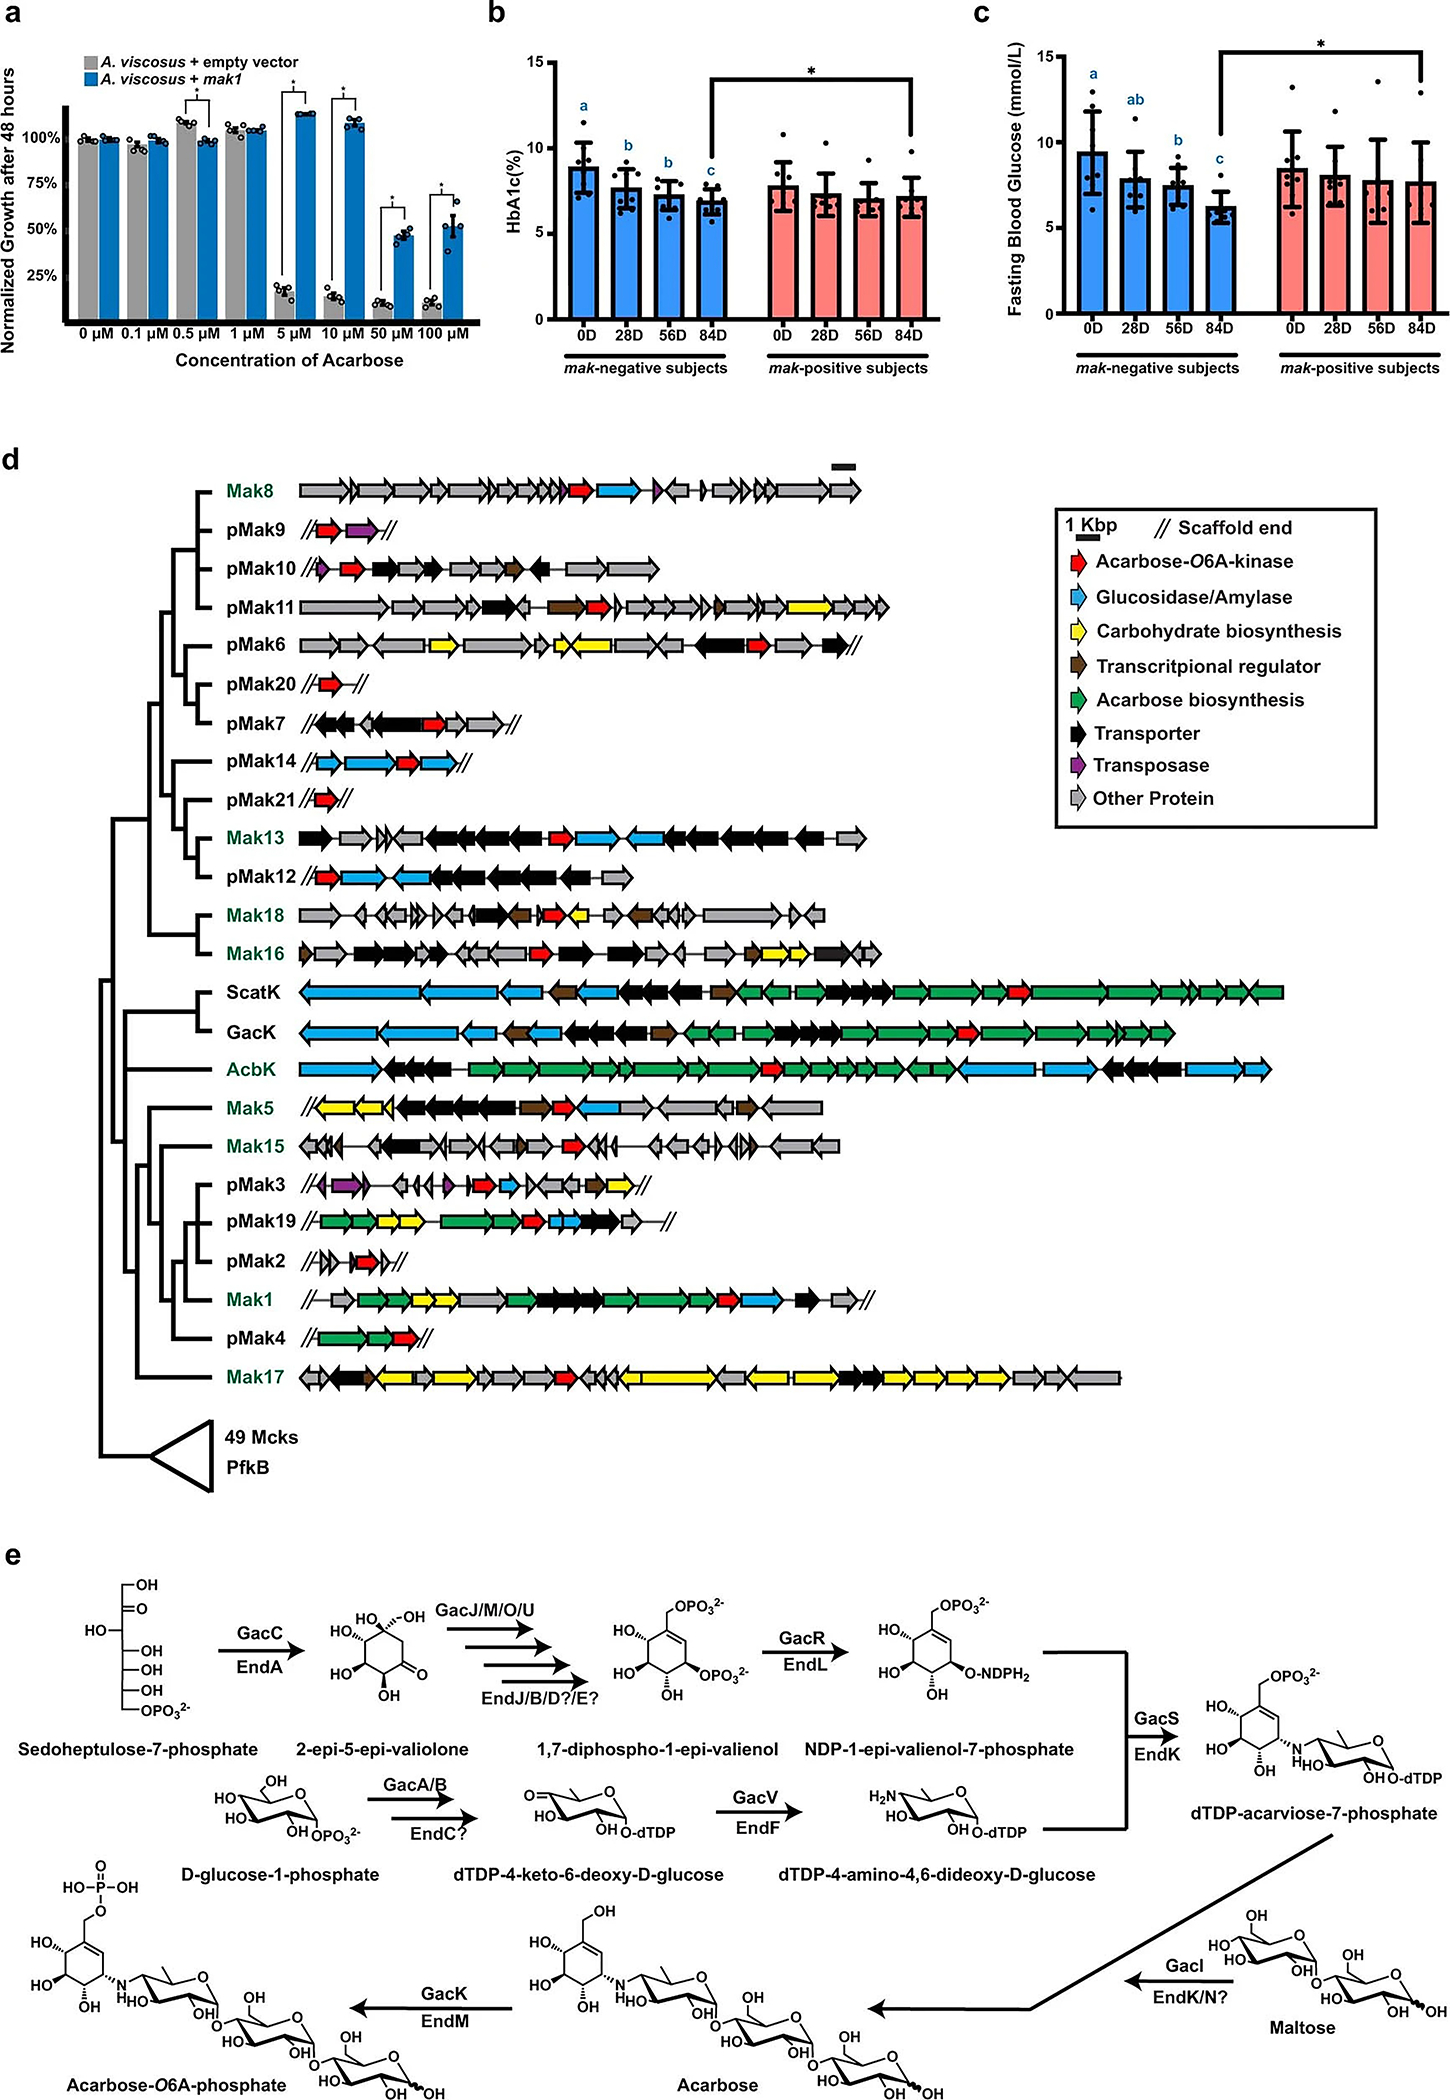
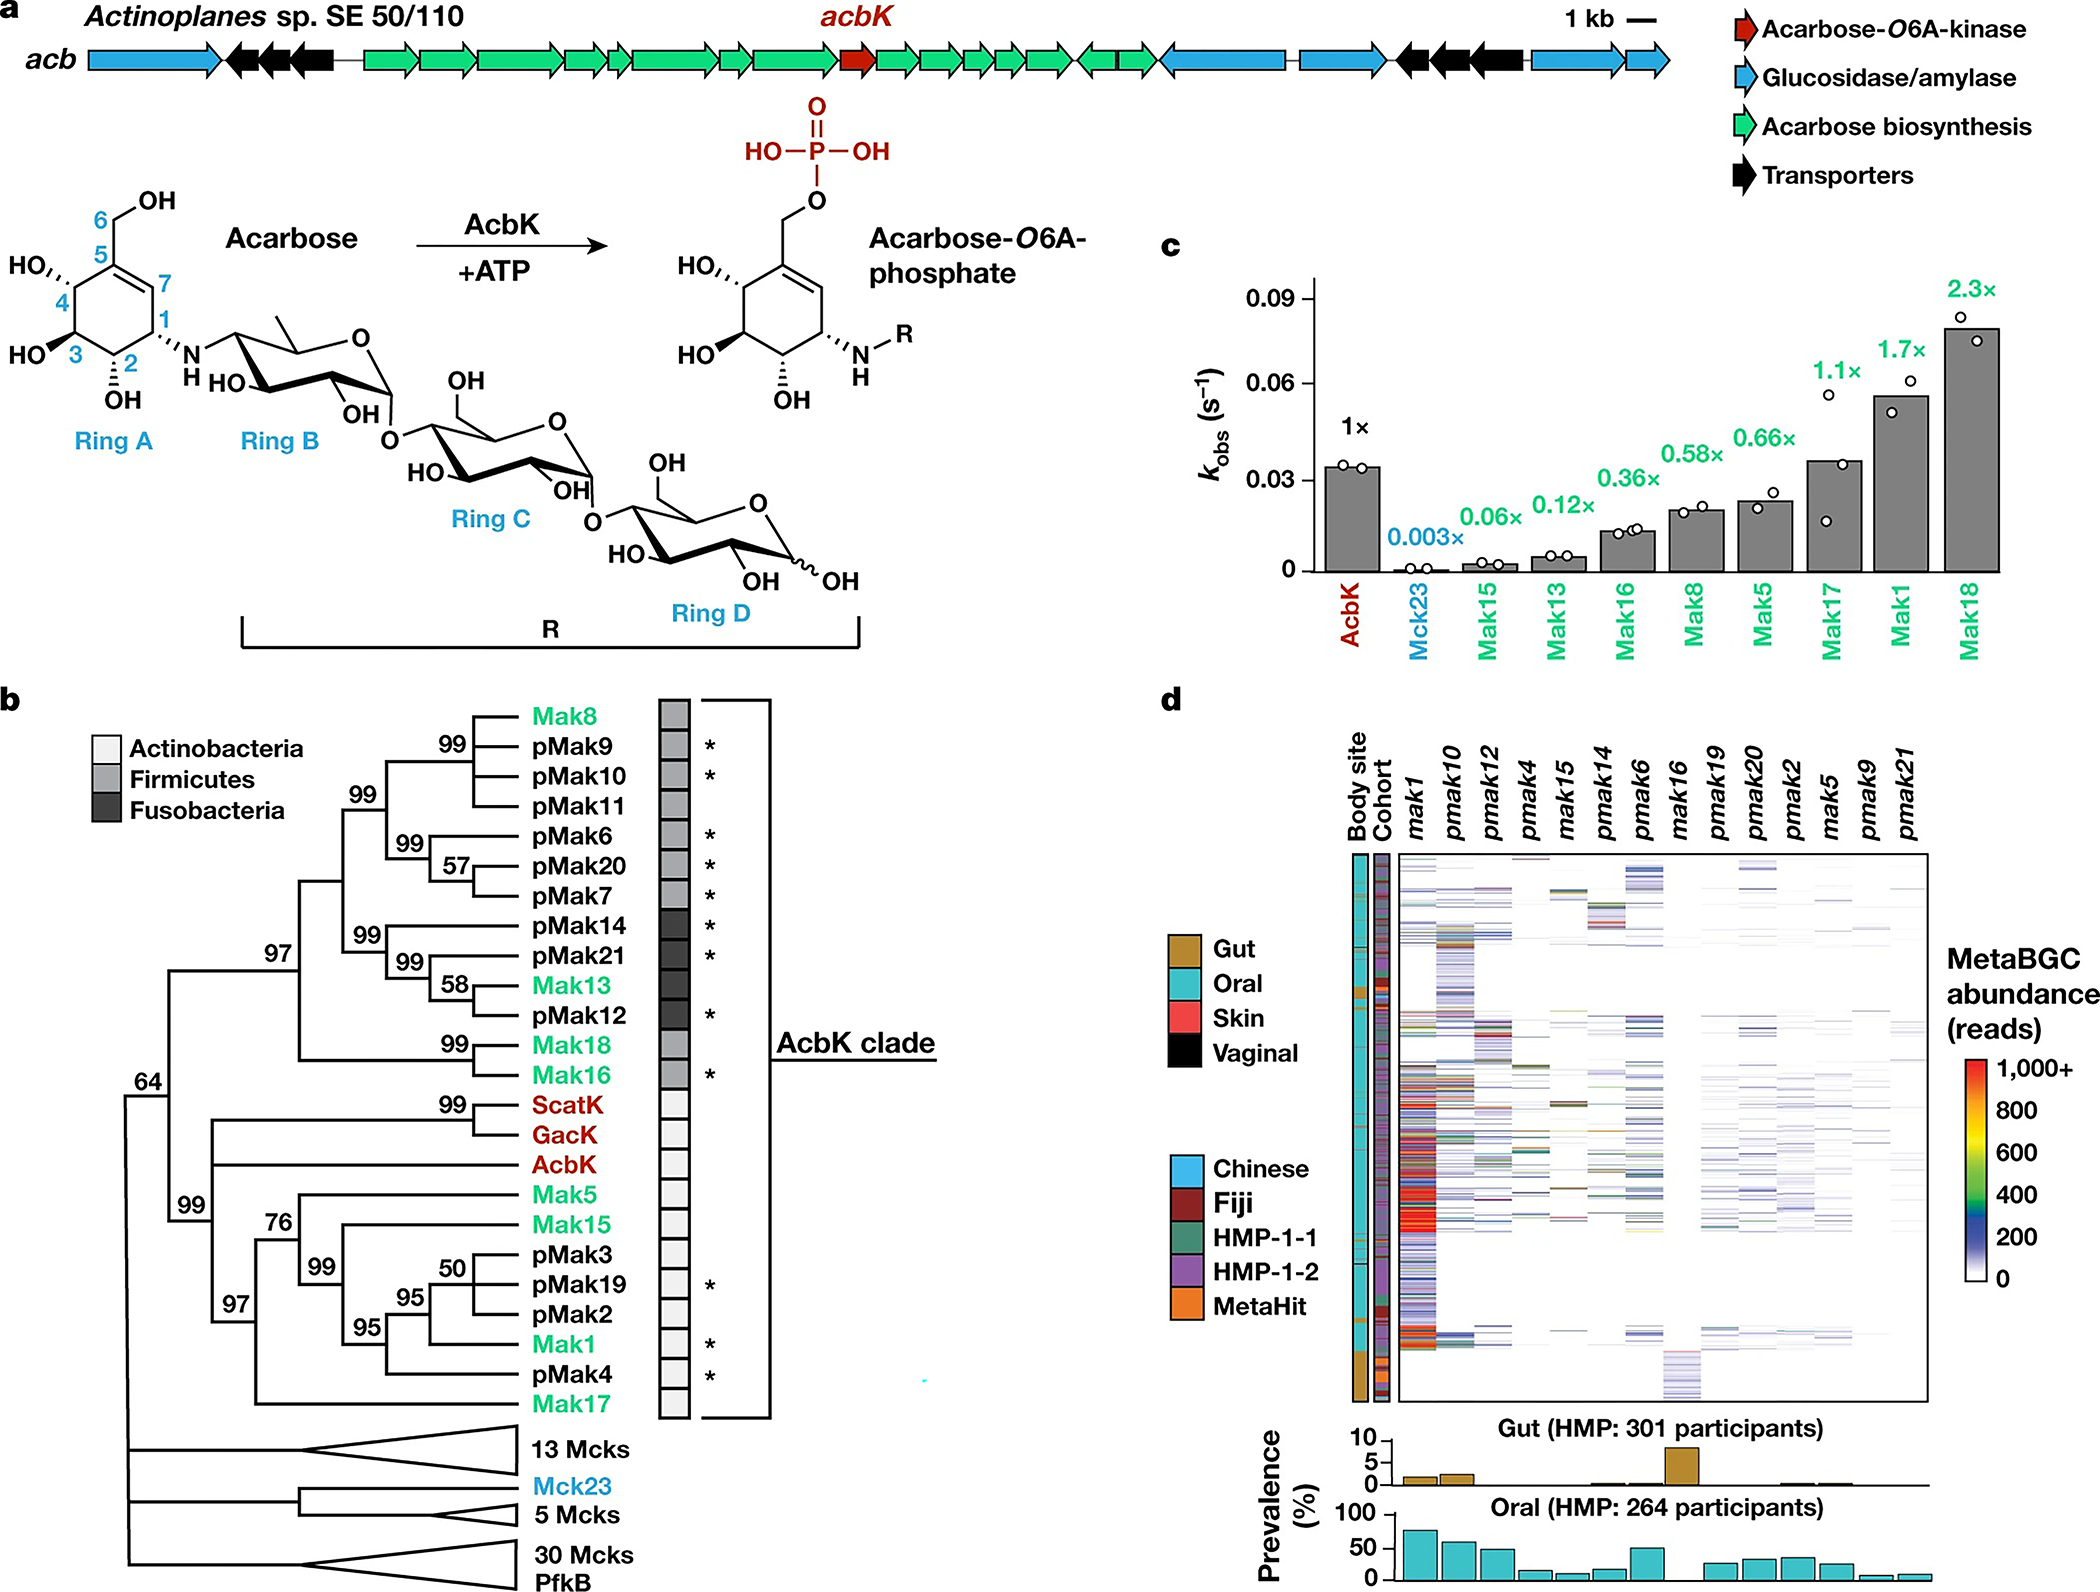
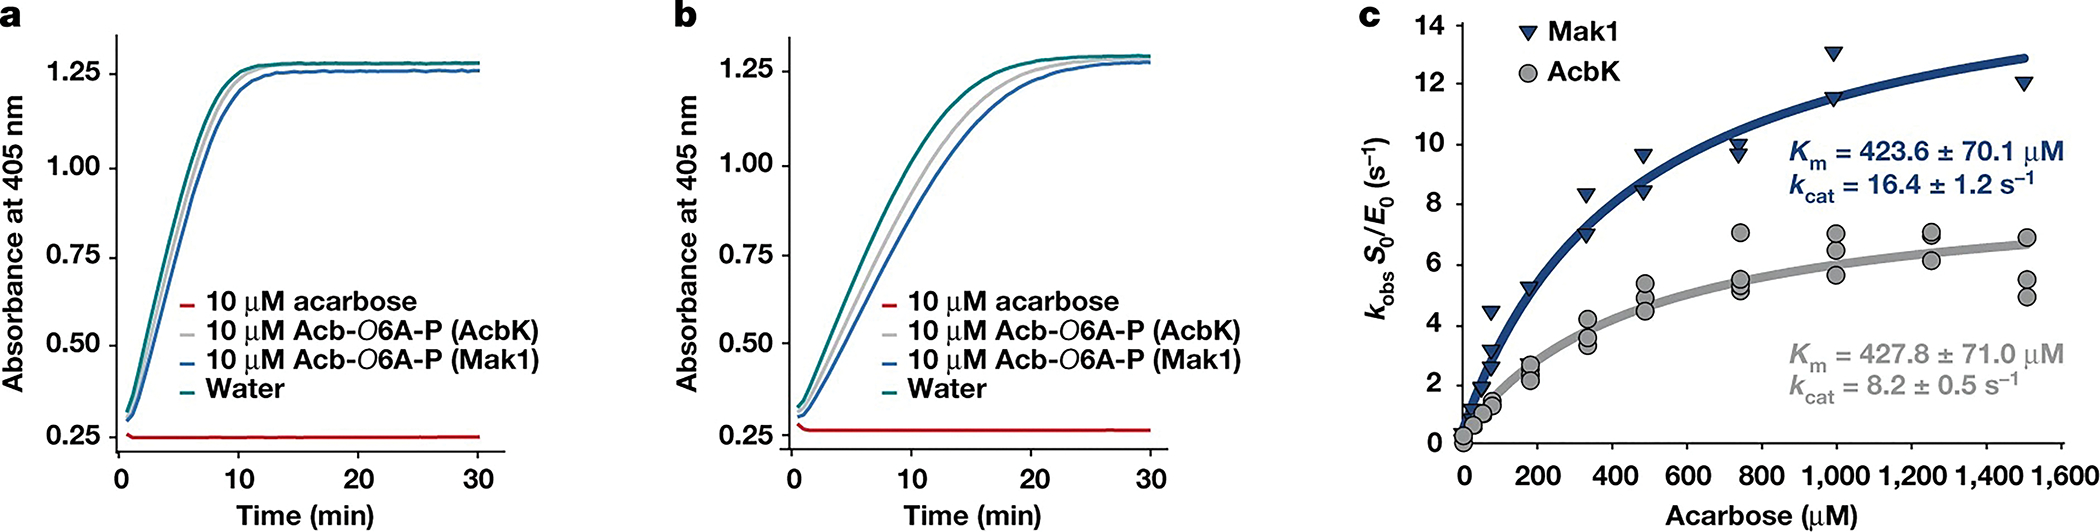
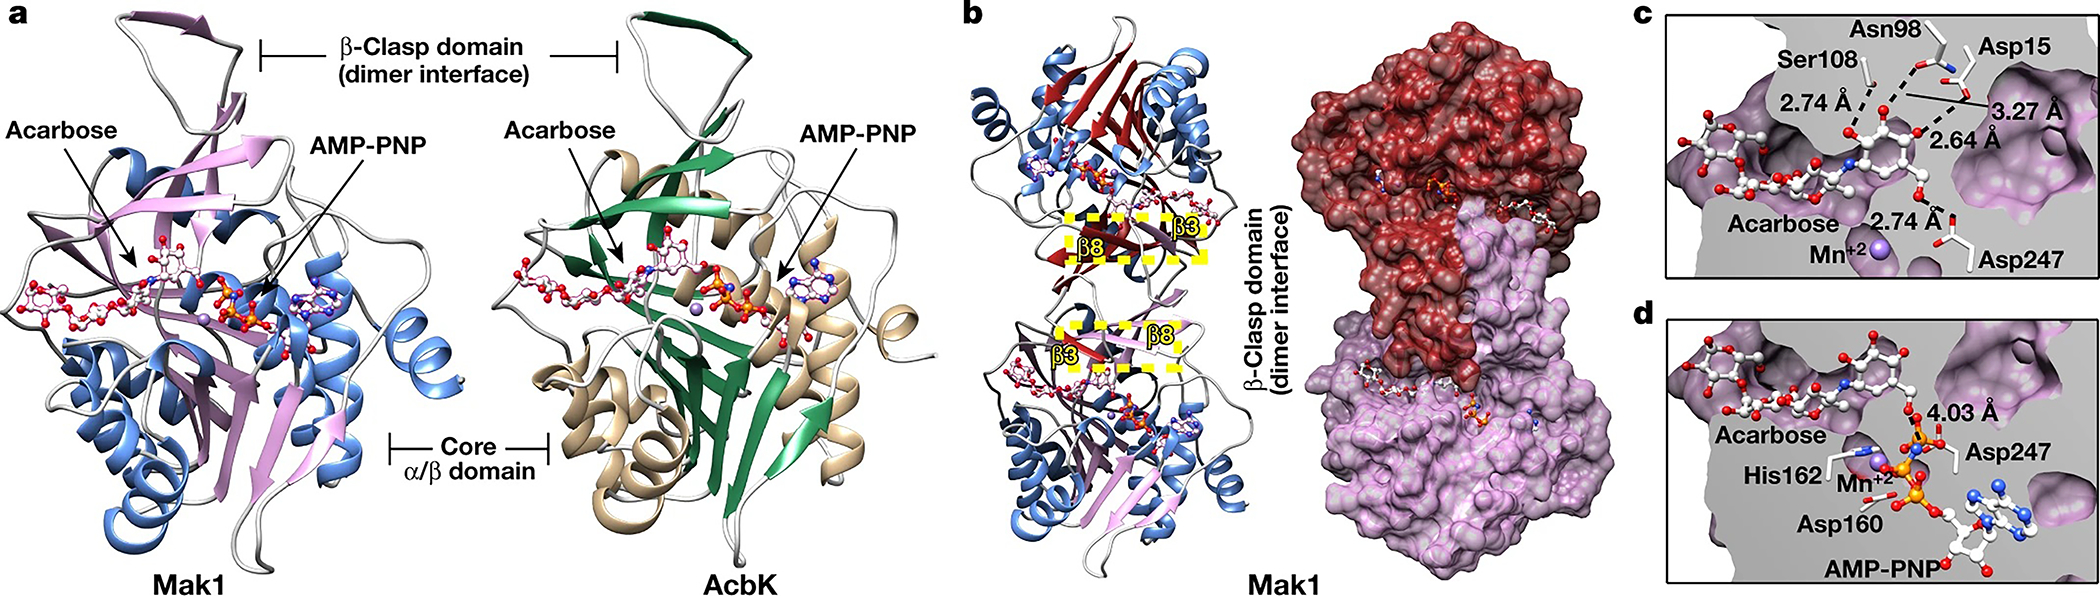
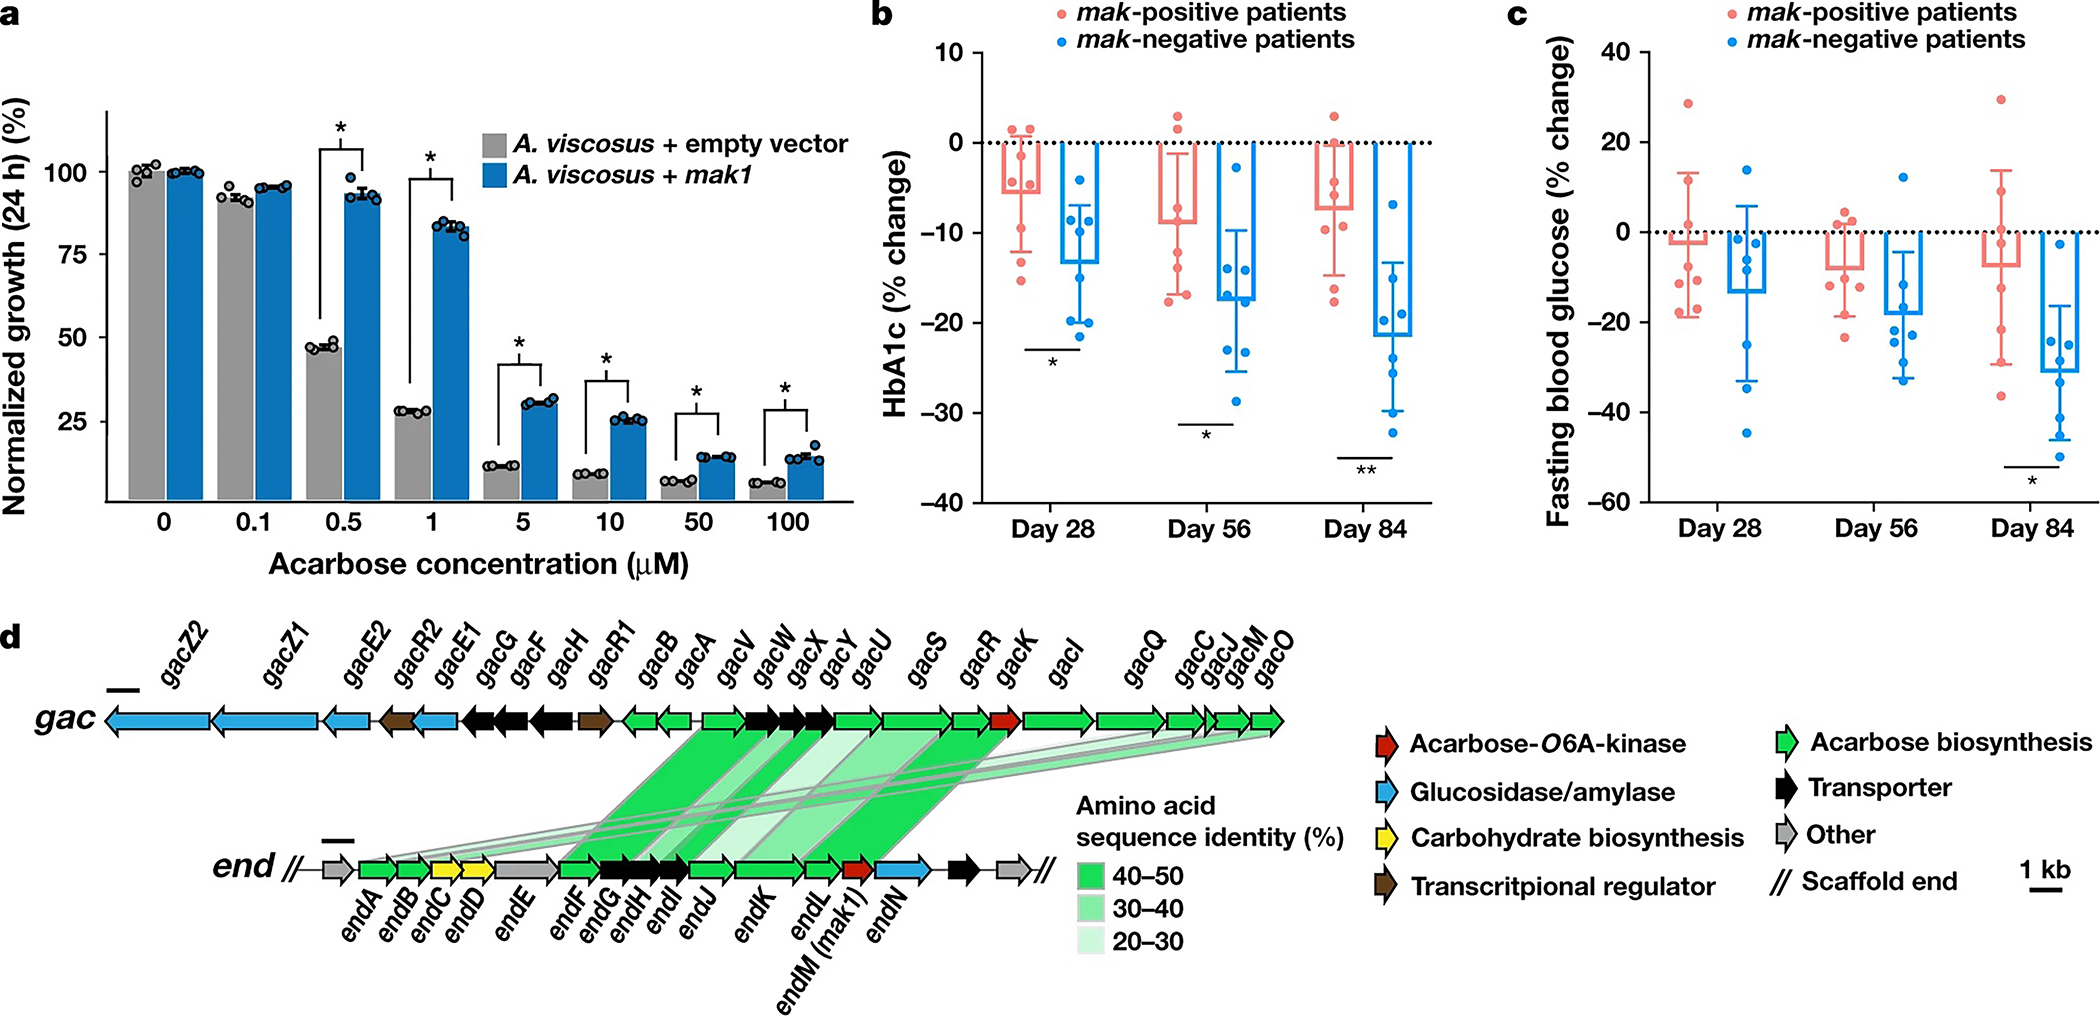
The human microbiome encodes a large repertoire of biochemical enzymes and pathways, most of which remain uncharacterized. Here, using a metagenomics-based search strategy, we discovered that bacterial members of the human gut and oral microbiome encode enzymes that selectively phosphorylate a clinically used antidiabetic drug, acarbose1,2, resulting in its inactivation. Acarbose is an inhibitor of both human and bacterial α-glucosidases3, limiting the ability of the target organism to metabolize complex carbohydrates. Using biochemical assays, X-ray crystallography and metagenomic analyses, we show that microbiome-derived acarbose kinases are specific for acarbose, provide their harbouring organism with a protective advantage against the activity of acarbose, and are widespread in the microbiomes of western and non-western human populations. These results provide an example of widespread microbiome resistance to a non-antibiotic drug, and suggest that acarbose resistance has disseminated in the human microbiome as a defensive strategy against a potential endogenous producer of a closely related molecule.


Conflict of interest statement

Competing interests M.S.D. is a member of the scientific advisory board of Deepbiome Therapeutics, and L.Z. is a co-founder of Notitia Biotechnologies.

Figures

Extended Data Fig. 1 |
Extended Data Fig. 1 |. Identification of AcbK homologues using MetaBGC.
a. Number of true positive (TP) reads identified in synthetic metagenomic dataset number 2 for all spHMMs created by MetaBGC-Build. b. Number of false positive (FP) reads identified in synthetic metagenomic dataset number 2 for all spHMMs created by MetaBGC-Build. c. F1 scores of all spHMMs created by MetaBGC-Build. Only spHMMs with F1 scores ≥ 0.5 were used in MetaBGC-Identify runs with real metagenomic data. d. spHMM logos for spHMMs included in MetaBGC-Identify. Please see Supplementary Table 2 for spHMM cutoffs used for all intervals.
Extended Data Fig. 2 |
Extended Data Fig. 2 |. Phylogenetic analysis of Mcks/Maks and prevalence of selected maks and pmaks in metagenomic samples of various human cohorts.
a. A maximum likelihood phylogenetic tree for all AcbK homologues discovered in this study (Mcks). The tree was constructed using MEGA7, with bootstrap values of more than 50% out of 1000 replicates displayed at the branch points (see Methods). The tree includes previously characterized acarbose kinases from soil-derived Actinobacteria (red label, AcbK, GacK, and ScatK), the canonical phosphofructokinase from E. coli (PfkB), Mcks that were experimentally verified to have (green label, designated as Maks) or lack (blue label) an acarbose-O6A-kinase activity, and ones that have not been experimentally tested (black label). pMaks indicate putative Maks in the AcbK clade. b. Prevalence of selected maks and pmaks expressed as the percentage of positive individuals out of the total, across different cohorts and sampling sites and subsites (brown: gut; teal: oral). The total number of individuals in each cohort is indicated above their corresponding bar chart. Prevalence of all mcks in all cohorts can be found in Supplementary Table 2.
Extended Data Fig. 3 |
Extended Data Fig. 3 |. Purification and biochemical characterization of a subset of Mcks/Maks.
a. Fast Protein Liquid Chromatography (FPLC) chromatograms of AcbK (a) and Mck1/Mak1 (b) purification by size exclusion chromatography, monitored at the indicated absorbance wavelengths. Coomassie stained SDS-PAGE of the collected fraction is shown on the right side of each chromatogram. c. Coomassie stained SDS-PAGE of the collected fractions for the eight additional Mcks that were tested. All Mcks were purified in the same manner as AcbK and Mck1/Mak1 (see Methods). The data shown in a, b are representative examples from among at least three different times the same experiment was performed and produced similar results. The data shown in in c is a representative example from among at least two different times the same experiment was performed and produced similar results. d. Representative Extracted Ion Chromatograms (EICs) for acarbose (m/z = 646.4, [M+H]+) from the products of a reaction of Mck1/Mak1 (red) or a no-protein control (blue) with acarbose. e. Representative EICs for acarbose-O6A-phosphate (m/z = 726.4, [M+H]+) from the products of a reaction of Mck1/Mak1 (red) or a no-protein control (blue) with acarbose (the two peaks have identical MS, HRMS, and HRMS/MS and are likely isomers of the same molecule or charge variants that elute differently, as seen with AcbK, see Extended Data Fig. 5). This product is often referred to as acarbose-7-phosphate in the literature, but for consistency, we will refer to all acarbose positions based on their displayed numbering in Fig. 1a, which matches previous PDB depositions (PDB Ligand Code: ACR). Note the complete conversion of acarbose to acarbose-O6A-phosphate. See Methods for the complete experimental details.
Extended Data Fig. 4 |
Extended Data Fig. 4 |. Abundances of all metagenomic read bins discovered by MetaBGC.
Heatmap showing the abundance of all identified bins in the five analysed cohorts as calculated by MetaBGC, and following the colour codes to the right. See Supplementary Table 2 for the complete results of this analysis and Supplementary Table 1 for corresponding Mck/Mak identifiers for each bin. Samples that had no reads mapped to any bin were excluded from the heatmap. Hierarchical clustering of the samples and bins was performed using UPGMA (unweighted pair group method with arithmetic mean) in pheatmap in R.
Extended Data Fig. 5 |
Extended Data Fig. 5 |. HPLC-HR-MS and HPLC-HR-MS/MS analyses of acarbose-O6A-phosphate produced by AcbK and Mak1.
Extracted ion Chromatograms (EICs) of acarbose-O6A-phosphate produced by AcbK (a), Mak1 (d), and a co-injection of the two (f), indicating that their products are identical. EIC is displayed for m/z = 726.2–726.3 [M+H]+ in all cases. b, c, e, g, HR-MS of the two acarbose-O6A-phosphate peaks produced by either AcbK (b, c) or Mak1 (e, g), following the numbering scheme on the individual EIC peaks. h, i, identical HR-MS/MS fragmentation patterns of the two EIC peaks of acarbose-O6A-phosphate from the co-injection analysis in f. The structure of acarbose-O6A-phosphate is shown on the right, along with its predicted fragments and their calculated mass to charge ratios that match observed ones.
Extended Data Fig. 6 |
Extended Data Fig. 6 |. Additional biochemical characterization of Mak1 and AcbK.
a. Phosphorylation rates (relative to the acarbose phosphorylation rate, which is set as 100%) at which Mak1 and AcbK phosphorylate a diverse panel of carbohydrates and aminoglycosides with structural similarities to acarbose. No phosphorylation was detected for all but one (validamycin) of the substrates under the same experimental conditions (see Methods). Experiments were done in duplicates with the average value used for rate comparisons; raw data is available in Supplementary Table 3. b. Michaelis-Menten saturation curves for AcbK (grey) and Mak1 (blue) performed at 1 μm enzyme concentration. Km and kcat values are indicated in their respective colours and individual kobs measurement replicates are shown on the graph for both enzymes. Raw data is available in Supplementary Table 3. c. kobs of both AcbK (grey) and Mak1 (blue) across different temperatures from 25–40 °C in 3 °C steps. The difference in kobs between the two enzymes can be seen across different temperatures. d, e. Hill plot (logarithm of kobs on the the y axis and logarithm of protein concentration on the x axis) of Mak1 (d) and AcbK (e). The Hill coefficient (slope) is greater than 1 for Mak1 (d, n=1.71 ± 0.06, n=1 is shown in grey dashed line for reference) but not for AcbK (e, n=1.13 ± 0.02), suggesting that only Mak1 is a cooperative enzyme. f. Relative change in kobs (y axis) for the single mutants D160A and D247A as well as the double mutant (D160A, H162A) of Mak1 as compared to wild type protein (N = 2). g. Extracted Ion Chromatograms (EICs) for acarbose (left, m/z = 646.4, [M+H]+) and acarbose-O6A-phosphate (right, m/z = 726.4, [M+H]+), showing that the addition of EDTA (blue traces) abolishes the activity of Mak1, while the addition of excess MgCl2 (red traces) restores it.
Extended Data Fig. 7 |
Extended Data Fig. 7 |. Additional structural details of AcbK.
a. AcbK forms homodimers with extensive interactions between the two monomers. These interactions include multiple β strands in the β-clasp domain, most notably the β3 of one monomer and the β8 of the other (magenta highlighted box, with β strands from each monomer shaded differently for clarity). A molecular surface view is shown on the right with one AcbK monomer coloured green and the other coloured blue, highlighting the extensive surface area (1,298 Å2) involved in forming the dimer via the β-clasp domains. b. Zoomed in view of the AcbK substrate binding pocket where an extensive network of hydrogen bonds (from residues Asp16, Asn99, Ser109, and Asp248) form with all the hydroxyl groups in the acarbose A ring and hold it in place. Distances are shown for each of the hydrogen bonds mentioned above. c. Zoomed in view of the AcbK active site with important residues shown (Asp162, His164, Asp248), all involved in priming the O6A hydroxyl of acarbose for nucleophilic attack and in facilitating the transfer of the phosphate from an ATP (AMP-PNP shown) to the O6A hydroxyl of acarbose. Distance shown is from the O6A hydroxyl to the γ-phosphate. d. Full-length amino acid sequence alignment of experimentally tested Mcks/Maks, as well as AcbK and PfkB. The bars on the top of the alignment denote the average pairwise percent identity at each residue. e. Selected segments of the amino acid sequence alignment of experimentally tested Mcks/Maks, as well as AcbK and PfkB. Blue colours highlight amino acid residues that are deemed important for hydrogen bonding with the A ring of acarbose, yellow colours highlight those involved in the transfer of the phosphate group to acarbose and green indicates a residue involved in both processes. Grey colours indicate other conserved residues in the alignment. The bars on the top of the alignment denote the average pairwise percent identity at each residue.
Extended Data Fig. 8 |
Extended Data Fig. 8 |. Additional functional and genetic analyses of maks and end.
a. Normalized bacterial growth at 48 h, measured as the optical density at 600 nm and presented as a percentage of the untreated control. Different bars indicate treatments with varying acarbose concentrations for each of the tested strains: A. viscosus expressing mak1 (blue) and A. viscosus harbouring an empty-vector control (grey). Mak1 expression resulted in a statistically significant rescue of the carbohydrate-dependent growth inhibitory activity of acarbose at several concentrations. Error bars represent the standard error of the mean among four replicates and “*” denotes a p-value < 0.01 (using a two-sample t-test assuming unequal variances): 0.5 μM, p=3.33×10⁻⁵; 5 μM, p=2.17×10⁻⁵; 10 μM, p=2.37×10⁻⁸; 50 μM, p=2.96×10⁻⁵; and 100 μM, p=5.94×10⁻³. See Supplementary Table 6 for the raw experimental data. b, c. HbA1c (b) and fasting blood glucose (c) levels in mak-negative (N=8, blue) and mak-positive (N=8, red) Type 2 Diabetes patients treated with acarbose. The bar graphs show mean ± SD. Repeated measures analysis of variance (ANOVA) with Tukey’s post hoc test was used for comparing different time points in each group. Compact letter displays were used to indicate the statistical differences (P < 0.05) between different time points. The difference between groups at each post-treatment time point was evaluated by an ANCOVA model controlling for the baseline measurements. * P < 0.05. We observed statistically significant reductions in both HbA1c and fasting blood glucose levels only in mak-negative patients. In addition, at day 84, mak-negative patients showed significantly larger reduction of HbA1c (PANCOVA = 0.011) and fasting blood glucose levels (PANCOVA = 0.024) from baseline than mak-positive patients. d. Genetic context of all maks and pmaks, as well as acbK, gacK and scatK, following the colour key to the right. e. A simplified biosynthetic scheme for acarbose by gac, with gac proteins involved at each step shown above the arrows. Homologous end proteins are shown below the arrow, accounting for most of the core biosynthetic steps needed for acarbose production.
Extended Data Fig. 9 |
Extended Data Fig. 9 |. Distribution of mak1 and end variants in the human microbiome.
a. Percentage of samples across different cohorts that are positive for either mak1 (blue) or end (green). Mak1 was considered “present” in a given sample if any reads mapped to it, and end was considered “present” in a given sample if it had a breadth coverage of ≥25% of its length. SP stands for supragingival plaque. See Supplementary Table 8 for detailed results of this analysis. b. Genetic context of all five end variants discovered, following the colour code on the right. Note that most variants exist in close proximity to a transposase gene, suggesting a role in their mobility. c. Relative RPKM (y axis, defined as the RPKM of the gene of interest divided by the RPKM of the entire end cluster) of each end gene (x axis). Ten examples of human metagenomic samples (supragingival plaque, HMP) are shown in the top graph, where the depth of coverage is uniform across all end genes. Ten examples of human metagenomic samples (supragingival plaque, HMP) are shown in the bottom graph, where a clear spike in the depth of coverage can be observed around the endM/mak1 gene, indicating the presence of at least two different end genetic variants in these samples. Next to each graph is a representative example of metagenomic reads from supragingival plaque samples mapped to the end BGC. See Supplementary Table 10 for detailed results of this analysis. d. A heatmap showing the abundance (in RPKM) of all end genes in supragingival plaque samples of the HMP cohorts (HMP-1-1 and HMP-1-2). Different samples harbour different genetic contexts (or variants) of the end BGC: 14-gene, 8-gene, 4-gene, 2-gene, or stand-alone mak1/endM. Samples are sorted according to their classification into one of these five genetic variants listed above. e. Metagenomic reads from five different supragingival plaque samples mapped to the end BGC (see Methods). Each of the five samples illustrates an example for one of the unique genetic variants described above. f. A Pie chart showing the distribution of the five genetic variants amongst HMP participants (supragingival plaque samples). If participants had multiple visits and different variants across visits, they were classified into end (multiple variants) (see Supplementary Table 10).
Fig. 1 |
Fig. 1 |. Metagenomic discovery of Maks from the human microbiome.
a, Acarbose BGC (acb) (top). Bottom, AcbK phosphorylates acarbose to yield acarbose-O6A-phosphate. b, A maximum likelihood phylogenetic tree of AcbK homologues discovered in this study, constructed using MEGA7 (ref. ), with bootstrap values of >50% out of 1,000 replicates displayed at the branch points. The tree includes previously characterized acarbose kinases (red), PfkB from E. coli, Mcks experimentally verified to have (green, Maks) or lack (blue) acarbose-O6A-kinase activity, and ones that have not been experimentally tested (black). pMaks indicate putative Maks in the AcbK clade. Phyla of the bacteria of origin are illustrated by shaded boxes. An asterisk denotes that the phylum is predicted because of a metagenomic origin. The complete tree is shown in Extended Data Fig. 2. c, The rates of each experimentally characterized Mck/Mak relative to AcbK, coloured as in b. Values from individual replicates (n = 2 or n = 3) are shown as small circles. Raw data are available in Supplementary Table 3. Representative HPLC–MS and HPLC-high resolution (HR) –MS/MS data are shown in Extended Data Figs. 3 and 5. d, Heatmap showing the abundance of a selected subset of mak and pmak genes in the five analysed cohorts as calculated by MetaBGC (samples with no mapped reads are not shown) (top). Hierarchical clustering was performed using UPGMA (unweighted pair group method with arithmetic mean) in pheatmap in R. Bottom, the prevalence (the percentage of positive individuals) of the same set of mak and pmak genes in the HMP cohorts at two body sites. The prevalence and abundance of all mck genes in all cohorts are shown in Extended Data Fig. 2 and Supplementary Table 2.
Fig. 2 |
Fig. 2 |. Mak1 and AcbK phosphorylate and inactivate acarbose with similar enzyme kinetics.
a, b, A colorimetric amylase activity assay for porcine pancreatic amylase (a) and human salivary amylase (b). The increase in absorbance at 405 nm (y axis, measured every 30 s) indicates the cleavage of an oligosaccharide substrate mimic (ethylidene-pNP-G7) and the release of a chromogenic dye (p-nitrophenol) as a direct readout for amylase activity. Although incubation of either amylase with 10 μM acarbose completely abolishes their activity, incubation with the same concentration of acarbose-O6A-phosphate (Acb-O6A-P) produced by either Mak1 or AcbK is no longer inhibitory. Data plotted in a and b are from a single experiment. The raw data from this experiment, and from a second replicate showing identical results are presented in Supplementary Table 4. c, Michaelis–Menten saturation curves for AcbK (grey) and Mak1 (blue). Km and kcat values are indicated in their respective colours and individual kobs measurement replicates are shown on the graph for both enzymes. S0 is the initial substrate concentration and E0 is the concentration of the enzyme. Raw data are available in Supplementary Table 3.
Fig. 3 |
Fig. 3 |. Crystal structures of Mak1 and AcbK reveal their structural similarity and specific acarbose interacting residues.
a, Side-by-side comparison of the extremely similar structures of Mak1 and AcbK with the acarbose substrate and AMP-PNP bound, as well as the coordinated metal (Mn+2, purple sphere). Both proteins form a canonical ribokinase fold where the substrate binds in a small cleft between the two main domains: a core α/β domain and a smaller β-clasp domain that forms the dimer interface. b, Left, Mak1 forms homodimers with extensive interactions between the two monomers, most notably β3 of one monomer and β8 of the other (yellow highlighted boxes; β-strands from each monomer are shaded differently for clarity). A molecular surface view is shown (right) with one Mak1 monomer coloured red and the other coloured purple, highlighting the extensive surface area (1,298 Å2) that is involved in forming the dimer through the β-clasp domains. c, Magnified view of the Mak1 substrate-binding pocket where an extensive network of hydrogen bonds form with all the hydroxyl groups in the acarbose A ring and hold it in place. Distances are shown for each of the hydrogen bonds. d, Magnified view of the Mak1 active site with important residues shown (Asp160, His162 and Asp247) that are all involved in priming the O6A hydroxyl of acarbose for nucleophilic attack and in facilitating the transfer of the phosphate from an ATP (AMP-PNP shown) to the O6A hydroxyl of acarbose. The distance shown is from the O6A hydroxyl to the γ-phosphate. A corresponding set of figures for AcbK is provided in Extended Data Fig. 7.
Fig. 4 |
Fig. 4 |. Biological relevance of Maks and a potential origin for Mak1 in the human oral microbiome.
a, Normalized bacterial growth at 24h, measured as the optical density at 600 nm and presented as a percentage of the untreated control. The bars indicate treatments with varying acarbose concentrations for each of the tested strains: A. viscosus expressing mak1 (blue) and A. viscosus harbouring an empty-vector control (grey). mak1 expression resulted in a statistically significant rescue of the carbohydrate-dependent growth inhibitory activity of acarbose. The error bars represent the s.e.m. n = 4. Statistical analysis was performed using two-sample t-tests assuming unequal variances; *P < 0.01: P = 1.02 × 10⁻⁵ (0.5 μM), P = 2.48 × 10⁻⁶ (1 μM), P= 1.07 × 10⁻⁹ (5 μM), P= 1.45 × 10⁻⁴ (10 μM), P = 7.07 × 10⁻⁸ (50 μM) and P=1.26 × 10⁻³ (100 μM). The raw experimental data are provided in Supplementary Table 6 and a similar plot of data measured after 48 h of growth is shown in Extended Data Fig. 8. b, c, The percentage change in HbA1c (b) and fasting blood glucose (c) levels in mak-positive (n = 8, red) and mak-negative (n = 8, blue) patients with type 2 diabetes who were treated with acarbose. Two-sided Student’s t-tests were used to compare mak-positive and mak-negative patients at days 28, 56 and 84 after acarbose treatment initiation; *P < 0.05, **P < 0.01: HbA1c, P =0.031 (day 28), P = 0.046 (day 56) and P = 0.003 (day 84); fasting blood glucose, P = 0.026 (day 84). Data are mean ± s.d. d, Comparison of the gac BGC for acarbose biosynthesis from Streptomyces glaucescens and the end BGC discovered here from metagenomic sequencing data of the human oral microbiome. The green shaded bars connect homologous genes in the two BGCs, according to the indicated colour code for pairwise protein sequence identity.

Similar articles

Cited by

References

    1. Chiasson JL et al. Acarbose for prevention of type 2 diabetes mellitus: the STOP-NIDDM randomised trial. Lancet 359, 2072–2077 (2002). - PubMed
    1. Wehmeier UF & Piepersberg W Biotechnology and molecular biology of the alpha-glucosidase inhibitor acarbose. Appl. Microbiol. Biotechnol. 63, 613–625 (2004). - PubMed
    1. Yoon S-H & Robyt JF Study of the inhibition of four alpha amylases by acarbose and its 4IV-α-maltohexaosyl and 4IV-α-maltododecaosyl analogues. Carbohydr. Res. 338, 1969–1980 (2003). - PubMed
    1. Maurice CF, Haiser HJ & Turnbaugh PJ Xenobiotics shape the physiology and gene expression of the active human gut microbiome. Cell 152, 39–50 (2013). - PMC - PubMed
    1. Wu H et al. Metformin alters the gut microbiome of individuals with treatment–naive type 2 diabetes, contributing to the therapeutic effects of the drug. Nat. Med. 23, 850–858 (2017). - PubMed

Publication types

MeSH terms

LinkOut - more resources