. 2021 Dec;600(7887):153-157.
doi: 10.1038/s41586-021-04140-8. Epub 2021 Nov 24.

Mechanism for the activation of the anaplastic lymphoma kinase receptor

Affiliations

Mechanism for the activation of the anaplastic lymphoma kinase receptor

Andrey V Reshetnyak et al. Nature. 2021 Dec.

Abstract

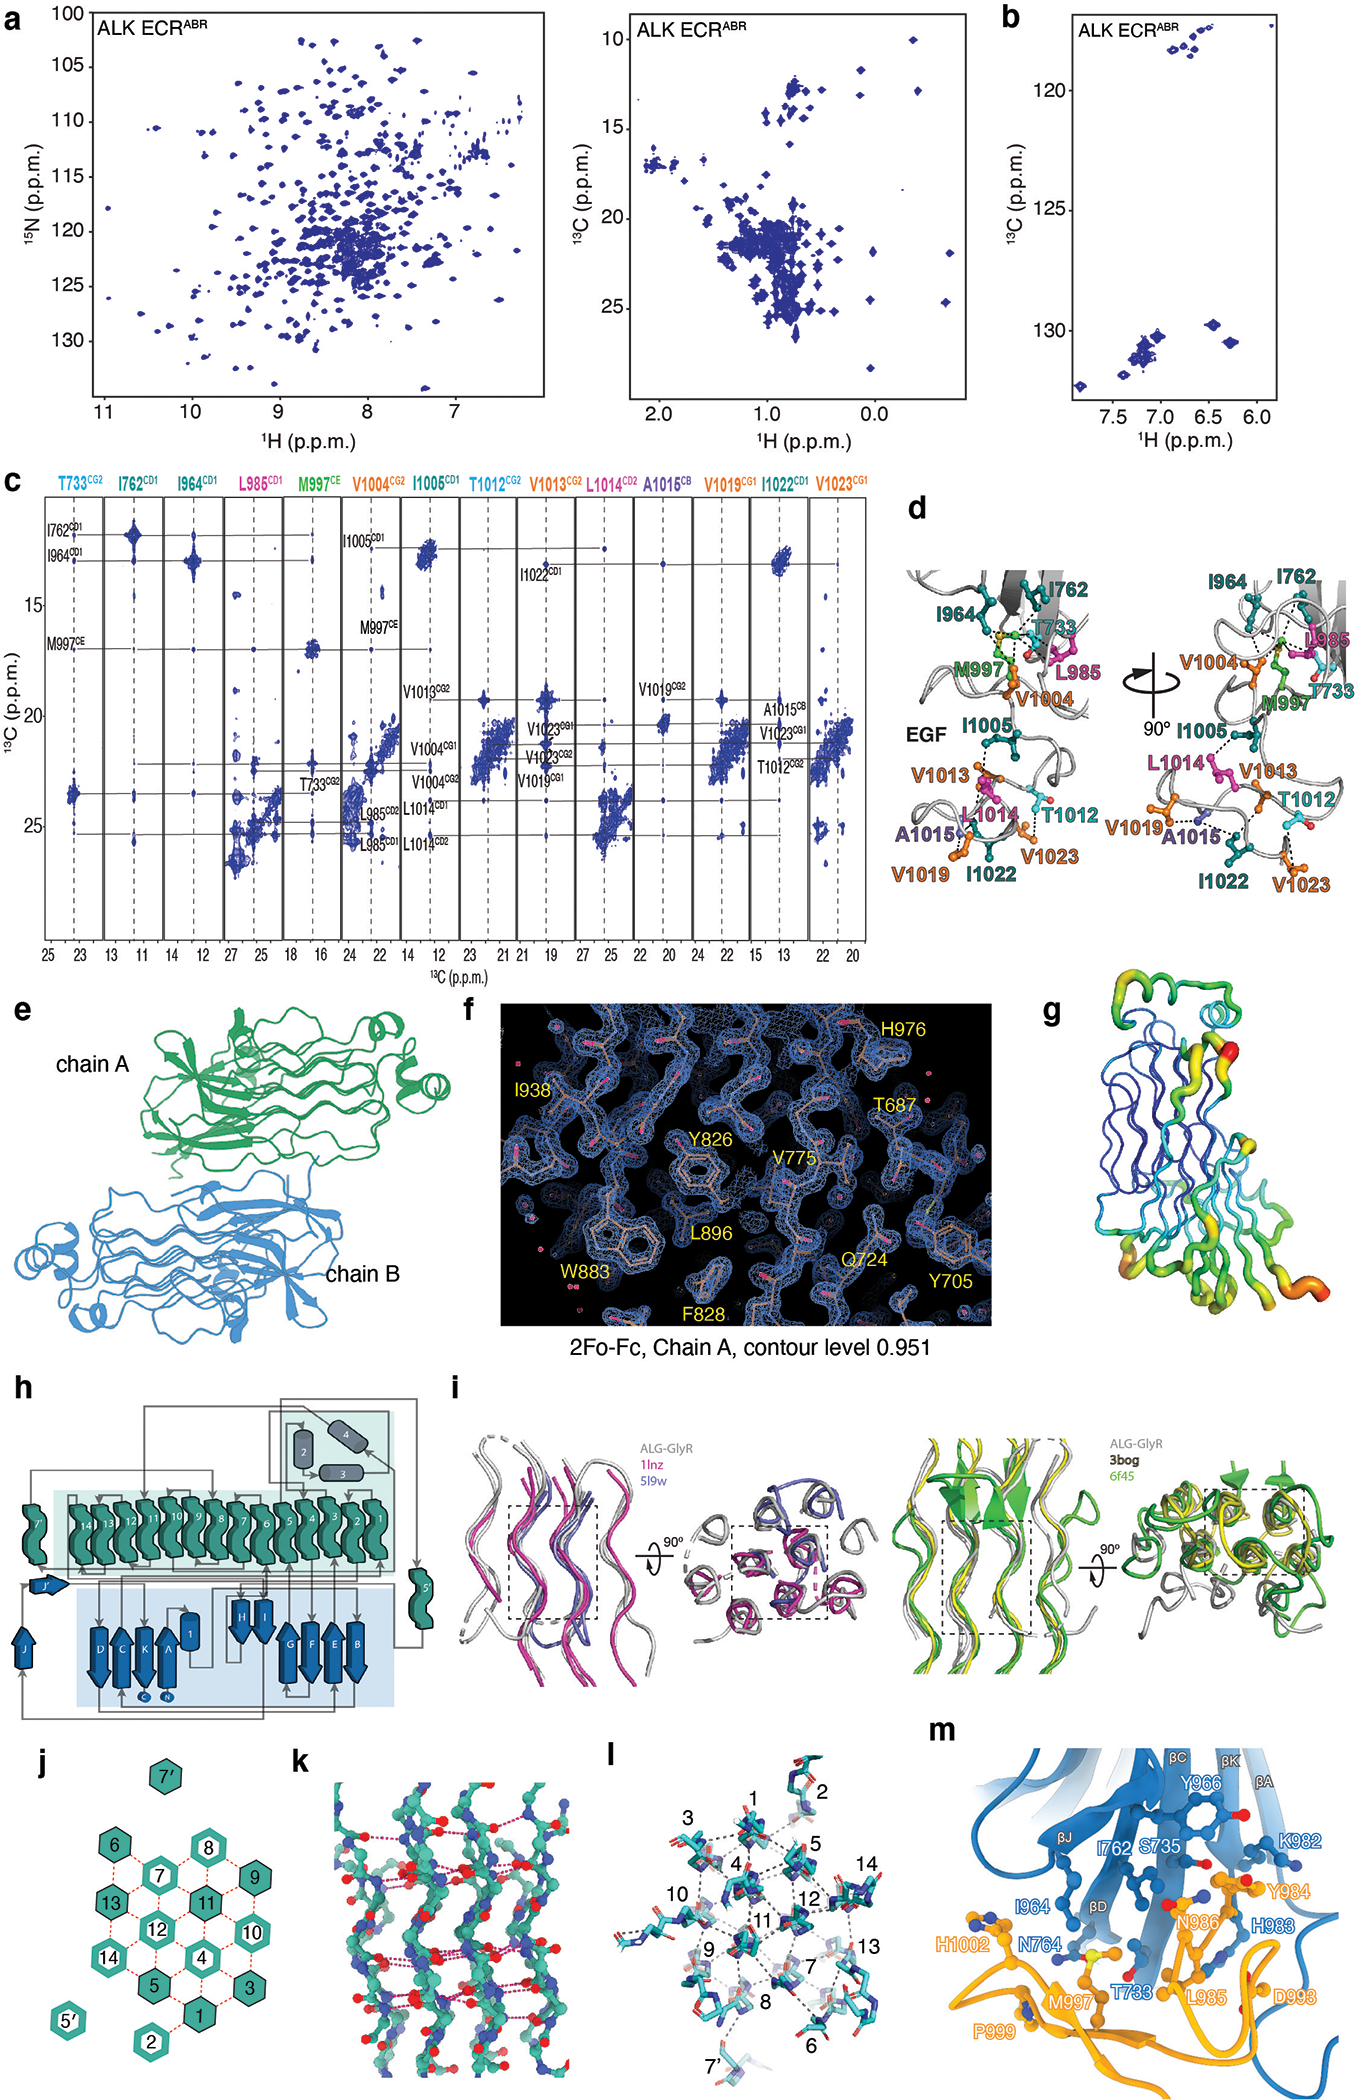
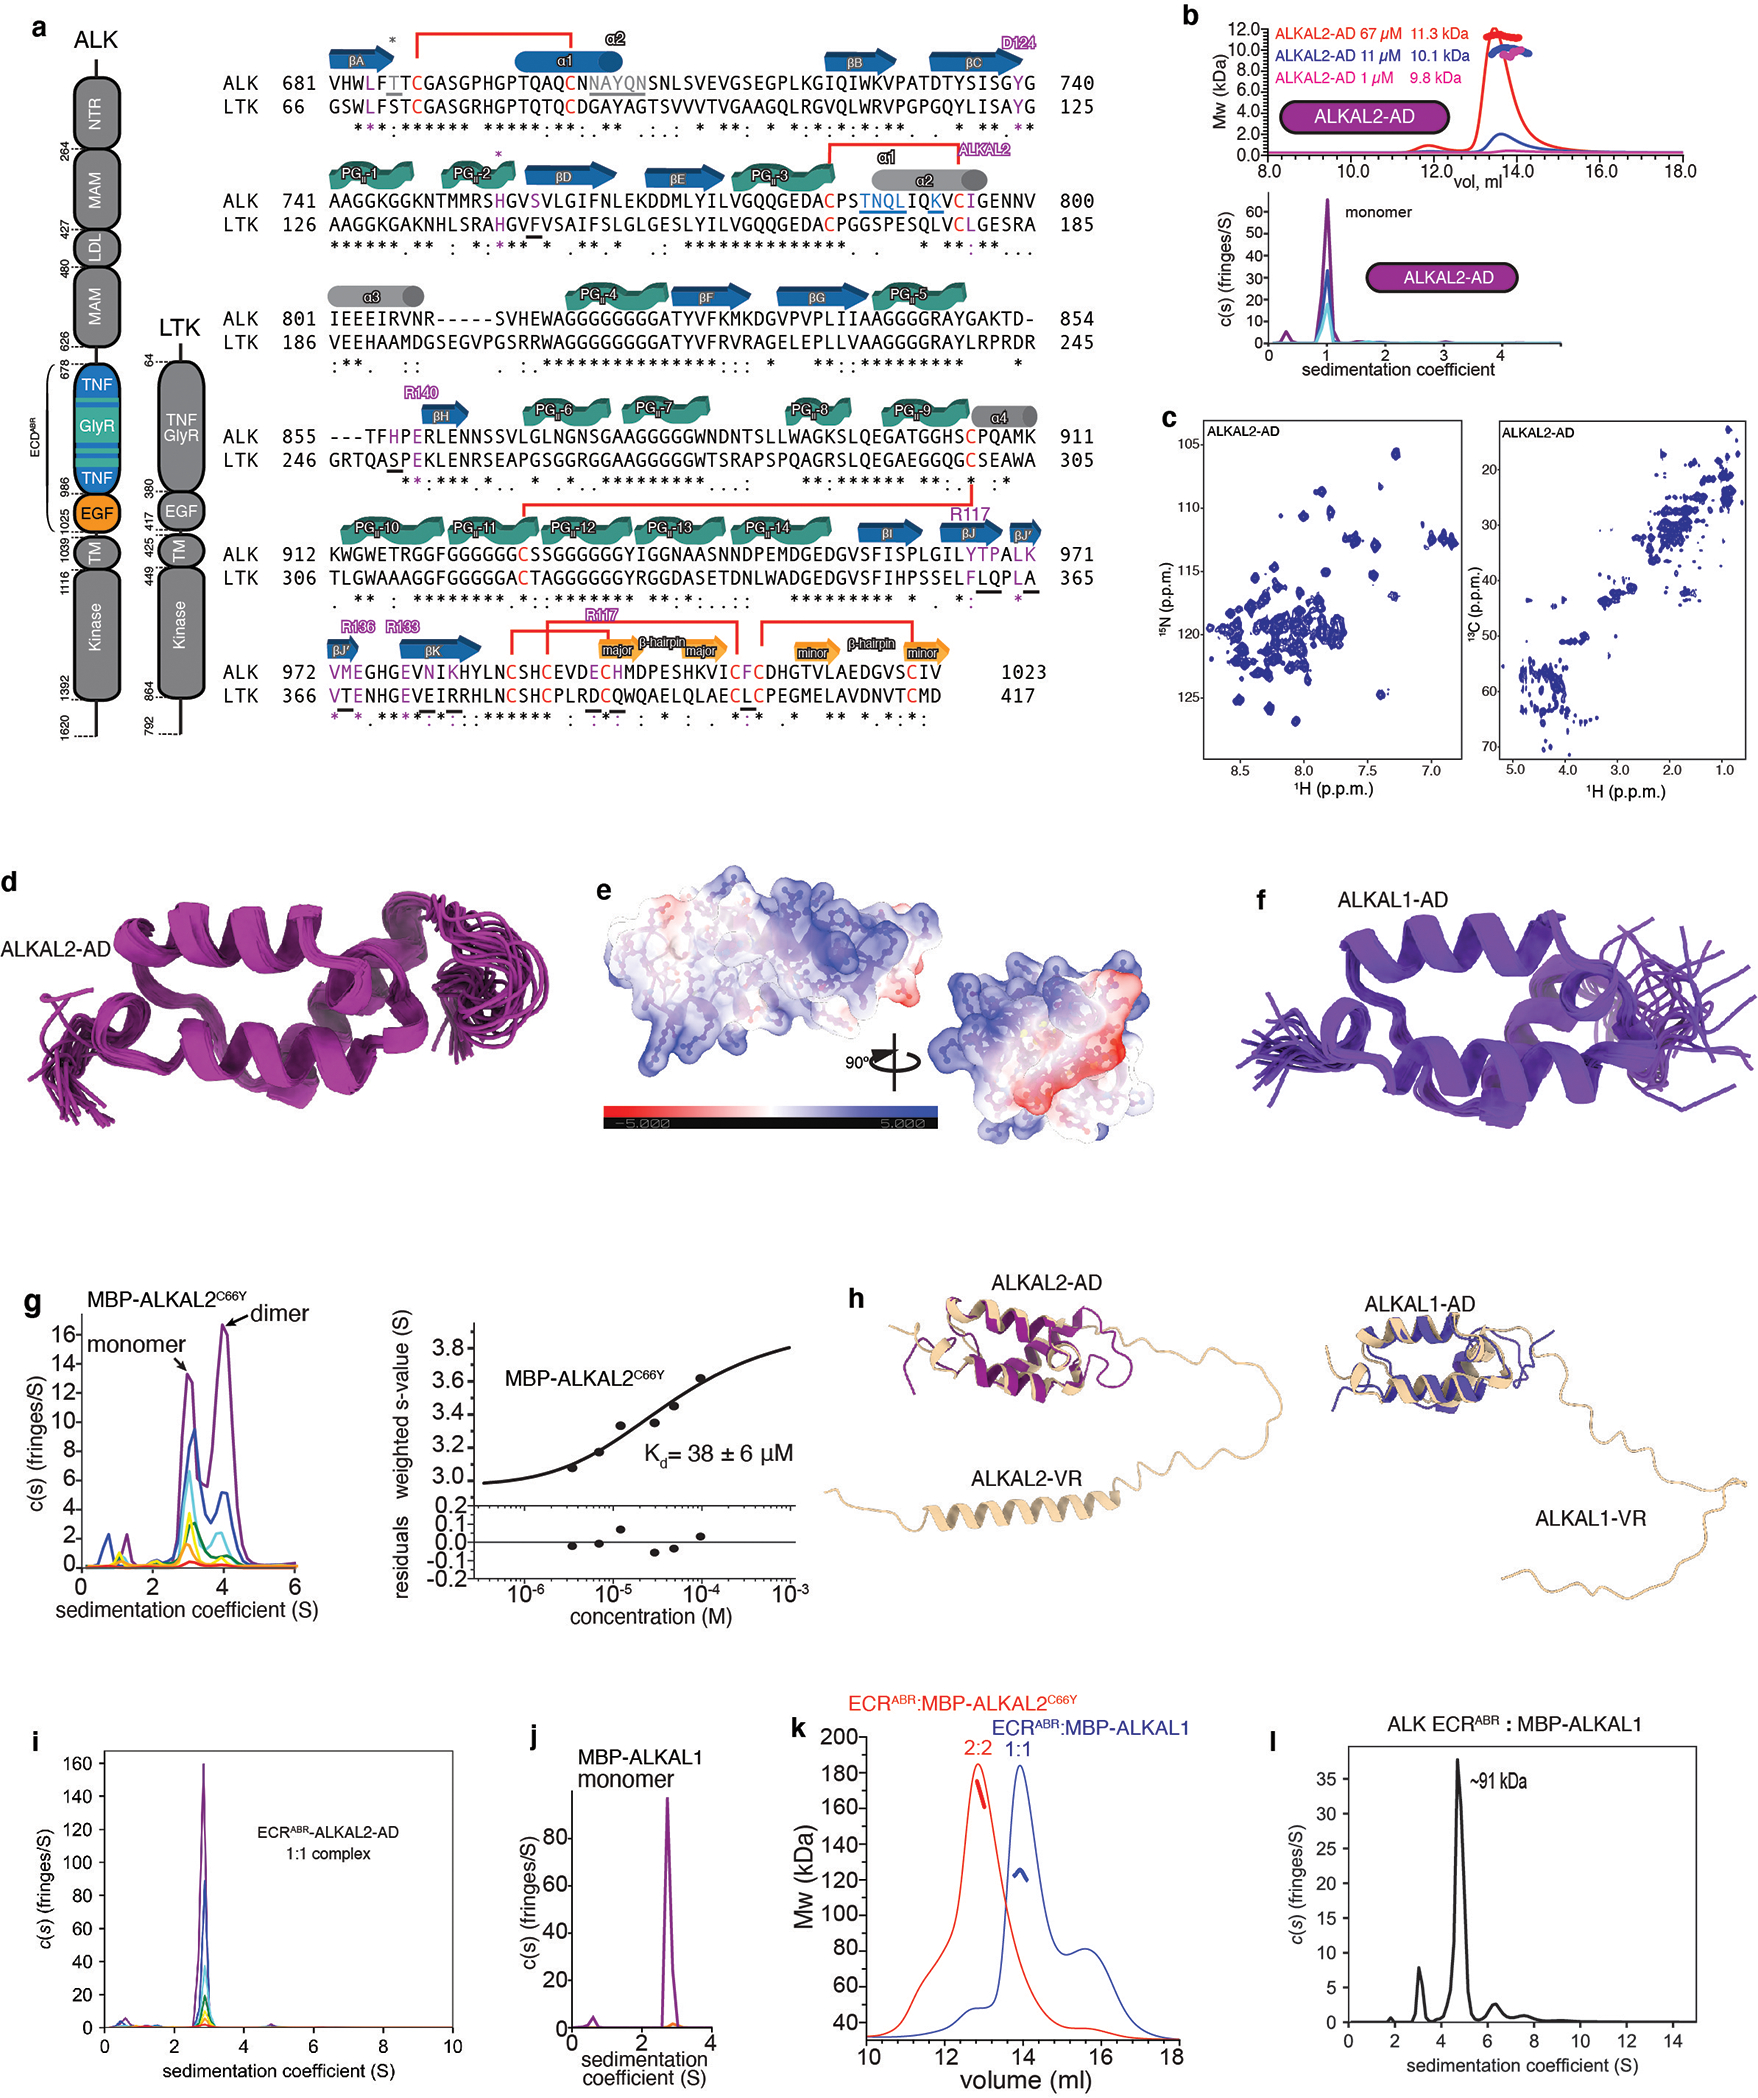
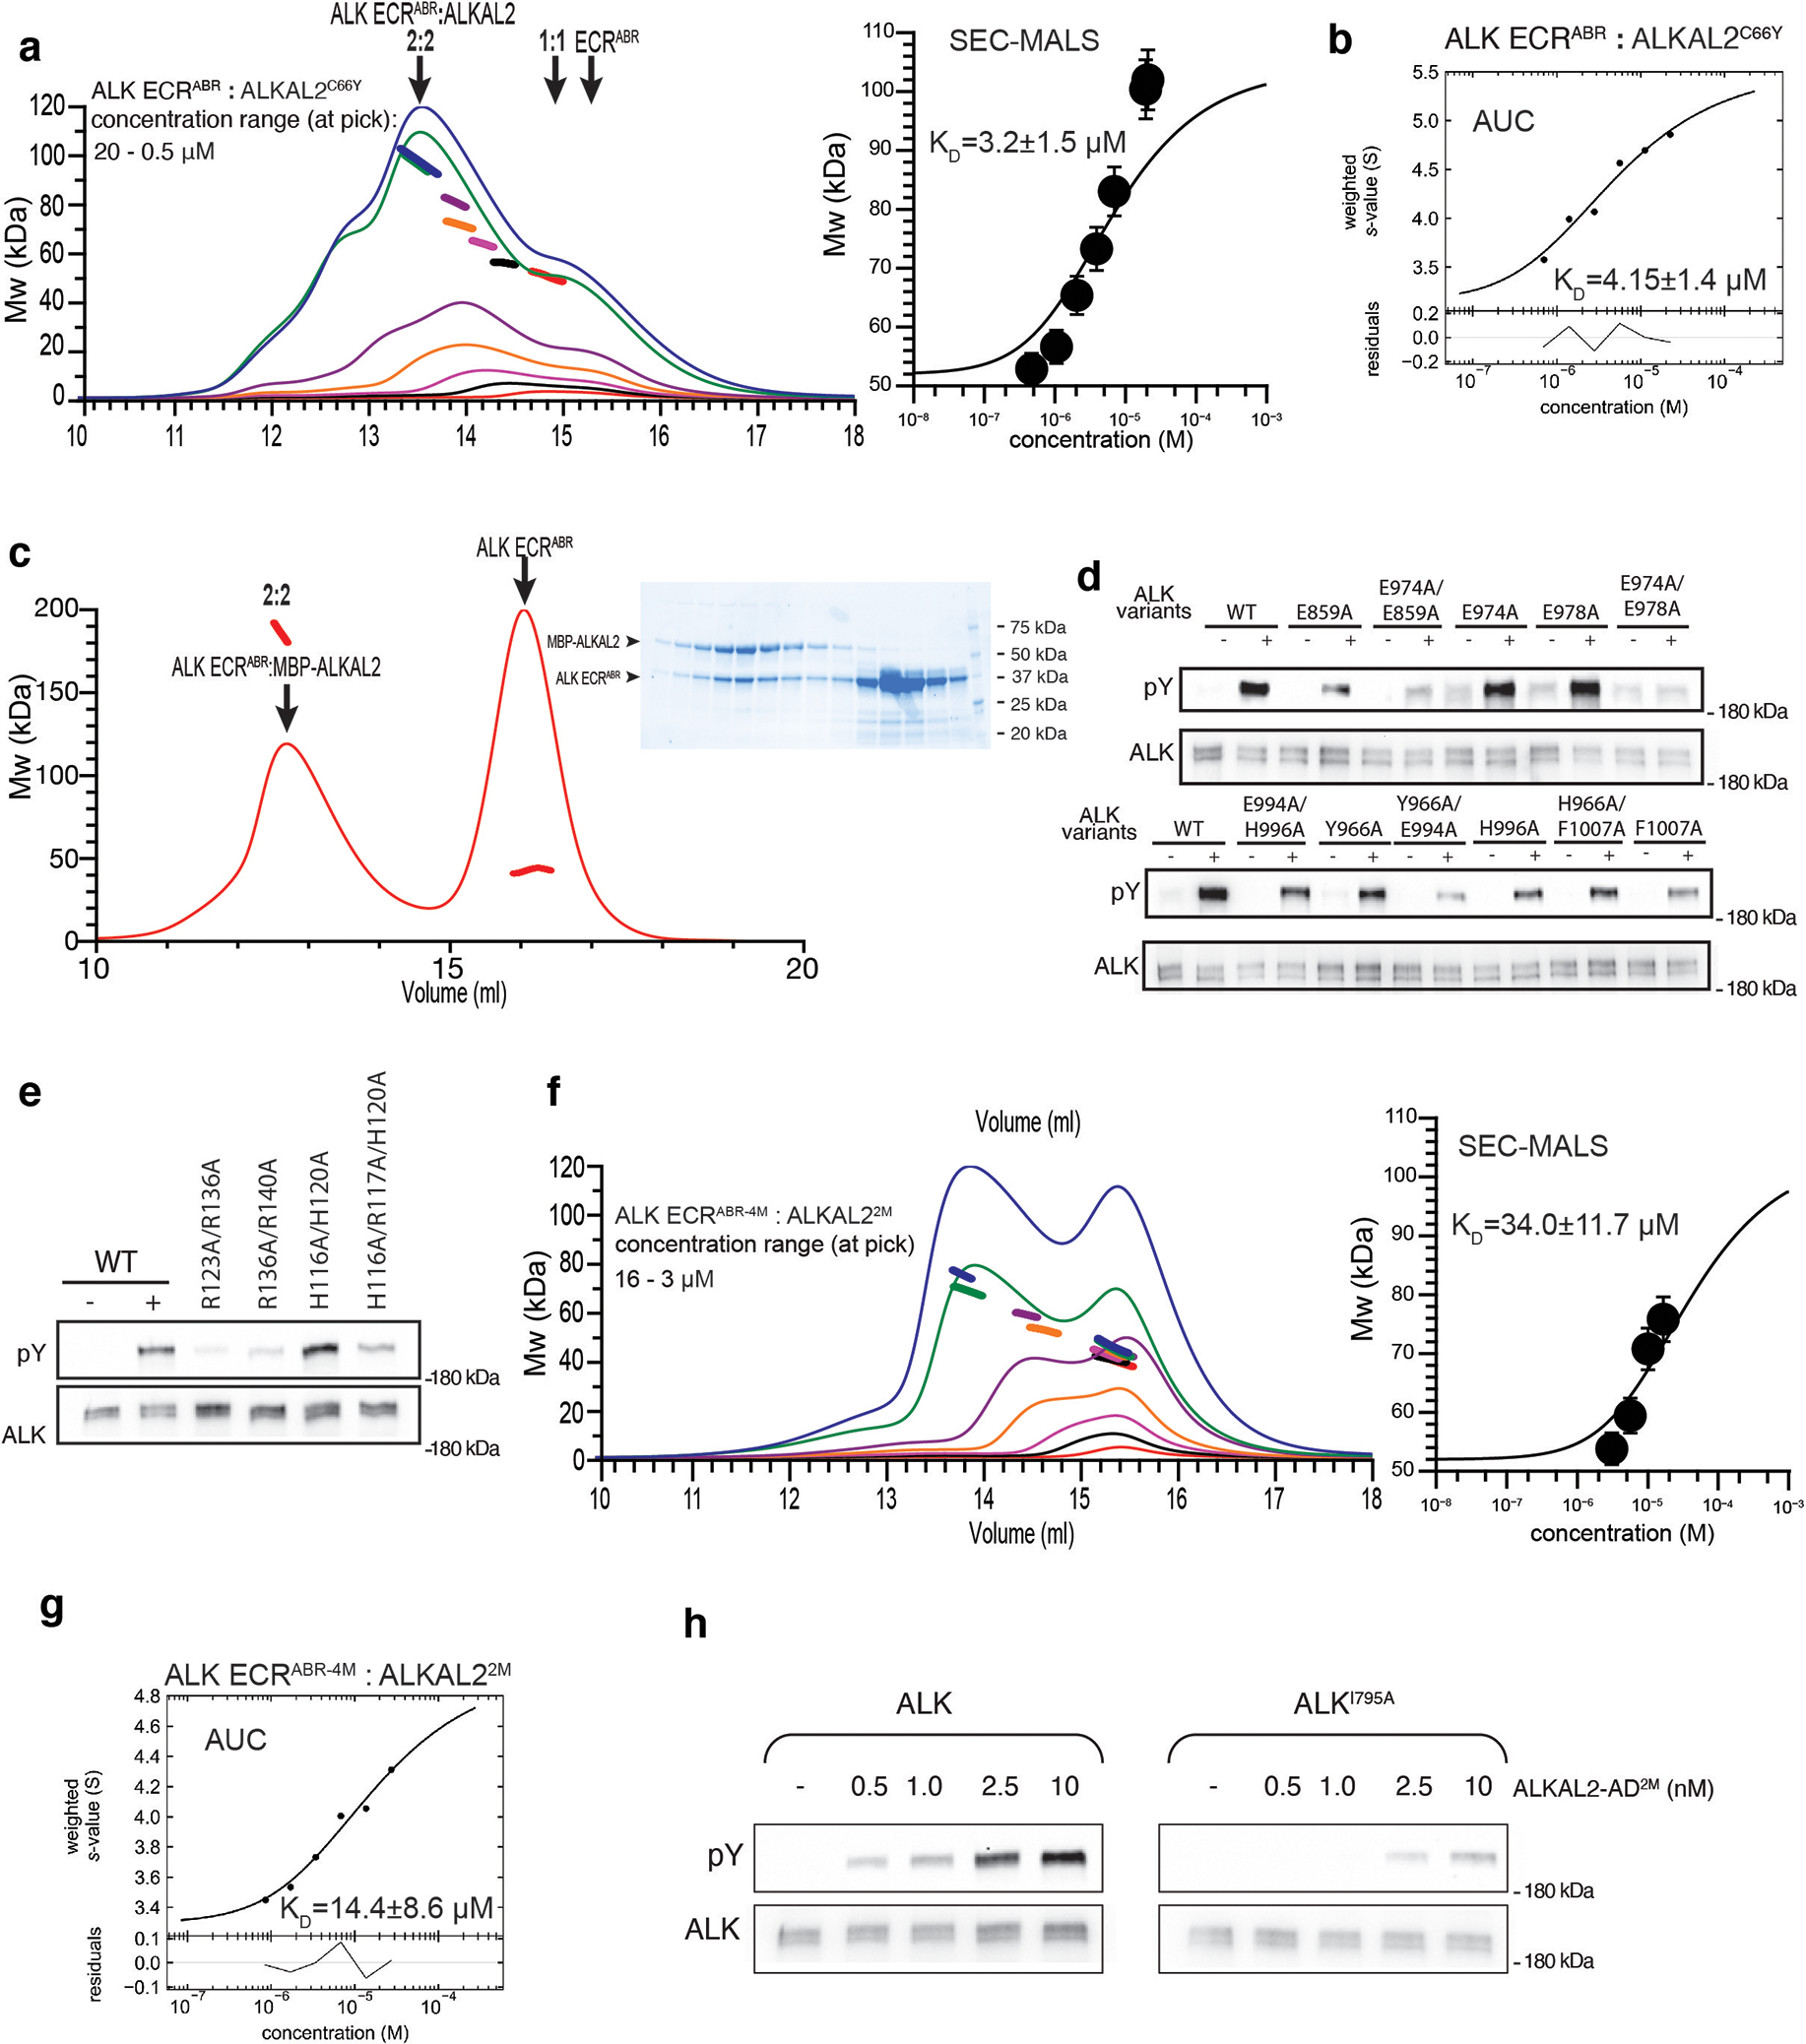
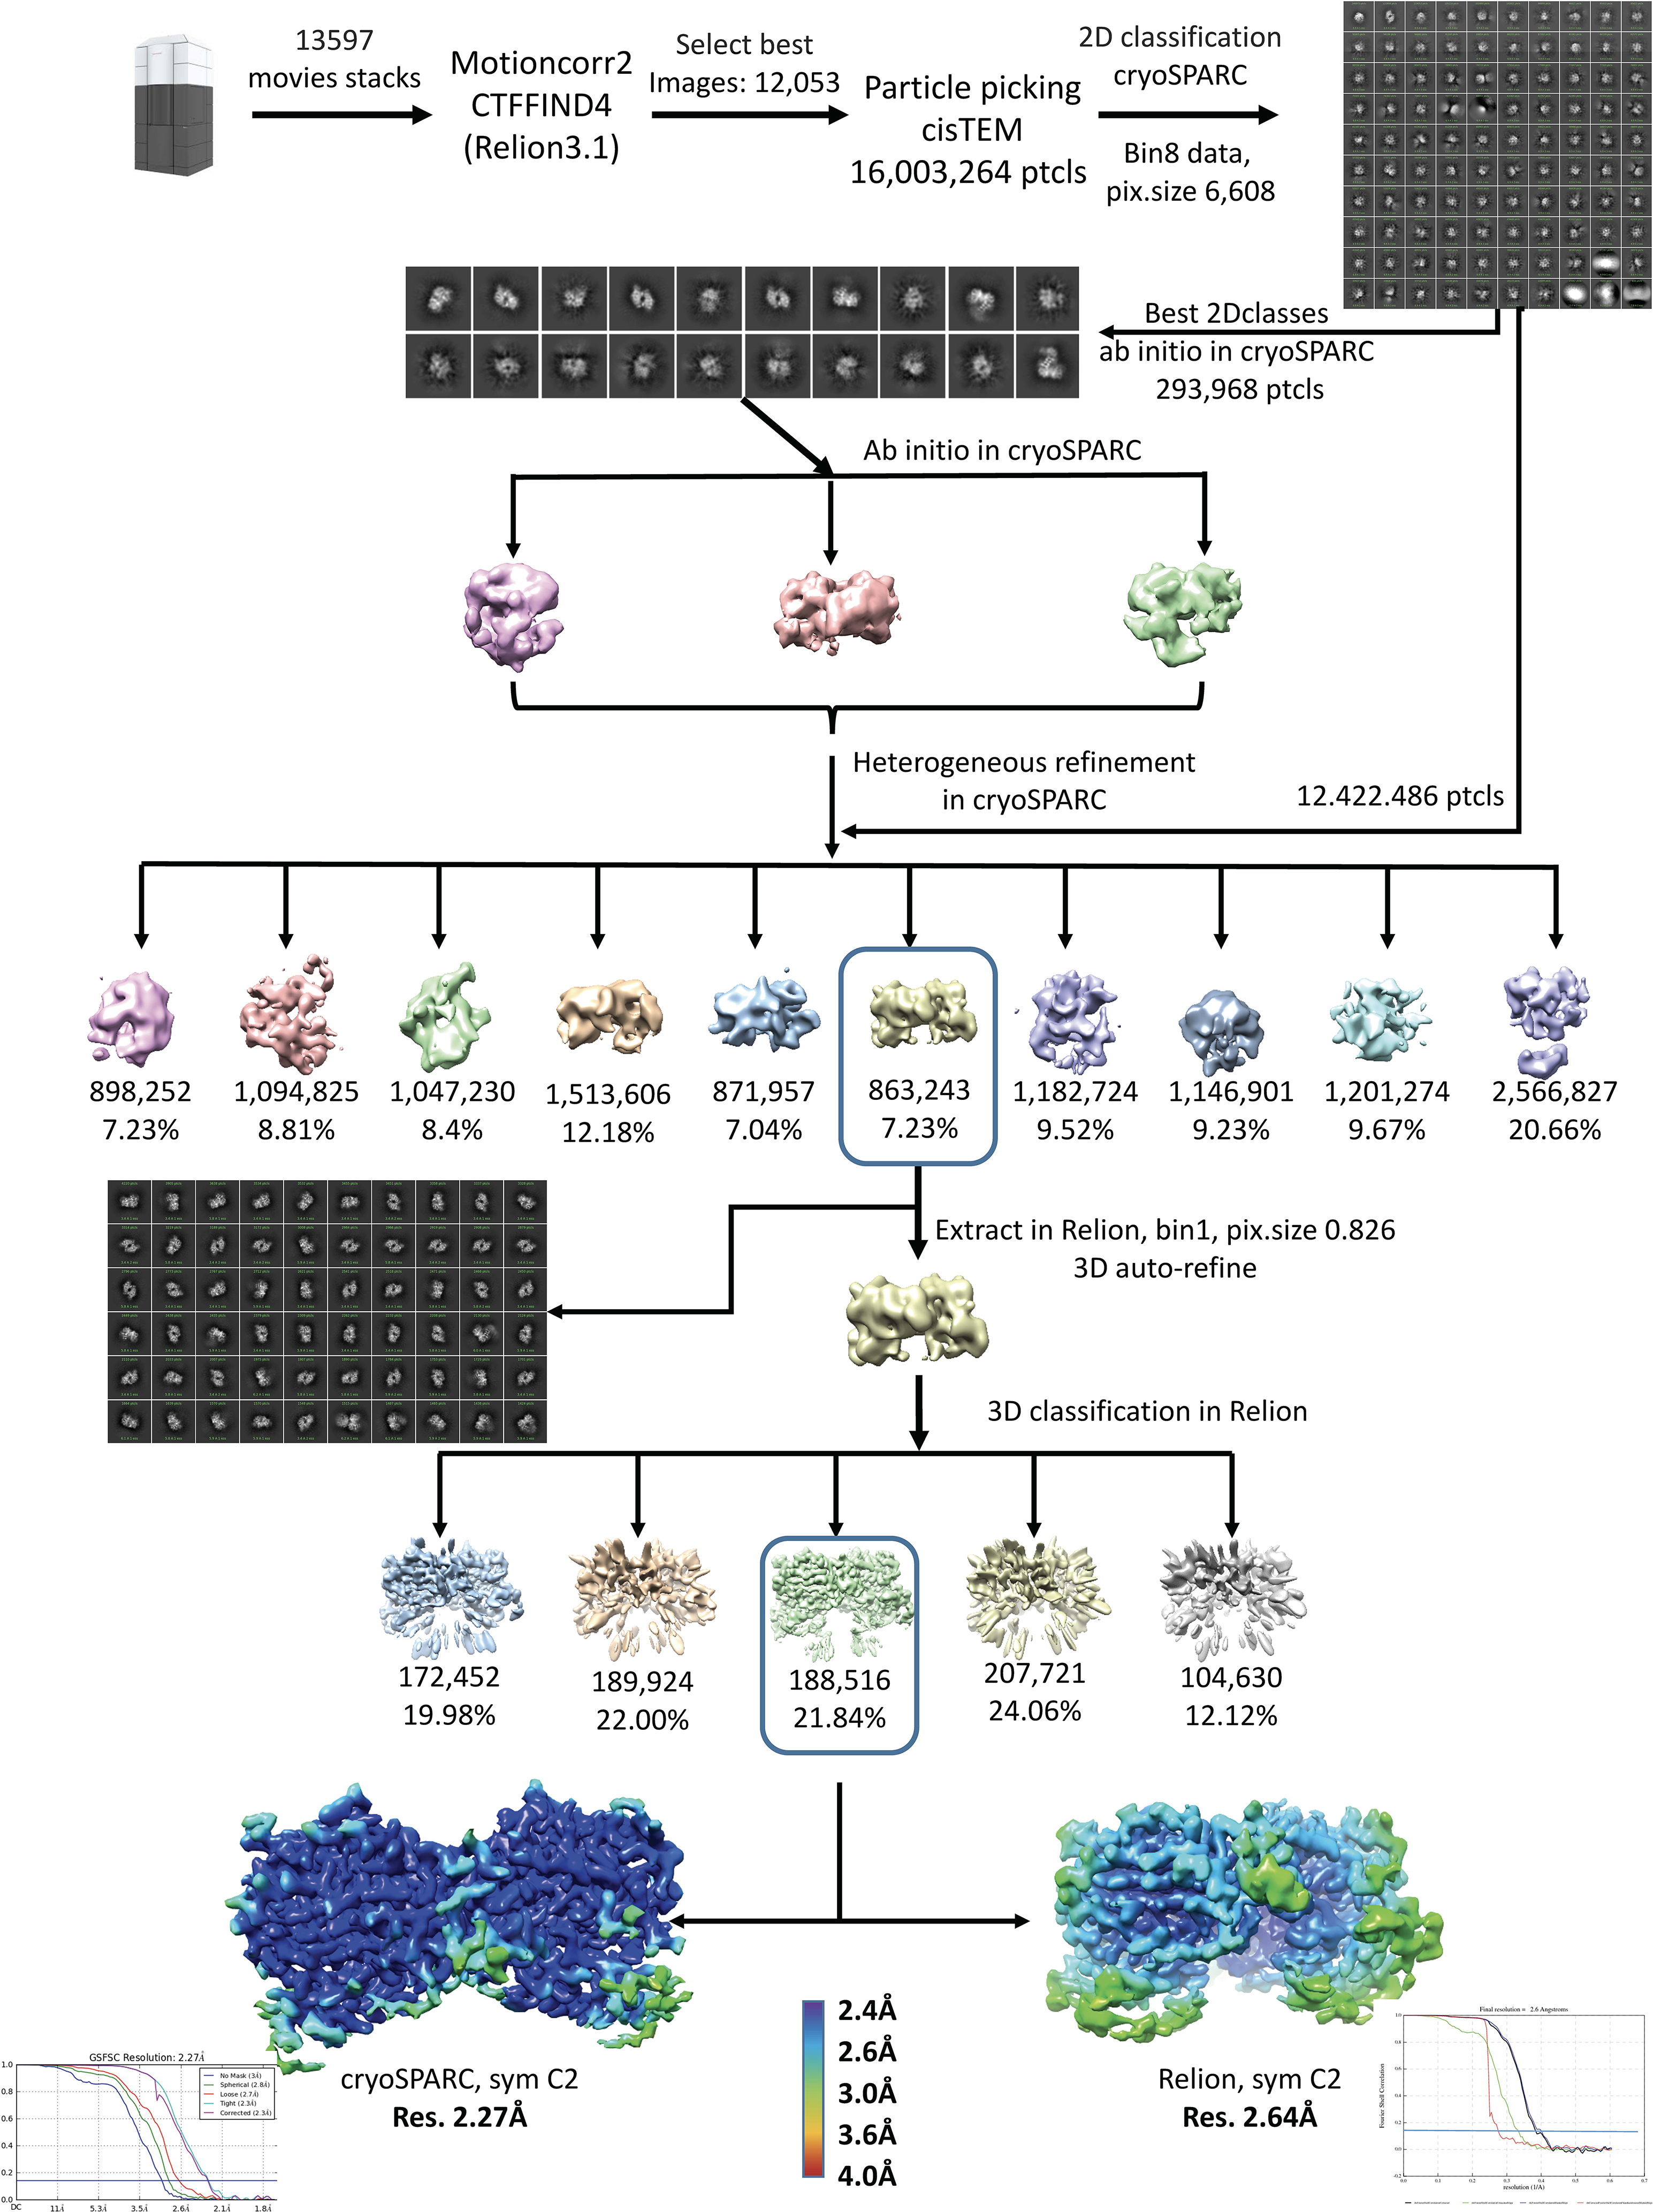
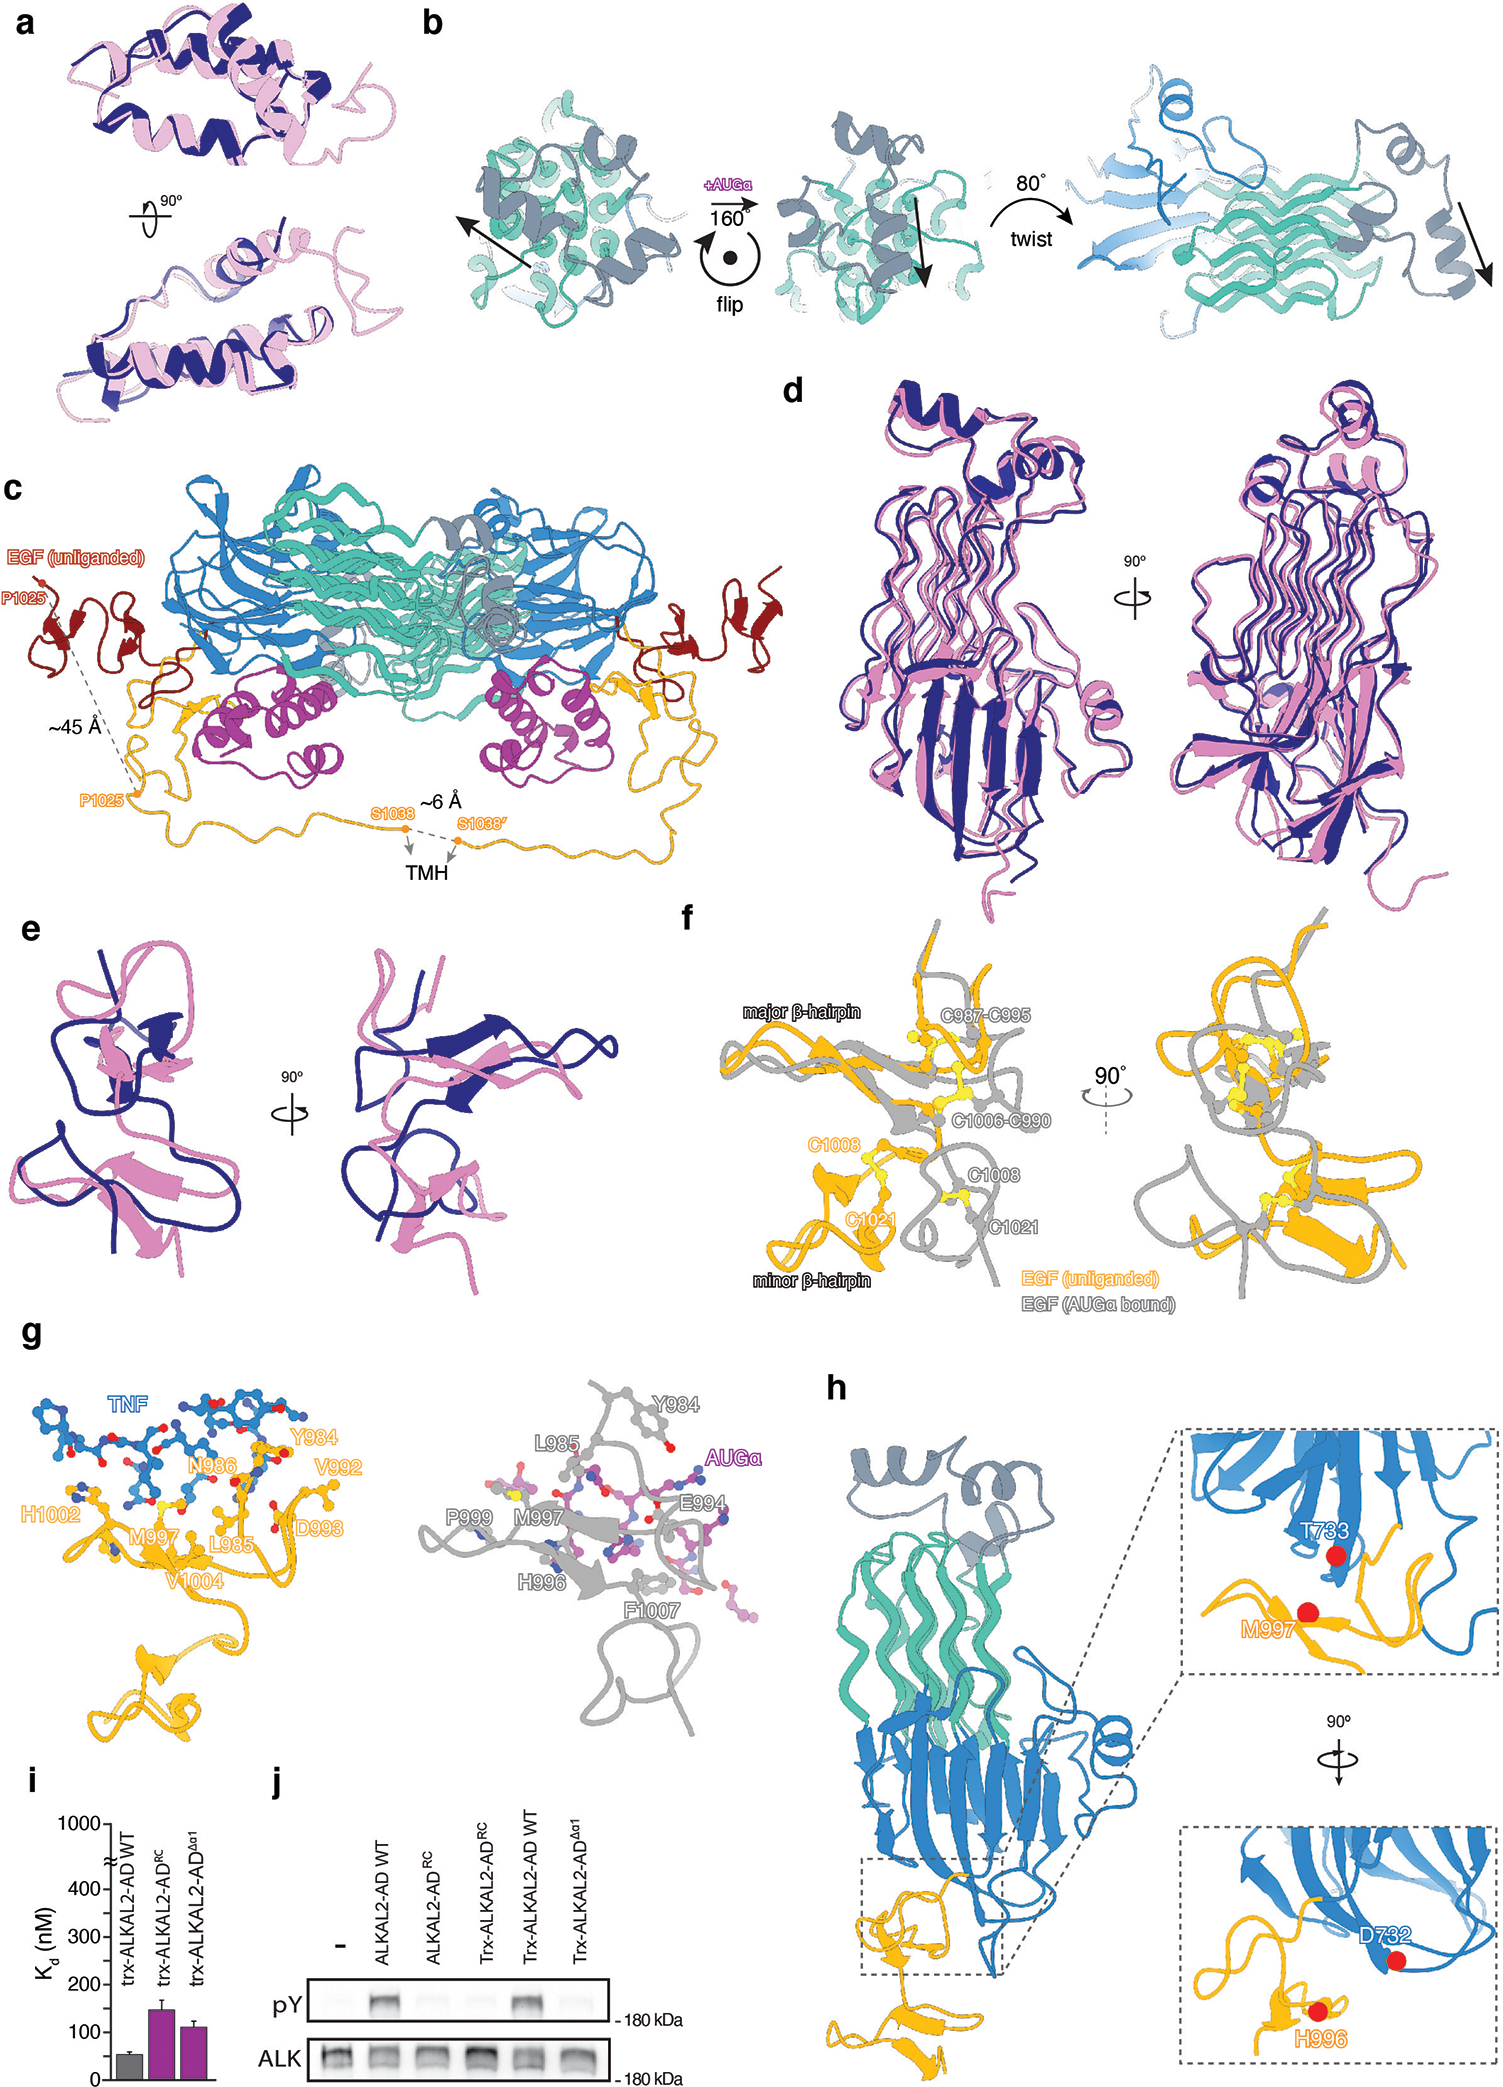
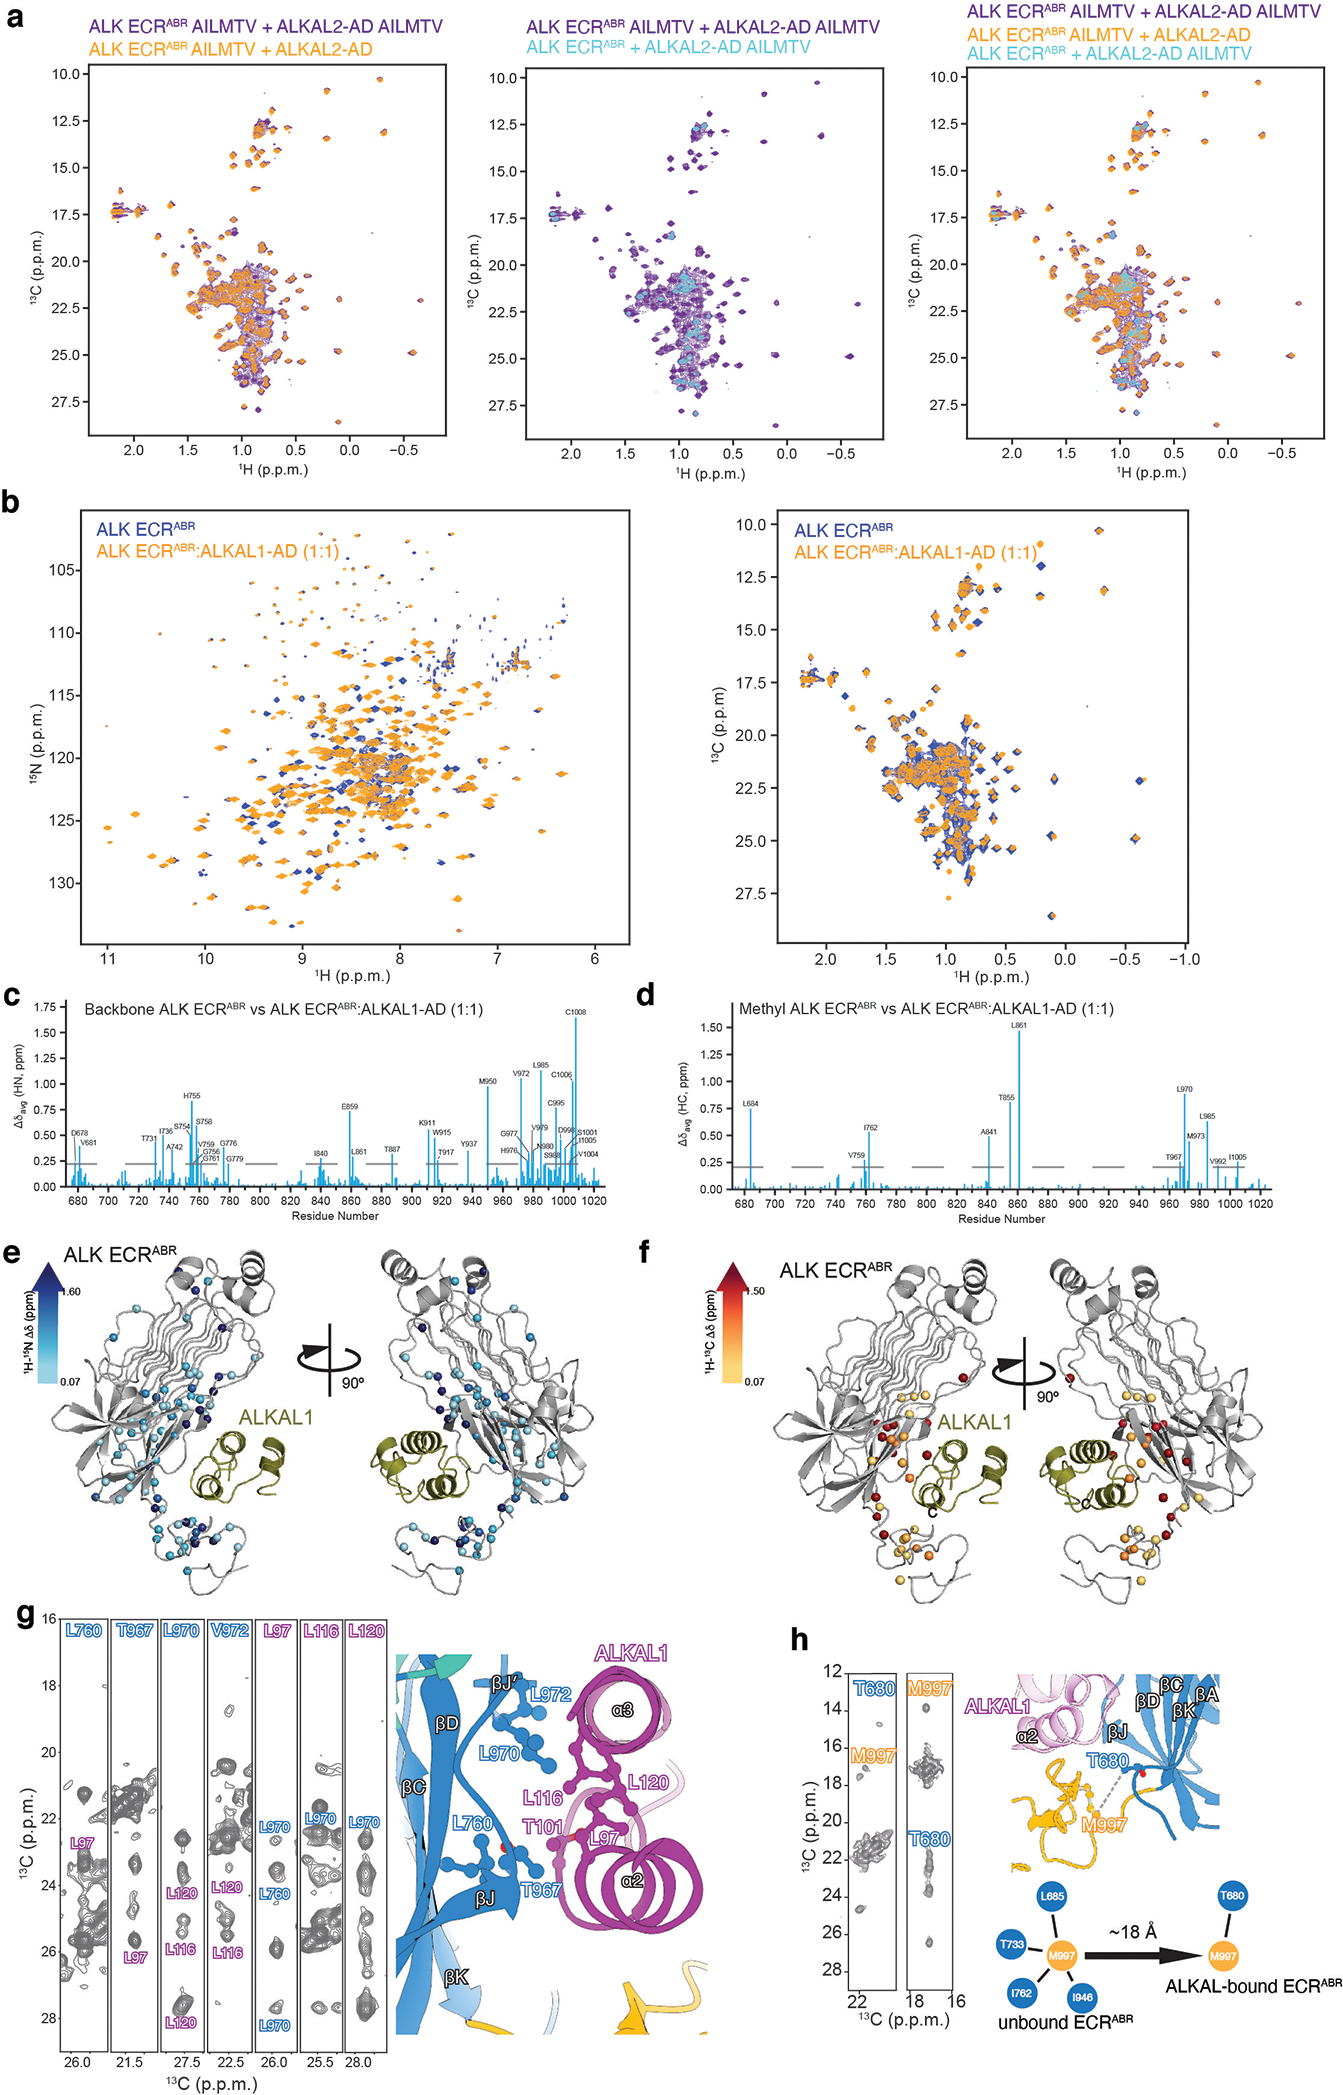
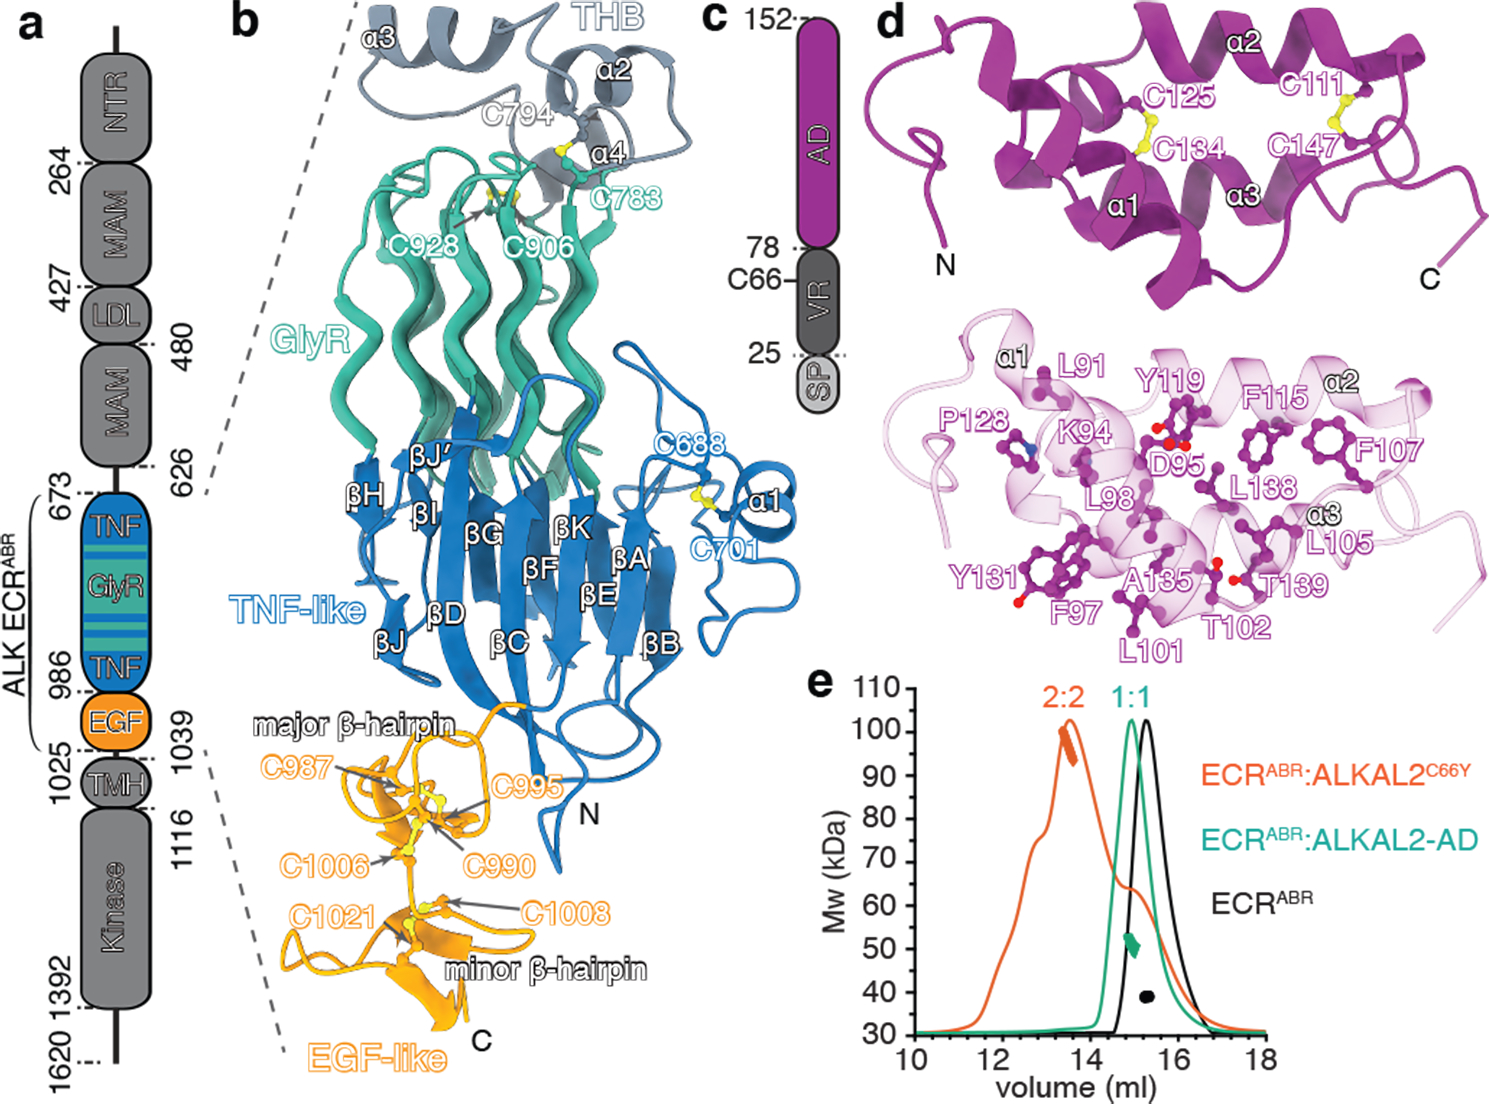
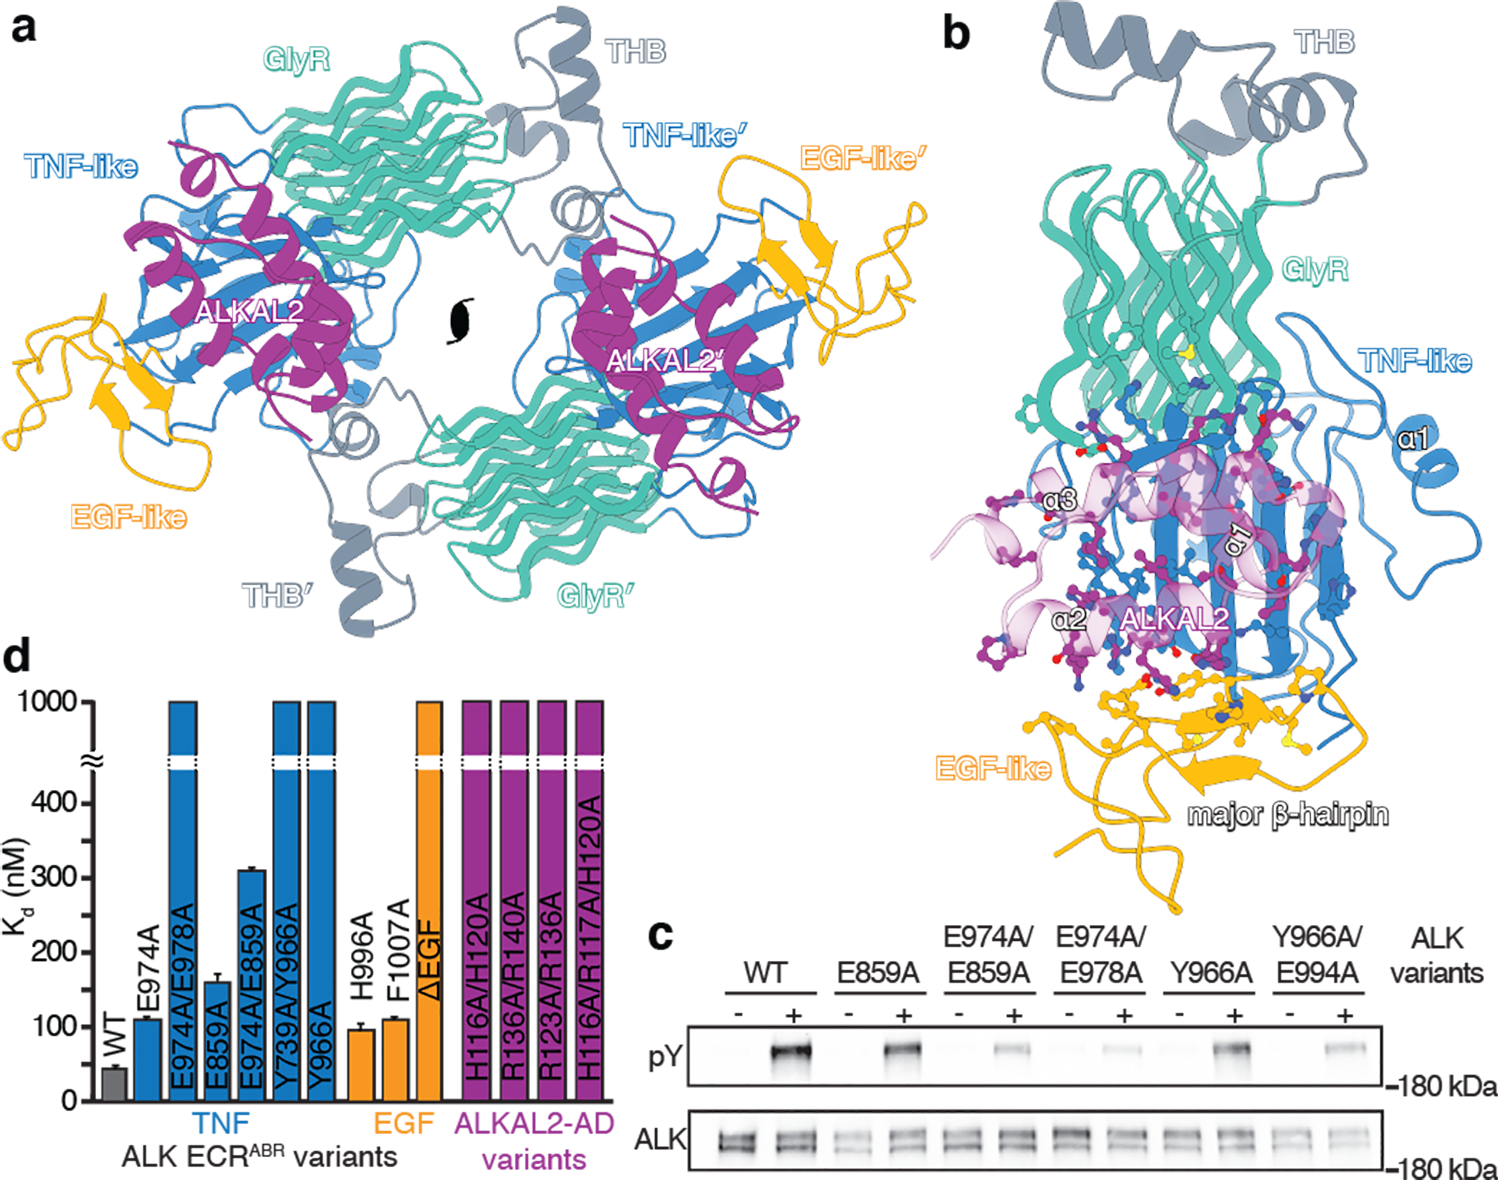
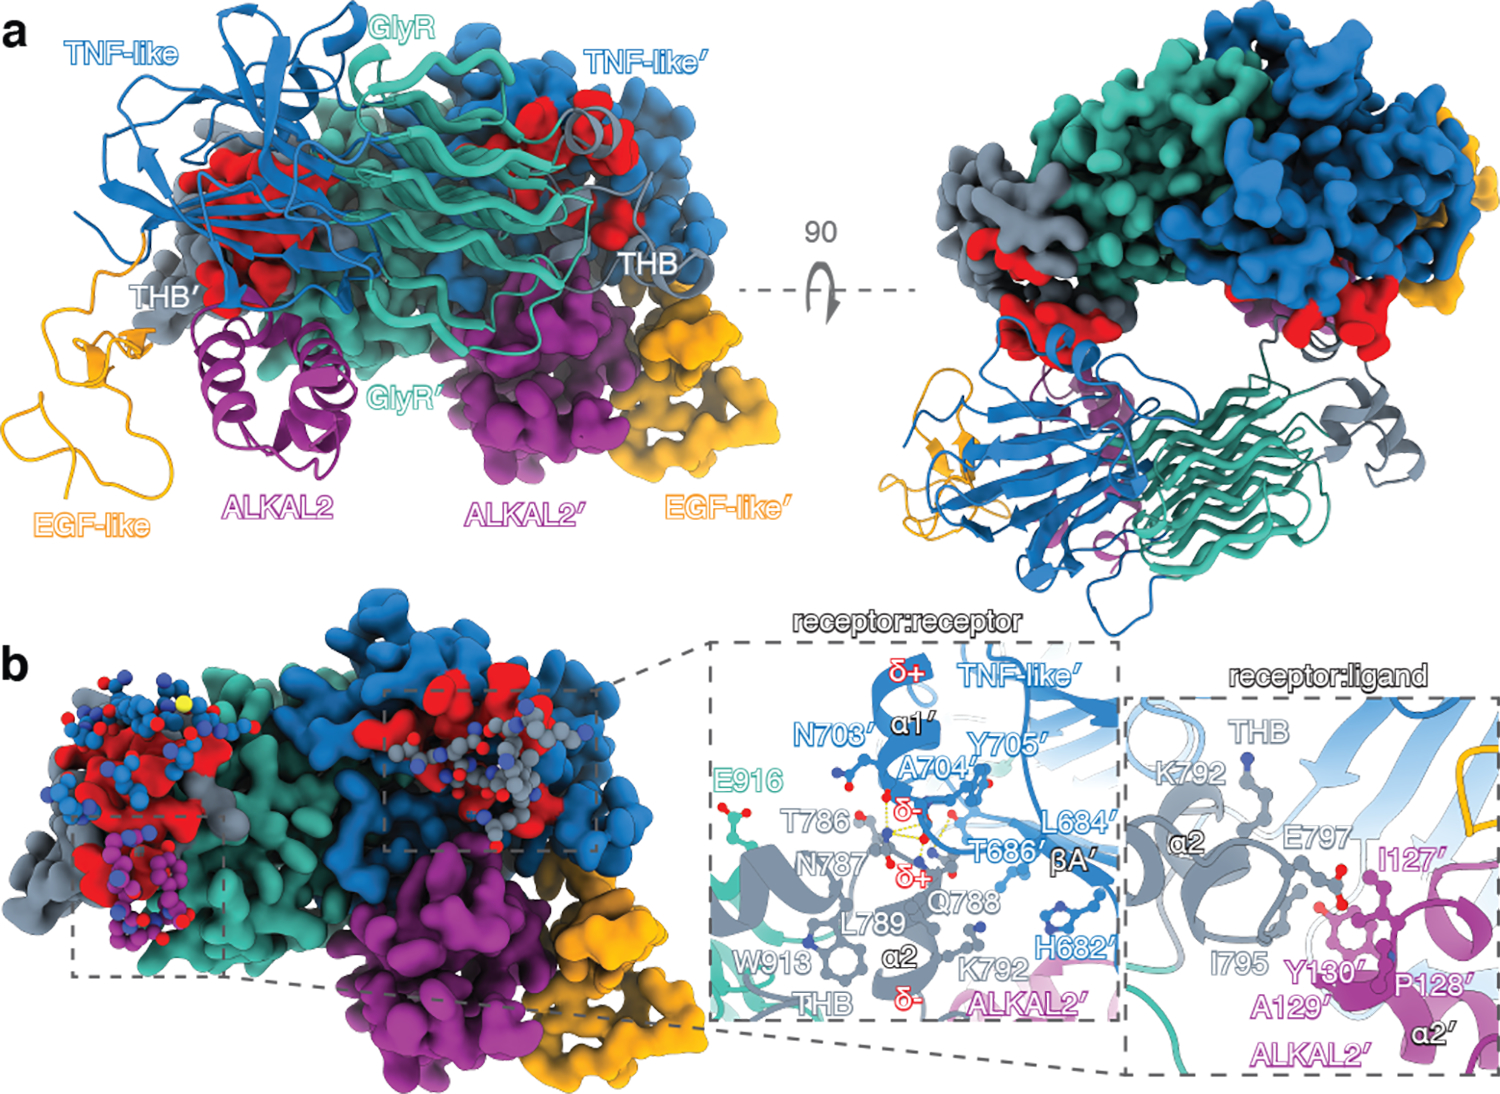
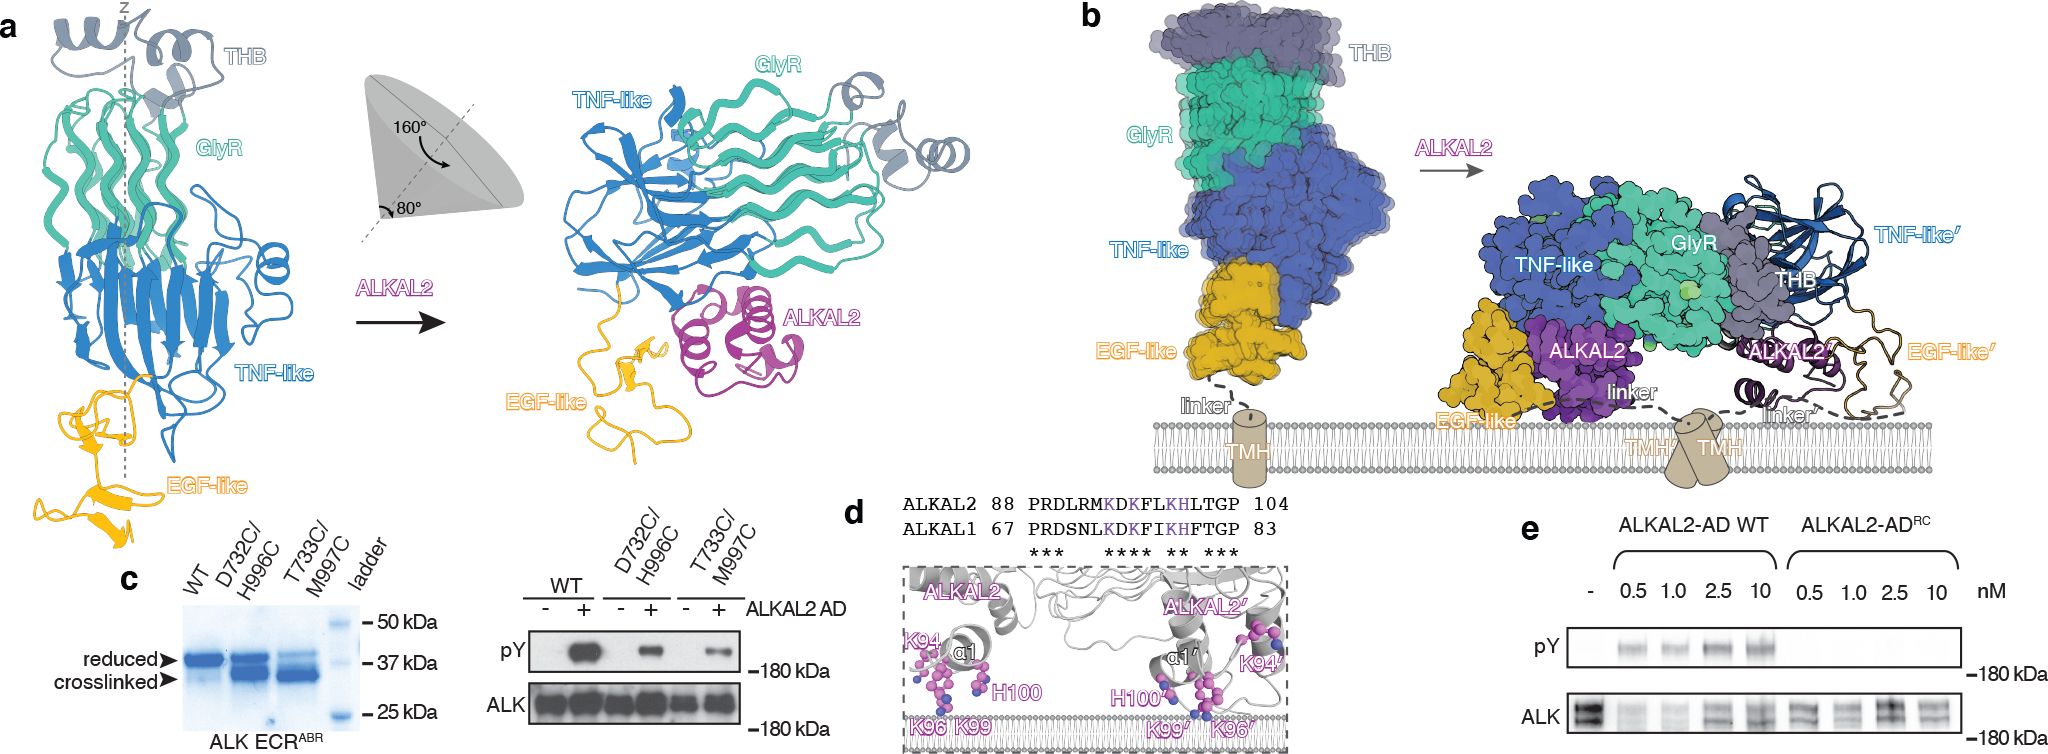
Anaplastic lymphoma kinase (ALK) is a receptor tyrosine kinase (RTK) that regulates important functions in the central nervous system1,2. The ALK gene is a hotspot for chromosomal translocation events that result in several fusion proteins that cause a variety of human malignancies3. Somatic and germline gain-of-function mutations in ALK were identified in paediatric neuroblastoma4-7. ALK is composed of an extracellular region (ECR), a single transmembrane helix and an intracellular tyrosine kinase domain8,9. ALK is activated by the binding of ALKAL1 and ALKAL2 ligands10-14 to its ECR, but the lack of structural information for the ALK-ECR or for ALKAL ligands has limited our understanding of ALK activation. Here we used cryo-electron microscopy, nuclear magnetic resonance and X-ray crystallography to determine the atomic details of human ALK dimerization and activation by ALKAL1 and ALKAL2. Our data reveal a mechanism of RTK activation that allows dimerization by either dimeric (ALKAL2) or monomeric (ALKAL1) ligands. This mechanism is underpinned by an unusual architecture of the receptor-ligand complex. The ALK-ECR undergoes a pronounced ligand-induced rearrangement and adopts an orientation parallel to the membrane surface. This orientation is further stabilized by an interaction between the ligand and the membrane. Our findings highlight the diversity in RTK oligomerization and activation mechanisms.


Conflict of interest statement

Competing interests C.G.K. is a consultant for BridgeBio.

Figures

Extended Data Fig. 1 |
Extended Data Fig. 1 |. Structural features of ALK ECRABR.
a, 1H-15N–correlated (left panel) and 1H-13C–correlated (right panel) spectra of [U-2H,15N; Ala-13CH3; Met-13CH3; Ile-δ1-13CH3; Leu,Val-13CH3/13CH3; Thr-13CH3]-labelled ALK ECRABR. b, 1H-13C–correlated spectra of [U-2H; Phe-δ−13CH; Tyr-ε−13CH]-labeled ALK ECRABR. c, Select strips from 13C-edited NOESY experiments highlighting intra-domain NOEs between TNF-like and EGF-like. d, Close-up view of the TNF-like−EGF-like interface and close-range inter-proton contacts (within ~7 Å) observed from the NOESY NMR analysis of spectra shown in (c). e, Asymmetric unit content of ALK ECRABR-ΔEGF crystals. f, 2Fo-Fc map of ALK ECRABR-ΔEGF depicted at 0.951 contour level for chain A. g, B-factors of ALK ECRABR-ΔEGF (chain A) are mapped on its structure. The tube radius is proportional to the B-factor. Low-to-high B-factors are also denoted in a blue-to-red color gradient. h, Topology diagram of ALK ECRABR-ΔEGF. PGII helices are shown in green tubes, β-strands in arrows and α helices in cylinders. i, Superposition of the following structures: ALK ECRABR GlyR (grey, this work), glycine rich domain of GTP-binding protein Obg (red, PDB ID 1LNZ), acetophenone carboxylase (blue, PDB ID 5L9W), antifreeze protein (yellow, PDB ID 3BOG), and gp38 bacteriophage adhesin tip (green, PDB ID 6F45). j, Schematic representation of the GlyR PGII array shown in a top view. Solid hexagons denote PGII helices with an N-to-C direction towards the reader whereas open hexagons denote PGII helices in the opposite direction. k, Side view of the GlyR PGII array in ball-and-stick representation. l, Top view of GlyR PGII array showing inter-chain hydrogen bond network (grey dashes). m, Close-up view of the TNF-like−EGF-like interface.
Extended Data Fig. 2 |
Extended Data Fig. 2 |. ALK/LTK sequence comparison and structural characterization of ALKAL2.
a, Schematic representation of domain organization for human ALK and LTK receptors (left panel). Sequence alignment of ALK and LTK ECRs (right panel). The secondary structure diagram is shown based on the ALK ECRABR structure determined in this work. Cys residues are colored red and disulfide bridges are shown with red lines. Residues participating in ALKAL2 binding are colored magenta, and residues participating in inter-protomer dimerization are underlined and colored blue (contacts with TNF-like) and gray (contacts with THB). The key residues involved in ALKAL2 binding are conserved between ALK and LTK (highlighted with magenta in LTK sequence), with the exception of F143, S260, L361, Q362, A365, T367, E374, R376, D388, Q390 and L401 (LTK numbering, underlined with black lines). The difference in ALKAL2/1 specificity might be explained by the H120/Y99 and D124/E103 substitutions (ALKAL2/1 respectively) and/or difference in the receptor-receptor dimerization interface. b, SEC-MALS (upper panel) analysis of ALKAL2-AD at eluted concentrations of ∼67 μM (red), 11 μM (blue) and 1 μM (magenta). Molecular masses in kDa determined by in-line MALS (left axis) are included. SV-AUC profile of ALKAL2-AD (lower panel). Concentrations used are: 233.53 (purple), 111.25 (blue) and 55.62 μM (cyan). c, 1H-15N–correlated (left panel) and 1H-13C–correlated (right panel) NMR spectra of ALKAL2-AD. d, NMR ensemble of the 20 lowest-energy conformers of ALKAL2-AD. e, Electrostatic surface representation of ALKAL2-AD. The electrostatic potential is measured in eV, with range as shown in the corresponding color bar (from-5.000 to +5.000 eV). f, NMR ensemble of the 20 lowest-energy conformers of ALKAL1-AD. g, SV-AUC profile and sedimentation coefficient distribution model c(s) of MBP-ALKAL2C66Y (left panel). Concentrations used are: 96.9 μM (purple), 48.5 μM (blue), 29.4 μM (cyan), 12.1 μM (green), 6.9 μM (yellow), 3.5 μM (orange) and 1.7 μM (red). Isotherm of the signal-weight-average s-values (sw) for MBP- ALKAL2C66Y obtained by integration of c(s) distributions over the s-range of 2.5 and 5 S for each loading concentration in a dilution series (right panel). The confidence intervals of the fits are presented in the lower panel. h, Superposition of NMR-solved and AlphaFold-predicted structures of ALKAL2 (left panel) and ALKAL1 (right panel). AD and VR regions are labeled. i, SV-AUC profile of ALK ECRABR-ALKAL2-AD. Concentrations used are: 177.8 (purple), 87.87 (blue), 43.93 (cyan), 20.92 (green), 10.46 (yellow), 5.44 (orange) and 2.72 μM (red). j, SV-AUC profile and sedimentation coefficient distribution model c(s) of MBP-ALKAL1. The highest (96.6 μM - purple) and lowest (4.8 μM - orange) concentrations are shown. k, SEC-MALS profile for the ALK ECRABR−MBP-ALKAL1 complex (blue, theoretical mass of 91 kDa for 1:1 complex). The profile for the ALK ECRABR−MBP-ALKAL2C66Y complex (red, theoretical mass of 189 kDa for 2:2 complex) is included for direct comparison. l, Sedimentation velocity analytical ultracentrifugation profile of ALK ECRABR:MBP-ALKAL1 (loading concentration 74 μM).
Extended Data Fig. 3 |
Extended Data Fig. 3 |. Characterization of the binding mode and oligomeric state of the ALK ECRABR:ALKAL2 complex.
a, SEC-MALS profiles of ALK ECRABR-ALKAL2C66Y complex. The corresponding isotherm of the signal-weight-average MW as a function of concentration is shown in the right panel. Standard errors were determined according to. b, Sedimentation velocity analytical ultracentrifugation isotherm of the signal-weight-average s-values for ALK ECRABR:ALKAL2C66Y complex. c, SEC-MALS profile (red) of ALK ECRABR:MBP-ALKAL2C66Y complex mixed at 2:1 ratio. SDS/PAGE for corresponding fractions are shown in the right panel. Bands corresponding to ALK ECRABR or MBP-ALKAL2C66Y are labeled, position of molecular weight markers are indicated. d, e, ALK auto-phosphorylation assays. d, ALK variants (as indicated in the labels) stably expressed in NIH/3T3 cells were stimulated with 10 nM of purified WT ALKAL2-AD. e, Wild type ALK stably expressed in NIH/3T3 cells was stimulated with 10 nM of purified ALKAL2-AD variants. Cell lysates were subjected to immunoprecipitation using anti-ALK antibodies followed by SDS/PAGE and immunoblotting with anti-pTyr (pY) and anti-ALK (ALK) antibodies. Relative position of the band for 180 kDa Mw marker is shown. f, SEC-MALS profiles of ALK ECRABR−4M:ALKAL22M complex. ALK ECRABR−4M stands for T686A/N787A/Q788A/I795A mutations in ALK ECRABR, and ALKAL22M for full-size ALKAL2C66Y harboring I127A/Y130A mutations. The corresponding isotherm of the signal-weight-average MW as a function of concentration is shown in the right panel. Standard errors were determined according to. g, Sedimentation velocity analytical ultracentrifugation isotherm of the signal-weight-average s-values for ALK ECRABR−4M-ALKAL2M complex.
Extended Data Fig. 4 |
Cryo-EM data processing workflow of ALK ECRABR-ALKAL2C66Y and evaluation of the reconstruction.
Extended Data Fig. 5 |
Extended Data Fig. 5 |. ALK ECRABR rearrangements upon ALKAL2 binding.
a, d and e, Superposition of ALKAL2 (a), GlyR-TNF-like (d) and EGF-like (e) structures in unliganded (pink) and liganded (blue) states. b, ALKAL2-induced repositioning of ALK ECRABR. c, Cartoon representation of the hetero-tetrameric ALK ECRABR-ALKAL2 complex wherein the 13-residue-long linker tethering EGF-like to TMH has been modeled in an extended conformation. The modeling shows that if EGF-like did not change its position upon ALKAL2 binding (EGF-like unliganded position shown in dark red) TMH dimerization would not be possible because the linker is too short. The model for the linker was manually built in Coot and follows the shortest possible path to reach the TMH. f, Superposition of EGF-like structures in the unliganded (orange) and ALKAL2-bound (grey) states demonstrates the conformational changes in EGF-like between the two states. g, Residues at the interface between EGF-like in unliganded state and TNF-like (left panel) and between EGF-like in ALKAL2-bound state and ALKAL2 (right panel). i, Wild type trx-ALKAL2-AD (gray) and trx-ALKAL2-AD variants (magenta) were tested for their ability to bind wild type ALK ECRABR using BLI. Steady-state dissociation constants and standard errors were determined according to. j, Comparison of tyrosine auto-phosphorylation of WT ALK stimulated by 10 nM of purified ALKAL2 variants as indicated. ALKAL2-ADRC stands for mutation of four charged residues - K94E/K96E/K99E/H100E; Trx-ALKAL2-AD is N-terminal fusion of ALKAL2 with thioredoxin, and ALKAL2-ADΔɑ1 is deletion of ɑ1 helix (residue boundaries 103–152). NIH3T3 cells stably expressing WT ALK were lysed after ALKAL2 stimulation and were subjected to immunoprecipitation using anti-ALK antibodies followed by SDS/PAGE and immunoblotting with anti-pTyr (pY) and anti-ALK (ALK) antibodies. Relative position of the band for 180 kDa Mw marker is shown. h, Close-up views of residues (CA atoms shown) D732, H996 and T733, M997 is shown. These residues were mutated to Cys for the cross-linking experiments.
Extended Data Fig. 6 |
Extended Data Fig. 6 |. NMR analysis of ALK ECRABR–ALKAL2-AD and ALK ECRABR–ALKAL1-AD complexes.
a, b, Superimposed 1H-13C–correlated spectra of ALK ECRABR-ALKAL2-AD (a) and ALK ECRABR-ALKAL1-AD (b) complexes. ALK ECRABR and ALKAL proteins are 1H-13C labeled in the indicated methyl groups. c, d, Chemical shift perturbation induced by ALKAL1-AD binding to ALK ECRABR to combined 1H and 15N amide atoms (c) and 1H and 13C methyl atoms (d). e, f, Chemical shift perturbation induced by ALKAL1-AD mapped onto the ALK ECRABR structure. g, NMR characterization of ALKAL1-AD binding to ALK ECRABR. Select strips from 13C-edited NOESY experiments showing inter-molecular NOEs between ALK ECRABR and ALKAL1-AD. Similar results were obtained when ALKAL2-AD was used, confirming that the structure observed in the frozen sample used in cryo-EM is the same in solution. h, NMR characterization of the EGF-like domain repositioning upon ALKAL1 binding to ECRABR. Select strips from 13C-edited NOESY experiments for ALK ECRABR showing inter-domain NOEs in the unbound form. Characteristic NOE patterns between Met997 of the EGF-like domain and the indicated residues of the TNF-like domain (right panel) changed dramatically upon ligand binding and demonstrate pronounced re-orientation of the EGF-like domain as shown schematically on the right panel.
Fig. 1|
Fig. 1|. Structural features of ALK ECRABR and ALKAL2.
a, Domain organization of human ALK. b, Structure of ALK ECRABR determined by X-ray crystallography and NMR spectroscopy. Disulfide bonds are shown in ball-and-stick with sulfur atoms colored in yellow. Secondary structure elements are labeled. PGII helices are shown as tubes. c, Domain organization of human ALKAL2. SP, signal peptide. d, Solution NMR structure of ALKAL2-AD. Key hydrophobic contacts stabilizing the ALKAL2 fold are shown (lower panel). e, SEC-MALS data for ALK ECRABR–ALKAL2C66Y complex, ALK ECRABR–ALKAL2-AD complex, and ALK ECRABR (theoretical masses are 108 kDa, 46 kDa, and 37 kDa, respectively). RI signal is normalized, molecular masses in kDa as determined by in-line MALS.
Fig. 2|
Fig. 2|. Cryo-EM structure of the hetero-tetrameric ALK ECRABR-ALKAL2 complex.
a, Cryo-EM structure of the hetero-tetrameric ALK ECRABR–ALKAL2 complex shown as cartoon model with C2 symmetry axis. b, Structure of ALK ECRABR–ALKAL2 showing the protein-ligand interface (only one subunit is shown). c, Immunoblots showing autophosphorylation of ALK variants in cells stimulated with 10 nM of ALKAL2-AD. pY, phospho-tyrosine; position of the 180 kDa MW marker is shown. d, Binding affinities of ALK ECRABR variants harboring substitutions in the TNF-like (blue) or EGF-like (orange) domains for ALKAL2-AD, or of ALKAL2-AD mutants (magenta) for wild-type ALK ECRABR, measured by BLI. For variants with no detectable binding, the Kd is shown as 1000 nM (detection limit). Steady-state dissociation constants and standard errors were determined as described in the methods section.
Fig. 3 |
Fig. 3 |. Structural features of the ALK ECRABR-ALKAL2 tetramerization interface.
a, Structure of the hetero-tetrameric ALK ECRABR–ALKAL32 complex. One hetero-dimer is shown in cartoon representation and the other (′) in surface rendering with the surface involved in tetramerization colored in red. b, The tetramerization interface is highlighted, by showing only the residues from the first hetero-dimer that mediate tetramerization in ball-and-stick; the second hetero-dimer is displayed as in panel a. Close-up views of ALK ECRABR–ECRABR′ and ALK ECRABR–ALKAL2′ interfaces are shown. Yellow dashed lines denote hydrogen bonds; δ indicates the dipole moment of the helices.
Fig. 4 |
Fig. 4 |. ALKAL2-mediated receptor dimerization.
a, ALKAL2-induced repositioning of ALK-ECRABR with respect to the stationary EGF-like domain. b, The transition of ALK ECRABR from unliganded monomer to hetero-tetrameric complex with ALKAL2 is shown with respect to the membrane. See also Supplementary Video 1. c, SDS-PAGE (left) and immunoblots showing auto-phosphorylation of ALK variants in cells stimulated with 10 nM of ALKAL2-AD. SDS-PAGE was performed in non-reducing conditions to monitor crosslinking between EGF-like and TNF-like domains. d, Top, sequence alignment of α1 helix in ALKAL1 and ALKAL2, with conserved positively charged residues in magenta. Bottom, cartoon representation highlighting the positively charged residues in helix α1 of ALKAL2 that are poised to engage with the negatively charged membrane surface via electrostatic interactions. e, Immunoblots showing autophosphorylation of WT ALK in cells stimulated with indicated concentrations of ALKAL2-AD WT or ALKAL2-ADRC. pY, phospho-tyrosine; position of the180 kDa MW marker is shown in c (right) and e.

Similar articles

Cited by

References

    1. Morris SW et al. Fusion of a kinase gene, ALK, to a nucleolar protein gene, NPM, in non-Hodgkin’s lymphoma. Science 263, 1281–1284, doi:10.1126/science.8122112 (1994). - DOI - PubMed
    1. Orthofer M et al. Identification of ALK in Thinness. Cell 181, 1246–1262 e1222, doi:10.1016/j.cell.2020.04.034 (2020). - DOI - PubMed
    1. Hallberg B & Palmer RH Mechanistic insight into ALK receptor tyrosine kinase in human cancer biology. Nat Rev Cancer 13, 685–700, doi:10.1038/nrc3580 (2013). - DOI - PubMed
    1. Chen Y et al. Oncogenic mutations of ALK kinase in neuroblastoma. Nature 455, 971–974, doi:10.1038/nature07399 (2008). - DOI - PubMed
    1. George RE et al. Activating mutations in ALK provide a therapeutic target in neuroblastoma. Nature 455, 975–978, doi:10.1038/nature07397 (2008). - DOI - PMC - PubMed

Publication types

MeSH terms