. 2021 Nov 8:12:736419.
doi: 10.3389/fpls.2021.736419. eCollection 2021.

Genome-Wide Analysis of CCT Transcript Factors to Identify Genes Contributing to Photoperiodic Flowering in Oryza rufipogon

Affiliations

Genome-Wide Analysis of CCT Transcript Factors to Identify Genes Contributing to Photoperiodic Flowering in Oryza rufipogon

Xin Peng et al. Front Plant Sci. .

Abstract

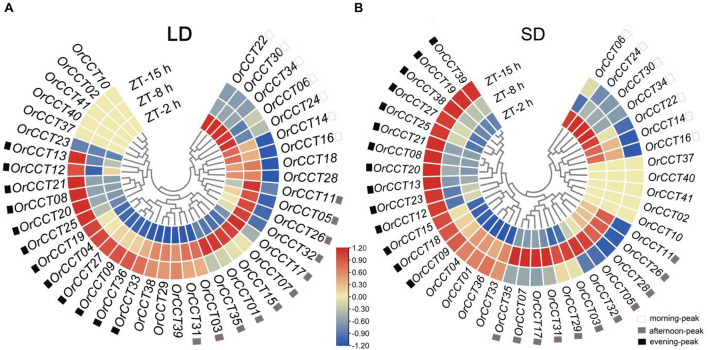
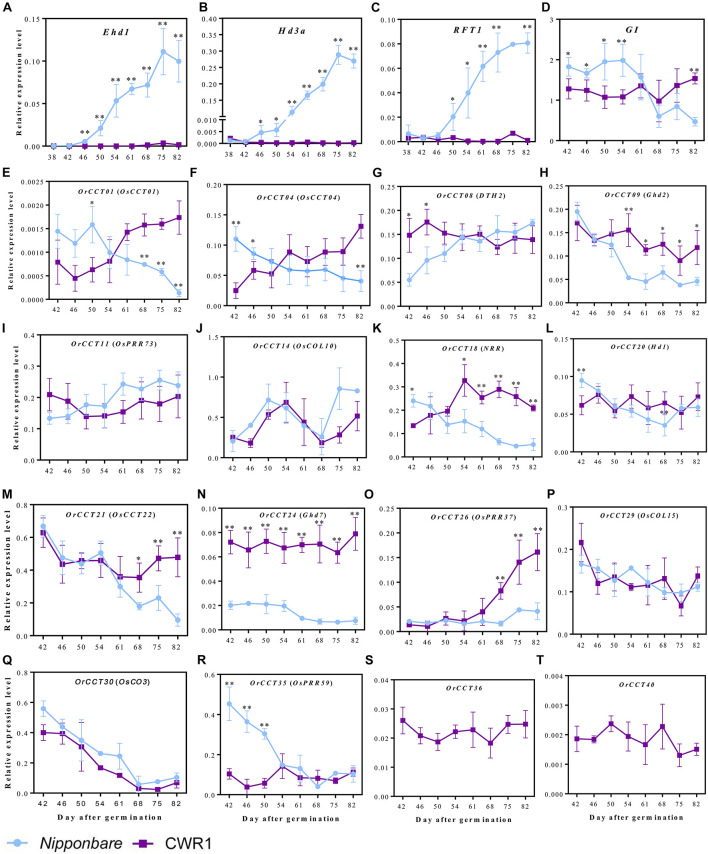
Photoperiod sensitivity is a dominant determinant for the phase transition in cereal crops. CCT (CONSTANS, CO-like, and TOC1) transcription factors (TFs) are involved in many physiological functions including the regulation of the photoperiodic flowering. However, the functional roles of CCT TFs have not been elucidated in the wild progenitors of crops. In this study, we identified 41 CCT TFs, including 19 CMF, 17 COL, and five PRR TFs in Oryza rufipogon, the presumed wild ancestor of Asian cultivated rice. There are thirty-eight orthologous CCT genes in Oryza sativa, of which ten pairs of duplicated CCT TFs are shared with O. rufipogon. We investigated daily expression patterns, showing that 36 OrCCT genes exhibited circadian rhythmic expression. A total of thirteen OrCCT genes were identified as putative flowering suppressors in O. rufipogon based on rhythmic and developmental expression patterns and transgenic phenotypes. We propose that OrCCT08, OrCCT24, and OrCCT26 are the strong functional alleles of rice DTH2, Ghd7, and OsPRR37, respectively. The SD treatment at 80 DAG stimulated flowering of the LD-grown O. rufipogon plants. Our results further showed that the nine OrCCT genes were significantly downregulated under the treatment. Our findings would provide valuable information for the construction of photoperiodic flowering regulatory network and functional characterization of the CCT TFs in both O. rufipogon and O. sativa.

Keywords: CCT genes; Oryza rufipogon; expression profiles; genomic synteny; photoperiodic flowering regulation; rice.


Conflict of interest statement

The authors declare that the research was conducted in the absence of any commercial or financial relationships that could be construed as a potential conflict of interest.

Figures

FIGURE 1
FIGURE 1
Phylogenetic relationship, gene structure, and conserved motifs of OrCCT TFs in O. rufipogon. (A) Phylograms of OrCCT TFs were constructed based on the full-length protein sequences. Different subfamilies are highlighted with different colors. PRR in yellow, COL in green, and CMF in red. (B) Exon-intron structure and conserved domains of OrCCT TFs. (C) The motif patterns of OrCCT proteins. The sequence information for each motif is given in Supplementary Table 3.
FIGURE 2
FIGURE 2
The inter-chromosomal relationship among CCT genes. (A,B) The chromosome distribution and gene duplication events in O. rufipogon (A) and O. sativa (B). The approximate location of each CCT gene is marked on corresponding chromosomes. The blue lines indicate the duplicated OrCCT genes, and gray lines in the background represent all duplication blocks within genomes. (C) The collinear relationship of CCT genes between O. rufipogon and O. sativa. The blue lines indicate orthologous gene pairs, while the red line shows that the CCT gene was likely generated after the domestication of O. sativa. The specific CCT genes of O. sativa and O. rufipogon are marked with orange and blue triangles on the corresponding positions of chromosomes, respectively.
FIGURE 3
FIGURE 3
Phylogenetic relationships of CCT TFs among B. distachyon, O. sativa ssp. japonica, O. sativa ssp. indica, O. nivara, and O. rufipogon. (A) The species tree following the number of CCT TFs among the investigated species; (B) Phylogenetic tree representing relationships among CCT TFs from the four plant species. The pink and green circles of the terminal node indicate COL gene with 1 and 2 BBOX, respectively. The prefixes of tree labels are Bd, B. distachyon; Os, O. sativa ssp. japonica; Ind, O. sativa ssp. indica; On, O. nivara, and Or, O. rufipogon. The subfamilies are marked with red line: CMF; blue: COL; yellow: PRR. The locus of CCT TFs presenting here is listed in Supplementary Table 6.
FIGURE 4
FIGURE 4
The daily expression profiles of OrCCT genes under LD (A) and SD conditions (B) at 90 DAG in O. rufipogon (CWR1). The heatmaps were drawn by FPKM values with row scale normalization (n = 3). The prefix ZT-2 h, ZT-8 h, and ZT-15 h indicate 2 h, 8 h, 15 h ZT, respectively.
FIGURE 5
FIGURE 5
The transcript levels of Ehd1 (A), Hd3a (B), RFT1 (C), OsGI (D), and 16 CCT genes (E–T) in leaf blades of Nipponbare and O. rufipogon (CWR1) at different developmental stages. Leaf blade samples were isolated at ZT-2 h, ZT-8 h, and ZT-15 h at 4 days intervals starting from 38 DAG. Transcript levels are relative to OsUbi1. Error bars indicate standard deviation for five biological replicates. , ∗∗ significant differences by Student’s t-test at P ≤ 0.05 and P ≤ 0.01, respectively.
FIGURE 6
FIGURE 6
The photoperiod response to 10 days SD-treatment from 40 DAG to 50 DAG in Nipponbare and O. rufipogon (CWR1) plants. (A) Scheme for SD treatment. (B–D) The expression pattern of Ehd1, Hd3a, and RFT1 in the plants of Nipponbare and O. rufipogon (CWR1) with 10 days SD-treatment. The y-axis shows the relative expression levels of genes with rice OsUbi1 as an internal control; the x-axis presents the day of SD treatment. Values are means ± SD (n = 5). *, ** significant differences by student’s t-test at P ≤ 0.05 and P ≤ 0.01, respectively. (E) The heading date for LD-grown plants and SD-treated plants. (F) Phenotypes of mock (left) and SD-treated Nipponbare plants (right). (G) The phenotype of CWR1 with 10 days SD-treatment at 80 DAG. Bar = 10 cm in (F,G).
FIGURE 7
FIGURE 7
The response to SD-induction starting from 80 DAG in O. rufipogon (CWR1). (A) Scheme of SD treatment; (B–D) The expression level of OrEhd1 (B), OrRFT1 (C), and OrHd3a (D) in the leaf blades of CWR1 plants with mock and SD-treatment. The x-axis presents the days of SD treatment. (E) The transcript level of 41 OrCCT genes in the leaf blades of O. rufipogon (CWR1) after 10 days of SD-treatment. The transcript levels were relative to OsUbi1. Values are means ± SD (n = 5). *, ** significant differences by Student’s t-test at P ≤ 0.05 and P ≤ 0.01, respectively. (F) The phenotypes of O. rufipogon (CWR1) plants with mock and SD-treatment (right) at 140 DAG. Bar = 10 cm in (F).
FIGURE 8
FIGURE 8
Expression and phenotype analyses of OrCCT24-overexpression plants under LD condition. (A) Scheme of OrCCT24 overexpressed vector. (B–E) The expression level of OrCCT24 (B), Ehd1 (C), Hd3a (D), and RFT1 (E) in WT and OrCCT24-overexpressed plants. The transcript levels were relative to OsUbi1. Error bars indicate standard deviations (n = 5). Leaf blades were harvested at ZT-2 h at 60 DAG. (F) Phenotypes of OrCCT24-overexpressed plants (T0 generation) compared with WT at 90 DAG. (G) Phenotypes of OrCCT24 overexpressed plants at 220 DAG. Scale bar = 10 cm.
FIGURE 9
FIGURE 9
CCT TFs involved regulatory network for flowering time of O. rufipogon under LD. The clock at the top designates the circadian clock. Black arrows represent induction, and black bars indicate suppression. Red arrows show strong induction, and red bars denote strong suppression. The virtual line shows indirect effect.

Similar articles

Cited by

References

    1. An G., Ebert P. R., Mitra A., Ha S. B. (1989). “Binary vectors,” in Plant Molecular Biology Manual, ed. Kluwer Academic Publisher (Dordrecht: Springer; ), 29–47.
    1. Bailey T. L., Boden M., Buske F. A., Frith M., Grant C. E., Clementi L., et al. (2009). MEME SUITE: tools for motif discovery and searching. Nucleic Acids Res. 37 W202–W208. 10.1093/nar/gkp335 - DOI - PMC - PubMed
    1. Chen C., Chen H., Zhang Y., Thomas H. R., Frank M. H., He Y., et al. (2020). TBtools: an integrative toolkit developed for interactive analyses of big biological data. Mol. Plant 13 1194–1202. 10.1016/j.molp.2020.06.009 - DOI - PubMed
    1. Cho L., Yoon J., An G. (2017). The control of flowering time by environmental factors. Plant J. 90 708–719. 10.1111/tpj.13461 - DOI - PubMed
    1. Cho L., Yoon J., Pasriga R., An G. (2016). Homodimerization of Ehd1 is required to induce flowering in rice. Plant Physiol. 170 2159–2171. 10.1104/pp.15.01723 - DOI - PMC - PubMed