

Correlation between Apelin and Some Angiogenic Factors in the Pathogenesis of Preeclampsia: Apelin-13 as Novel Drug for Treating Preeclampsia and Its Physiological Effects on Placenta
- PMID: 34819954
- PMCID: PMC8608536
- DOI: 10.1155/2021/5017362
Correlation between Apelin and Some Angiogenic Factors in the Pathogenesis of Preeclampsia: Apelin-13 as Novel Drug for Treating Preeclampsia and Its Physiological Effects on Placenta
Abstract
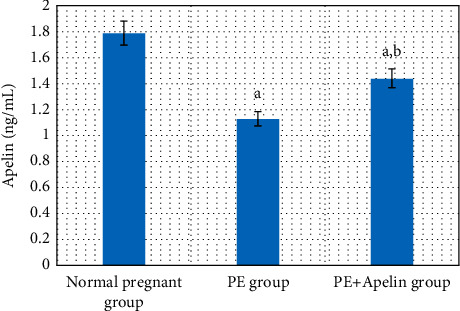
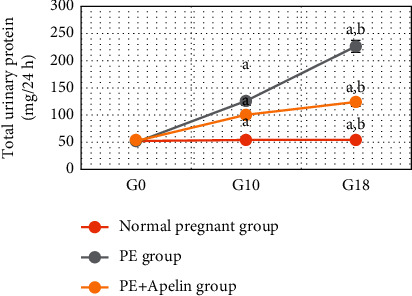
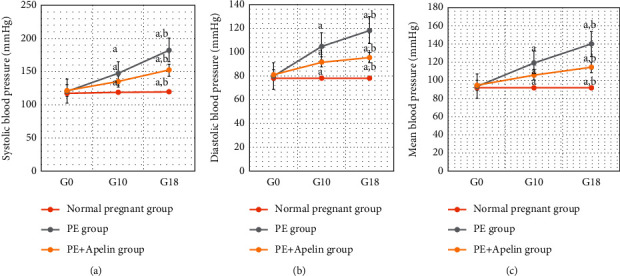
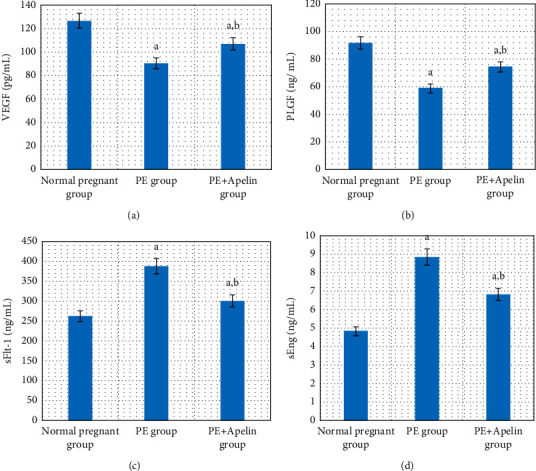
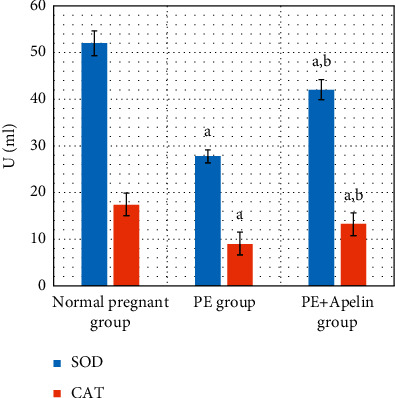
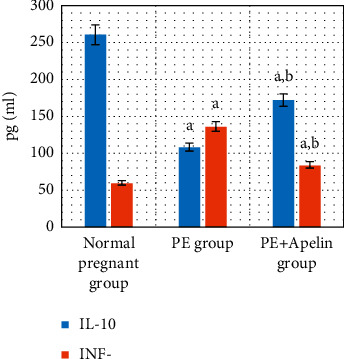
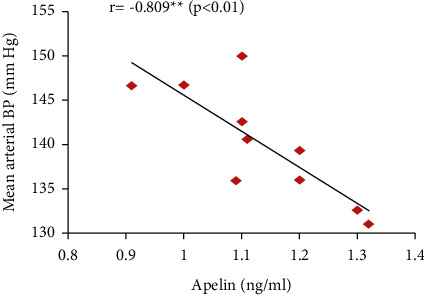
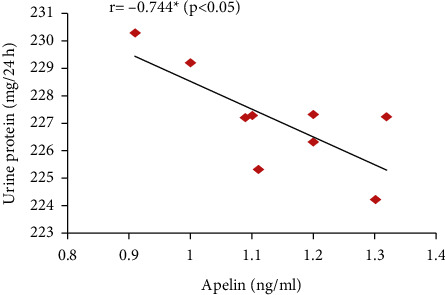
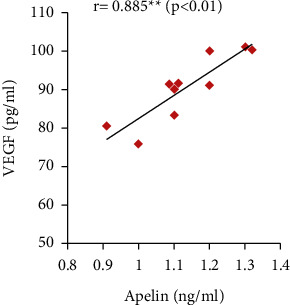
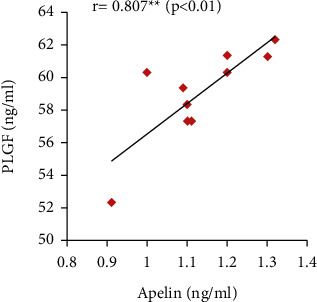
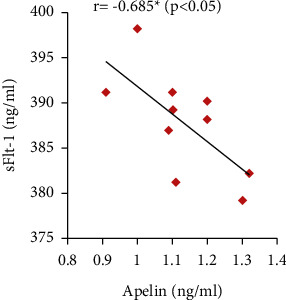
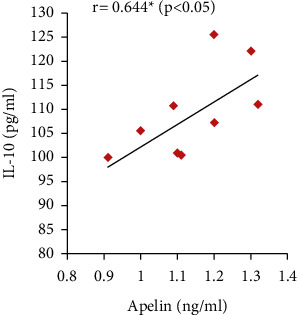
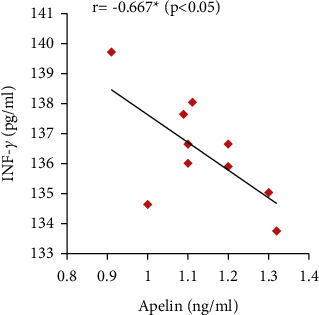
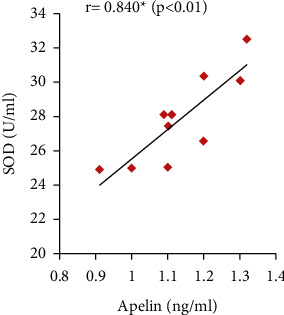
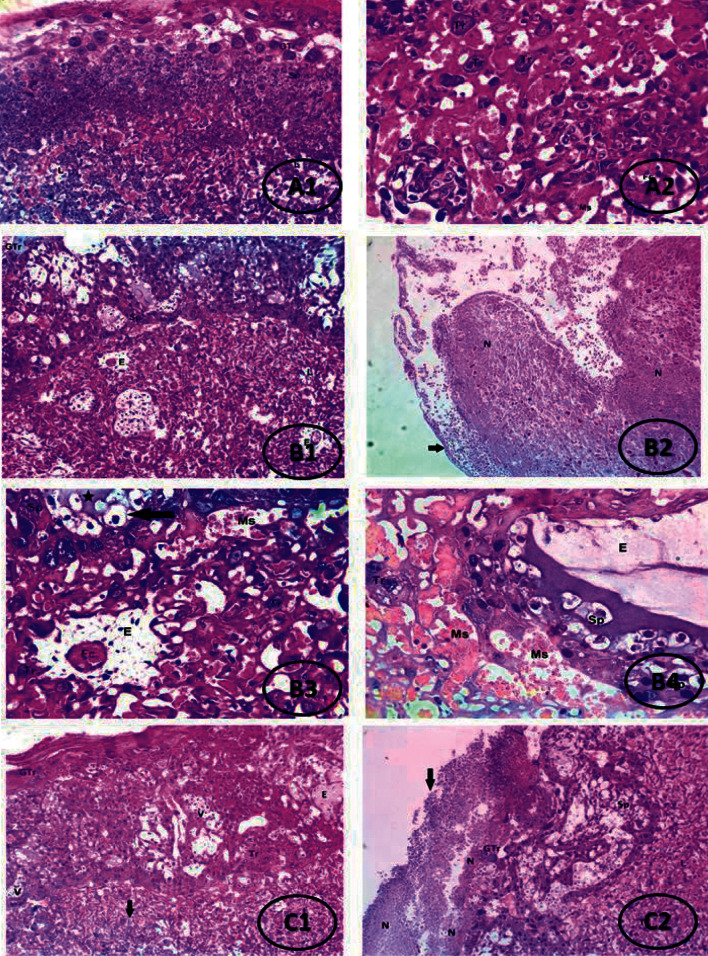
Preeclampsia (PE) is one of the commonest causes for maternal and fetal morbidity and mortality. Imbalances of angiogenic factors, oxidative stress, and inflammatory response have a role in the pathogenesis of PE. Data regarding the circulating apelin level and its role in PE remains controversial. This study was formulated to assess the serum apelin level in PE, investigate its correlation with some inflammatory, oxidative stress, and angiogenic proteins in a nitric oxide synthase inhibitor; the N (gamma)-nitro-L-arginine methyl ester (L-NAME)-induced rat model of PE and determine whether apelin administration could protect against development of PE. 40 healthy adult female albino rats and 10 adult male albino rats were used in this study. The pregnant female rats were randomly divided into three groups: group 1 (normal pregnant group), group 2 (PE-induced group), injected subcutaneously with 75 mg L-NAME/kg bodyweight/day starting from day 9 to 20 of gestation, and group 3 (PE-induced group supplemented with apelin (PE + apelin)); PE induced as before and simultaneously subcutaneously injected with apelin-13 (6 × 10⁻⁸ mol/kg bodyweight/twice daily) beginning from day 6 to 20 of gestation. In all groups, blood pressure and urine protein were determined at gestation days (GD) 0, 10, and 18. Moreover, serum apelin, placental growth factor (PLGF), vascular endothelial growth factor (VEGF), soluble fms-like tyrosine kinase-1 (sFlt-1), soluble endoglin (sEng), interferon-gamma (IFN-γ), and interleukin-10 (IL-10) levels and serum superoxide dismutase enzyme (SOD) and catalase (CAT) activities of all groups were estimated at the end of experiment. Placental histopathological examination was also performed. PE-induced rats showed significantly decreased serum apelin levels. Moreover, they showed significantly increased blood pressures, urine proteins, sFlt-1, sEng, and IFN-γ (mean arterial blood pressure, urine proteins, sFlt-1, sEng, and IFN-γ showed significant negative correlations with serum apelin level), but it showed significantly decreased VEGF, PLGF, IL-10, SOD, and CAT (VEGF, PLGF, IL-10, and SOD showed significant positive correlations with serum apelin level). In contrast, exogenous apelin administration significantly ameliorated these parameters together with improvement in the placental histoarchitecture in the apelin-supplemented PE group. This study demonstrated the protective effects of apelin administration on the pathogenesis of PE.
Copyright © 2021 Reham Z. Hamza et al.
Conflict of interest statement
The authors declare that they have no conflicts of interest.
Figures
References
-
- Farhood T. H., Ewadh M. J., Alshaik S. F. Reduced glutathione, lipid peroxidation and malondialdehyde status in women with mild and severe preeclampsia for babylon governorate. Indian Journal of Forensic Medicine & Toxicology . 2020;14(1):p. 763.
-
- Daskalakis G., Papapanagiotou A. Serum markers for the prediction of preeclampsia. Journal of Neurology & Neurophysiology . 2015;6(1):1–9. .
LinkOut - more resources
Full Text Sources
Miscellaneous
