. 2021 Nov 8:9:766978.
doi: 10.3389/fcell.2021.766978. eCollection 2021.

Vitamin D-Mediated Anti-cancer Activity Involves Iron Homeostatic Balance Disruption and Oxidative Stress Induction in Breast Cancer

Affiliations

Vitamin D-Mediated Anti-cancer Activity Involves Iron Homeostatic Balance Disruption and Oxidative Stress Induction in Breast Cancer

Khuloud Bajbouj et al. Front Cell Dev Biol. .

Abstract

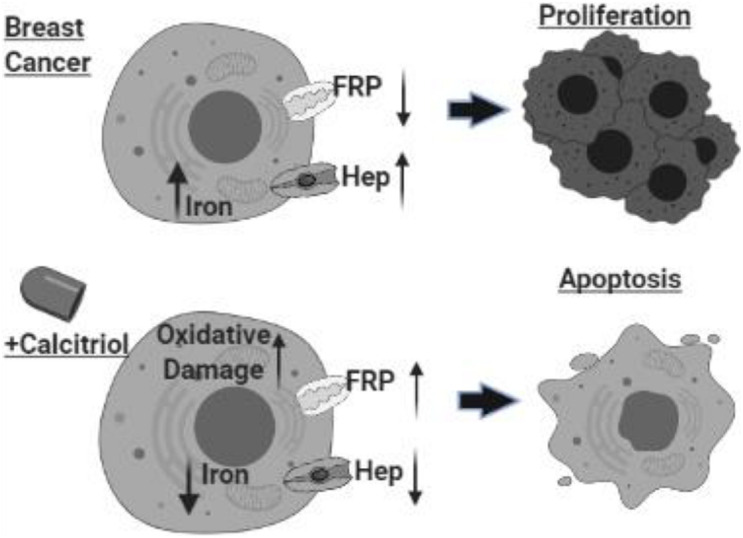
Background: Vitamin D deficiency associates with high risk of breast cancer (BRCA) and increased cellular iron. Vitamin D exerts some of its anti-cancer effects by regulating the expression of key iron regulatory genes (IRGs). The association between vitamin D and cellular iron content in BRCA remains ambiguous. Herein, we addressed whether vitamin D signaling exerts a role in cellular iron homeostasis thereby affecting survival of breast cancer cells. Methods: Expression profile of IRGs in vitamin D-treated breast cancer cells was analyzed using publicly available transcriptomic datasets. After treatment of BRCA cell lines MCF-7 and MDA-MB-231 with the active form of vitamin D, labile iron content, IRGs protein levels, oxidative stress, and cell survival were evaluated. Results: Bioinformatics analysis revealed several IRGs as well as cellular stress relates genes were differentially expressed in BRCA cells. Vitamin D treatment resulted in cellular iron depletion and differentially affected the expression of key IRGs protein levels. Vitamin D treatment exerted oxidative stress induction and alteration in the cellular redox balance by increasing the synthesis of key stress-related markers. Collectively, these effects resulted in a significant decrease in BRCA cell survival. Conclusion: These findings suggest that vitamin D disrupts cellular iron homeostasis leading to oxidative stress induction and cell death.

Keywords: breast cancer; cell death; iron; oxidative stress; vitamin D.


Conflict of interest statement

The authors declare that the research was conducted in the absence of any commercial or financial relationships that could be construed as a potential conflict of interest.

Figures

FIGURE 1
FIGURE 1
In silico analysis to investigate the effect of vitamin D treatment on breast cancer cells. (A) Volcano plot showing more than 5,000 genes were significantly up-/downregulated in MCF-7 and MDA-MB-231 cells. (B) Pathway analysis of differentially expressed genes showing enrichment of pathways related to the response to iron ion and oxidative stress. (C) Bar graph plot showing the mean expression values of iron metabolism and oxidative stress-related genes for both cell lines treated with calcitriol compared with DMSO-treated cells.
FIGURE 2
FIGURE 2
Assessment of BRCA cell viability following vitamin D treatment. Percentage cell viability of (A) MCF-7 and (B) MDA-MB-231 cells treated with 0.001, 0.01, 0.1, 1, and 10 μM vitamin D for 24, 48, and 72 h as measured by the MTT assay. **Represents statistically significant change (P < 0.01) in cell survival between calcitriol-treated and untreated controls at each time point tested.
FIGURE 3
FIGURE 3
Vitamin D disrupts cellular iron metabolism in BRCA cells. The status of hepcidin, FPN, TfR1, and TfR2 in vitamin D treated MCF-7 and MDA-MB-231 cells. (A) Gene expression was analyzed in from MCF-7 and MDA-MB-231 cells treated with vitamin D 10 μM and cultured for 6 h. (B) Cell lysates were prepared from MCF-7 and MDA-MB-231 cells treated with vitamin D 10 μM and cultured for 24 and 48 h. Shown data are representative of three separate experiments. (C) Quantitative analysis of relative protein band density after normalization to β-actin and compared to the control. **Represents statistically significant change (P < 0.01).
FIGURE 4
FIGURE 4
Vitamin D depletes labile cellular iron in BRCA cells. (A) Calcein-based flow cytometry method was used to assess labile iron pool (LIP) content in MCF-7 and MD-MBA-231 cells treated with 10 μM vitamin D. Difference in mean fluorescence intensity (ΔMFI) between calcein + chelator and calcein only is an indirect measurement of LIP content; the smaller the ΔMFI value, the lower the LIP content. (B) Ferritin expression was assessed in cell lysates of MCF-7 and MDA-MB-231 cells at 24 and 48 h post vitamin D treatment; untreated cells served as controls. The data shown are the mean MFI ± SEM of four separate experiments. (C) Quantitative analysis of relative protein band density after normalization to β-actin and compared to the control. *Represents statistically significant change (P < 0.05) and **Represents statistically significant change (P < 0.01).
FIGURE 5
FIGURE 5
Vitamin D alters the redox balance in BRCA cells in favor of oxidative stress. (A) ROS level expression following 3 and 6 h post vitamin D treatment. Expression of (B) the DNA damage sensor, g-H2AX, and (C) the redox balance regulators proteins catalase, Hif-1α and OH-1 levels in MCF-7 and MDA-MB-231 cells following at 24 and 48 h post-treatment with vitamin D. The data shown are representative of three separate experiments. (D) Quantitative analysis of relative protein band density after normalization to β-actin and compared to the control. **Represents statistically significant change (P < 0.01) and ***Represents statistically significant change (P < 0.001).
FIGURE 6
FIGURE 6
Proteome profiling of cell stress regulators in vitamin D-treated BRCA cells. Expression status of key cell stress regulators in (A) MCF-7 and (B) MDA-MB-231 cells using cell lysates prepared from cells at 24 h post-treatment with vitamin D. *Denotes the presence of statistically significant changes (p < 0.05) in protein expression in treated vs. control samples. **Represents statistically significant change (P < 0.01), ***Represents statistically significant change (P < 0.001).
FIGURE 7
FIGURE 7
Vitamin D treatment leads to cell cycle arrest at G1/S phase arrests in BRCA cells. (A) Cells treated with 10 μM vitamin D for 24 and 48 h as well as PI stain were used for untreated controls and analyzed. (B) cdk4 (U/mg protein), cdk6 (U/mg protein), and cyclin D1 (U/mg protein) were assayed for control, and MCF-7 and MDA-MB-231 cells treated with 10 μM of vitamin D for 24 and 48 h. (C) Quantitative analysis of relative protein band density after normalization to β-actin and compared to the control. **Represents statistically significant change (P < 0.01).
FIGURE 8
FIGURE 8
Vitamin D effect on apoptosis and cell survival in BRCA cells. (A) The Annexin V/PI flow cytometry-based method used to assess the percentage of apoptotic and pro-apoptotic in MCF-7 and MDA-MB-231 cells treated with 10 μM of vitamin D for 24 or 48 h. (B) Survivin expression was assessed in 10 μM of vitamin D-treated cell lysates and from untreated controls at 24 and 48 h post-culture. (C) Quantitative analysis of relative protein band density after normalization to β-actin and compared to the control. **Represents statistically significant change (P < 0.01).
FIGURE 9
FIGURE 9
Schematic illustration of study conclusion. Created with BioRender.com.

References

    1. Abbas S., Chang-Claude J., Linseisen J. (2009). Plasma 25-hydroxyvitamin D and premenopausal breast cancer risk in a German case-control study. Int. J. Cancer 124 250–255. 10.1002/ijc.23904 - DOI - PubMed
    1. Abo El-Magd N. F., Eraky S. M. (2020). The molecular mechanism underlining the preventive effect of vitamin D against hepatic and renal acute toxicity through the NrF2/ BACH1/ HO-1 pathway. Life Sci. 244:117331. 10.1016/j.lfs.2020.117331 - DOI - PubMed
    1. Artaza J. N., Sirad F., Ferrini M. G., Norris K. C. (2010). 1,25(OH)2vitamin D3 inhibits cell proliferation by promoting cell cycle arrest without inducing apoptosis and modifies cell morphology of mesenchymal multipotent cells. J. Steroid Biochem. Mol. Biol. 119 73–83. 10.1016/j.jsbmb.2010.01.001 - DOI - PMC - PubMed
    1. Audo I., Darjatmoko S. R., Schlamp C. L., Lokken J. M., Lindstrom M. J., Albert D. M., et al. (2003). Vitamin D analogues increase p53, p21, and apoptosis in a xenograft model of human retinoblastoma. Invest. Ophthalmol. Vis. Sci. 44 4192–4199. 10.1167/iovs.02-1198 - DOI - PubMed
    1. Bacchetta J., Zaritsky J. J., Sea J. L., Chun R. F., Lisse T. S., Zavala K., et al. (2014). Suppression of iron-regulatory hepcidin by vitamin D. J. Am. Soc. Nephrol. 25 564–572. 10.1681/ASN.2013040355 - DOI - PMC - PubMed