. 2021 Oct;9(10):e2021EF002150.
doi: 10.1029/2021EF002150. Epub 2021 Oct 11.

Probabilistic Evaluation of Drought in CMIP6 Simulations

Affiliations

Probabilistic Evaluation of Drought in CMIP6 Simulations

Simon Michael Papalexiou et al. Earths Future. 2021 Oct.

Abstract

As droughts have widespread social and ecological impacts, it is critical to develop long-term adaptation and mitigation strategies to reduce drought vulnerability. Climate models are important in quantifying drought changes. Here, we assess the ability of 285 CMIP6 historical simulations, from 17 models, to reproduce drought duration and severity in three observational data sets using the Standardized Precipitation Index (SPI). We used summary statistics beyond the mean and standard deviation, and devised a novel probabilistic framework, based on the Hellinger distance, to quantify the difference between observed and simulated drought characteristics. Results show that many simulations have less than ± 10 % error in reproducing the observed drought summary statistics. The hypothesis that simulations and observations are described by the same distribution cannot be rejected for more than 80 % of the grids based on our H distance framework. No single model stood out as demonstrating consistently better performance over large regions of the globe. The variance in drought statistics among the simulations is higher in the tropics compared to other latitudinal zones. Though the models capture the characteristics of dry spells well, there is considerable bias in low precipitation values. Good model performance in terms of SPI does not imply good performance in simulating low precipitation. Our study emphasizes the need to probabilistically evaluate climate model simulations in order to both pinpoint model weaknesses and identify a subset of best-performing models that are useful for impact assessments.

Keywords: CMIP6; Hellinger distance; climate change; droughts; precipitation; reliability of climate models.


Figures

Figure 1
Figure 1
Calculating drought duration and severity using SPI‐6 for a sample precipitation time series. Plots show (a) monthly precipitation time series, (b) SPI‐6 time series highlighting the drought periods, (c) the probability distribution of drought duration, and (d) the probability distribution of drought severity.
Figure 2
Figure 2
Spatial variation of observed (a) mean, (b) coefficient of variation, (c) skewness, and (d) maximum drought duration for the moderate (SPI1) case during 1963–2014 for CRU (see Figures S1 and S2 for GPCC and UDel, respectively).
Figure 3
Figure 3
Average agreement for drought duration statistics between CMIP6 runs and the three observational data sets (CRU, GPCC and UDel) for 1963–2014. (a–d) Spatial variation of average agreement in four statistics, (e–h) agreement versus observed statistics’ values.
Figure 4
Figure 4
The standard deviation (SD) of a statistic among the 285 simulations is estimated in each grid; then all estimated SDs in each latitudinal zone are depicted as violin plots: (a) mean, (b) coefficient of variation, (c) skewness, and (d) maximum of drought durations.
Figure 5
Figure 5
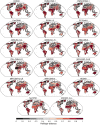
Percentage agreement between simulated and observed drought statistics based on Hellinger (H) distance and average H‐distances over the globe and different latitudinal zones. (a) The average percentage agreement of CMIP6 simulations with the three observations (CRU, GPCC, and UDel) based on H distance for the moderate drought duration, (b) spatial variability of average distance globally, (c and d) H distance for the tropical (23.5°N23.5°S) and north temperate (66.5°23.5°N) zones respectively; Lines represent 50% central Hdistance values. For individual data set (CRU, GPCC, and UDel) results see Figures S7–S9.
Figure 6
Figure 6
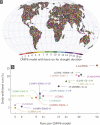
(a) Spatial variability of CMIP6 models corresponding to the best performing run according to the minimum average Hellinger (H) distance; the H distance for all three data sets is averaged; (b) relationship between the number of CMIP6 runs per model and the average percentage of grids where runs of the model perform best.
Figure 7
Figure 7
Spatial variability of (a) observed standard deviation, (b) observed skewness of drought severity for the CRU data set (see Figures S11 and S12 for GPCC and UDEL, respectively).
Figure 8
Figure 8
Average percentage agreement of CMIP6 simulations with the observed (a) Standard Deviation (SD) and (b) skewness of drought severity. The percentage agreement for each data set SD and skewness is averaged. Scatter plots between the average percentage agreement of CMIP6 simulations and average observed (c) SD (d) skewness of severity over all land areas for moderate droughts.
Figure 9
Figure 9
Model performance in reproducing the distribution of low monthly precipitation values defined by the 15% of lowest monthly values. Average Hellinger (H) distance between CRU observations and all runs of each model. Low monthly precipitation distributions of simulations and observations are practically identical as H tends to zero, and as the H distance increases (tending to one) difference between the distributions increases.

References

    1. Abatzoglou, J. T. , & Rupp, D. E. (2017). Evaluating climate model simulations of drought for the northwestern United States. International Journal of Climatology, 37, 910–920. 10.1002/joc.5046 - DOI
    1. Abdelmoaty, H. M. , Papalexiou, S. M. , Rajulapati, C. R. , & AghaKouchak, A. (2021). Biases beyond the mean in CMIP6 extreme precipitation: A global investigation. Earth's Future. 10.1029/2021ef002196 - DOI
    1. Adarsh, S. , & Reddy, M. J. (2019). Evaluation of trends and predictability of short‐term droughts in three meteorological subdivisions of India using multivariate EMD‐based hybrid modelling. Hydrological Processes, 33, 130–143. 10.1002/hyp.13316 - DOI
    1. AghaKouchak, A. , Chiang, F. , Huning, L. S. , Love, C. A. , Mallakpour, I. , Mazdiyasni, O. , et al. (2020). Climate extremes and compound hazards in a warming world. Annual Review of Earth and Planetary Sciences, 48, 519–548. 10.1146/annurev-earth-071719-055228 - DOI
    1. Allen, M. R. , & Ingram, W. J. (2002). Constraints on future changes in climate and the hydrologic cycle. Nature, 419, 228–232. 10.1038/nature01092 - DOI - PubMed