. 2021 Aug 11:9:281-298.
doi: 10.1016/j.bioactmat.2021.08.009. eCollection 2022 Mar.

A single-cell transcriptome of mesenchymal stromal cells to fabricate bioactive hydroxyapatite materials for bone regeneration

Affiliations

A single-cell transcriptome of mesenchymal stromal cells to fabricate bioactive hydroxyapatite materials for bone regeneration

Peng Guo et al. Bioact Mater. .

Abstract

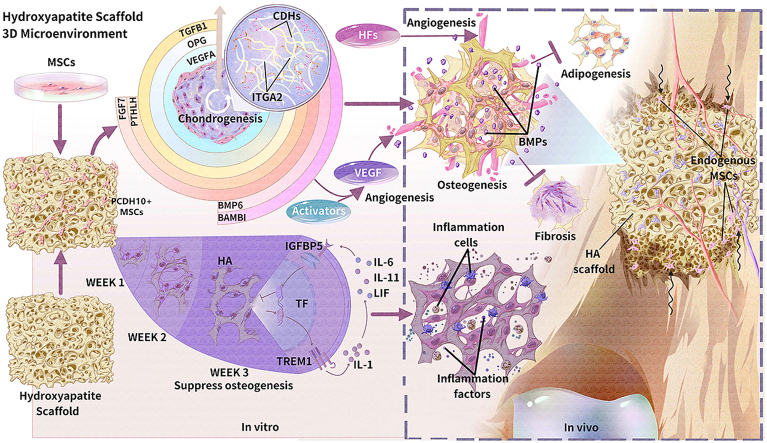
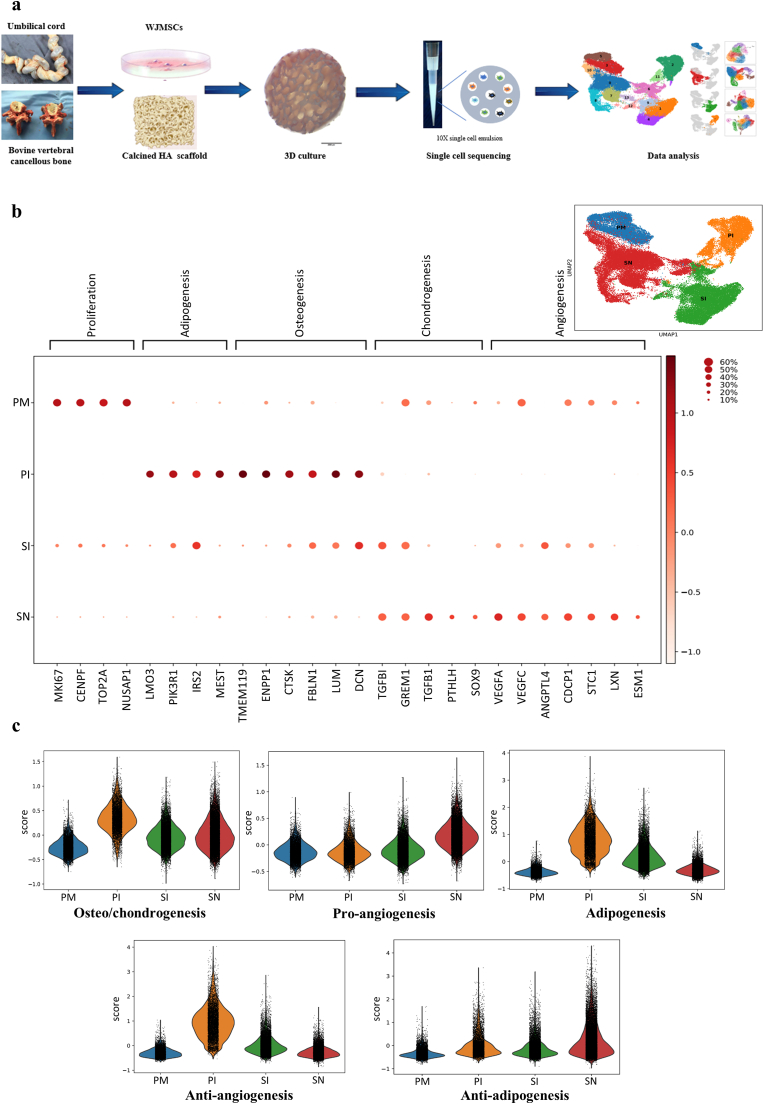
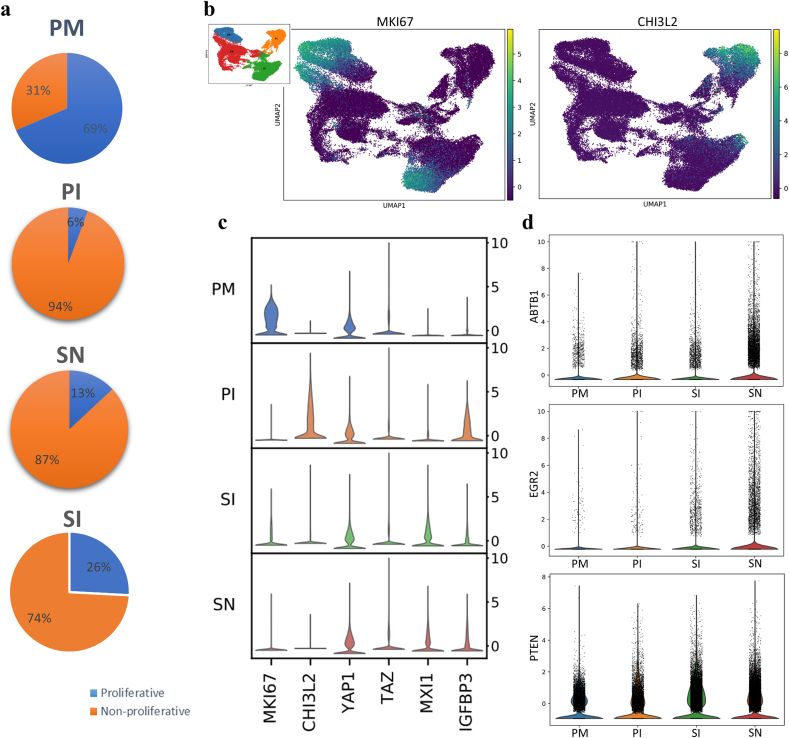
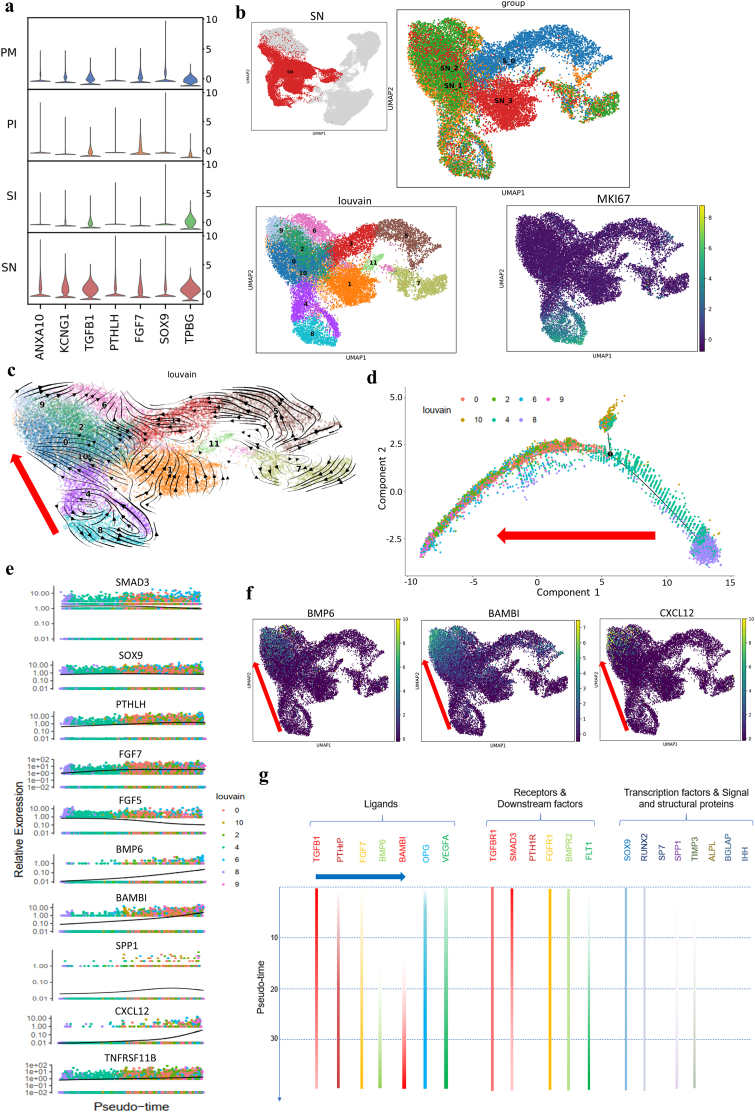
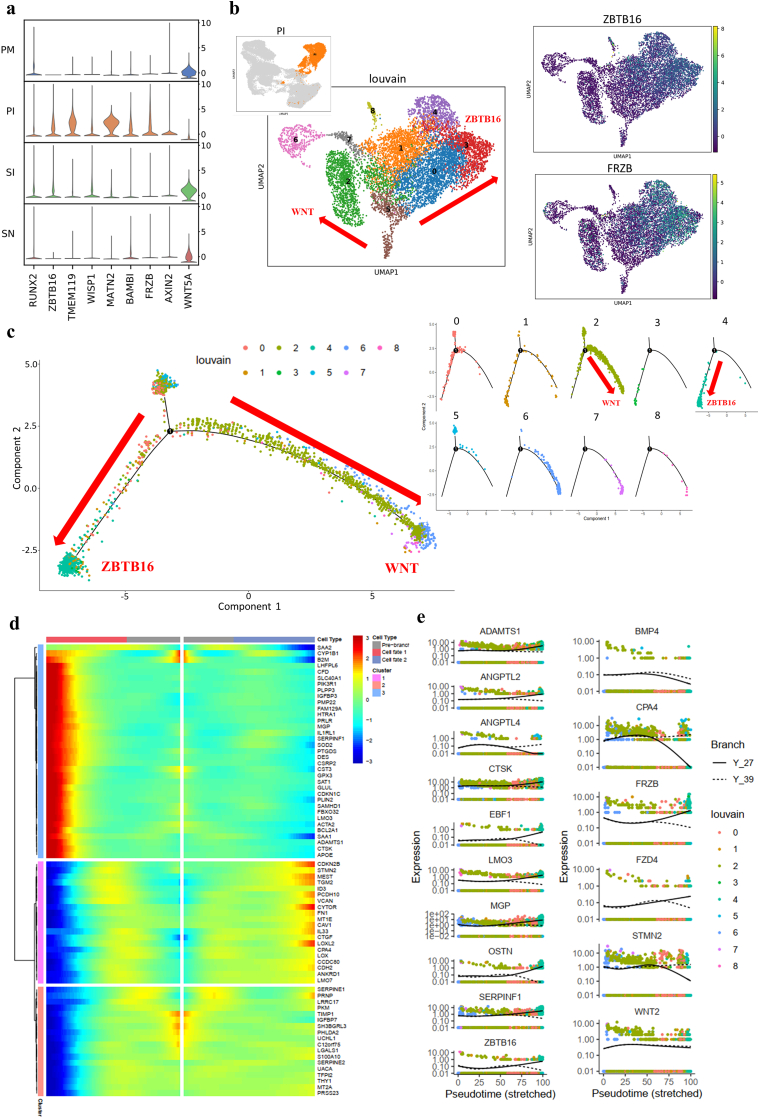
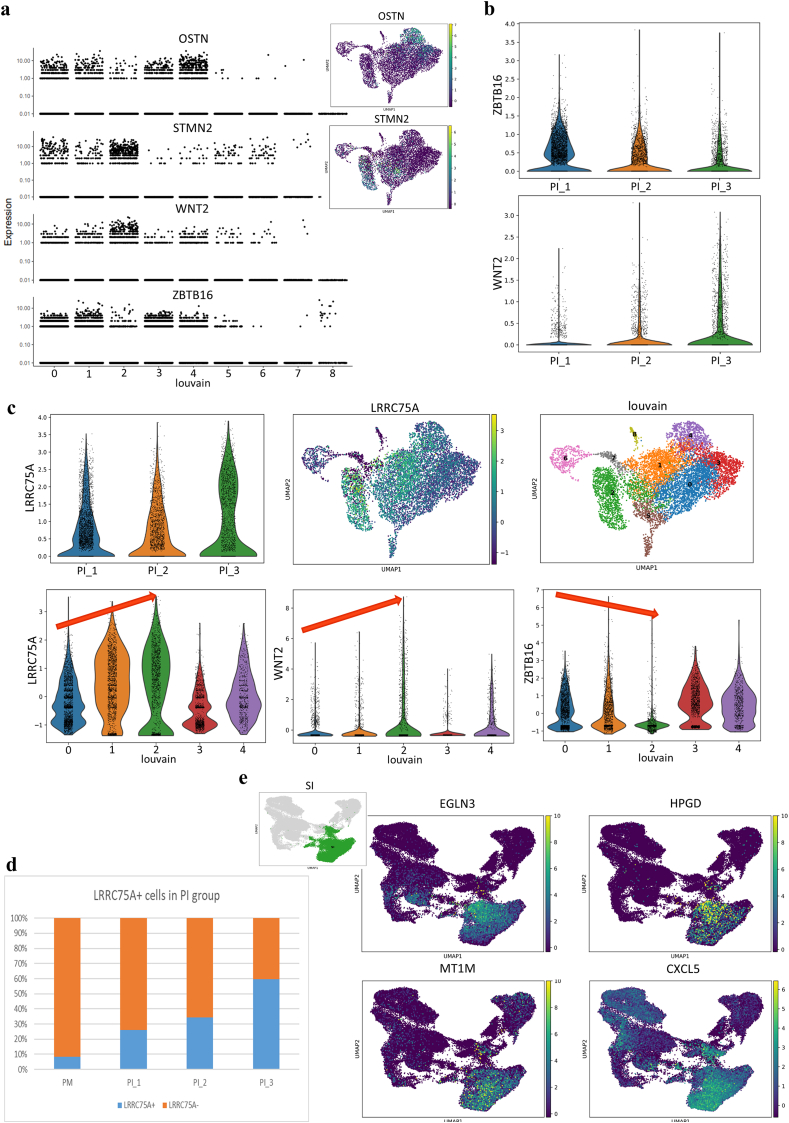
The osteogenic microenvironment of bone-repairing materials plays a key role in accelerating bone regeneration but remains incompletely defined, which significantly limits the application of such bioactive materials. Here, the transcriptional landscapes of different osteogenic microenvironments, including three-dimensional (3D) hydroxyapatite (HA) scaffolds and osteogenic medium (OM), for mesenchymal stromal cells (MSCs) in vitro were mapped at single-cell resolution. Our findings suggested that an osteogenic process reminiscent of endochondral ossification occurred in HA scaffolds through sequential activation of osteogenic-related signaling pathways, along with inflammation and angiogenesis, but inhibition of adipogenesis and fibrosis. Moreover, we revealed the mechanism during OM-mediated osteogenesis involves the ZBTB16 and WNT signaling pathways. Heterogeneity of MSCs was also demonstrated. In vitro ossification of LRRC75A+ MSCs was shown to have better utilization of WNT-related ossification process, and PCDH10+ MSCs with superiority in hydroxyapatite-related osteogenic process. These findings provided further understanding of the cellular activity modulated by OM conditions and HA scaffolds, providing new insights for the improvement of osteogenic biomaterials. This atlas provides a blueprint for research on MSC heterogeneity and the osteogenic microenvironment of HA scaffolds and a database reference for the application of bioactive materials for bone regeneration.

Keywords: Bone regeneration microenvironment; Bone tissue engineering; MSC heterogeneity; PCDH10; Single-cell RNA sequencing.


Figures

Image 1
Graphical abstract
Fig. 1
Fig. 1
Overview of the scRNA sequencing results for MSCs in different microenvironments. a, Schematic of 3D coculture and cell isolation for scRNA sequencing based on 10X Genomics. b, UMAP visualization of MSCs from 10X Genomics sequencing using 3′ chemistry showing the distinct distributions of clusters of cells in different microenvironments (right top. the colors indicate the different microenvironments; PM, primary noninduced MSCs cultured in plates; PI, plate-cultured MSCs with OM induction; SN, 3D-cultured MSCs on HA scaffolds without OM induction; SI, 3D-cultured MSCs on HA scaffolds with OM induction) and normalized expression of representative signature genes for typical functions (the gene expression frequency is indicated by the spot size, and the expression level is indicated by the color intensity). c, Lineage differentiation potential evaluation on the basis of related genes among the DEGs (Supplementary Table 2) showing the distinct functions of the different groups.
Fig. 2
Fig. 2
Cell proliferation regulation of MSCs in different microenvironments. a, Proportions of proliferative cells in different groups calculated in independent analysis of scRNA sequencing data. b, Expression of MKI67 and CHI3L2 represented by UMAP visualization (CHI3L2 was upregulated specifically in non-proliferative cells in the SI group). c, Violin visualization showing the expression of the indicated proliferation-regulating genes involved in the Hippo (YAP/TAZ) and MIX1/IGFBP3 signaling pathways. d, Simultaneous upregulation of ABTB1-EGR2/PTEN expression in the SN group.
Fig. 3
Fig. 3
Osteogenic process of MSCs cultured on HA scaffolds. a, Stacked violin visualization of the indicated genes highly expressed during HA scaffold-mediated osteogenesis. b, UMAP visualization of subclusters at different time points and MKI67 expression in the SN group. Clusters 8 and 4 represent proliferative cells in a relatively primitive state (S_0, SN at week 0; SN_1, SN at week 1; SN_2, SN at week 2; SN_3, SN at week 3). c, Velocity visualization of subclusters showing the cell development trajectory in the SN group and the direction of osteogenic development (red arrow, clusters 8, 4, 10, 0, 2, 9, 6). d, Monocle pseudotime trajectory showing the progression of osteogenic-lineage clusters (clusters 0, 2, 4, 6, 8, 9, and 10 according to velocity analysis and monocle pseudotime analysis; in Supplementary Fig. 3a, the red arrow shows the cell evolution direction). e, Pseudotime kinetics of the indicated genes during the development of osteogenic-lineage clusters. SOX9 and TNFRSF11B (OPG) showed steady expression levels; FGF5 and SMAD3 showed descending expression tendencies; FGF7 and PTHLH showed increasing expression levels and reached plateaus at the early stage; BMP6, BAMBI, SPP1 and CXCL12 showed elevated expression at the late stage. f, Expression distribution in UMAP visualization of the indicated genes (the red arrow shows the osteogenic direction). g, Summary of key signaling molecules involved in osteogenesis in the SN group showing the chronological activation of osteogenic signaling pathways (blue arrow). The expression level is indicated by the color intensity. The expression levels of genes not included in the pseudotime kinetics are supplied in Supplementary Fig. 3b because of low expression differences, and expression-deficiency strips show a lack of expression of PTH1R, SP7, ALPL, BGLAP and IHH.
Fig. 4
Fig. 4
Functional genetic phenotypes of MSCs in different osteogenic microenvironments. a, Stacked violin visualization of the indicated genes involved in extracellular matrix formation and matrix remodeling. b, Stacked violin visualization showing the key antiangiogenic factors (highly expressed in the PI group, including ANGPTL1, EFEMP1, EPAS1 and SERPINF1), proangiogenic factors (highly expressed in the SN group, including VEGFA, VEGFC, FLT1, CDCP1, ESM1, STC1, PFKFB3, TGFB1, FGF7, PTGS2 and LXN) and adipogenic factors (highly expressed in the PI group, including PPARG, EBF1, LMO3, MEST, PIK3R1, ACSL1, IRS2, ALOX5AP, FABP3 and CPA4) related to OM and the HA scaffold. c, Violin presentation of the expression of key molecules in the STRA6/RBP1 signaling pathway. d, Violin visualization of antifibrogenic regulators.
Fig. 5
Fig. 5
Hypoxic response of MSCs on HA scaffolds. a, Stacked violin visualization of the indicated genes involved in the hypoxic response. Violin visualization of key hypoxic (b) and angiogenic (c) genes showing distinct upregulation at week 3 (FLT1, an angiogenic inhibitor, was downregulated). d, Expression tendencies of the indicated signaling molecules at different time points visualized with a gene jitter plot in Monocle showing significant downregulation of osteogenic signaling molecules with upregulation of VEGFA expression at week 3. e, Pseudotime kinetics of the indicated genes during the development of all clusters in the SN group.
Fig. 6
Fig. 6
Inflammatory regulation of MSCs on HA scaffolds. a, Stacked violin visualization of the indicated genes involved in the inflammatory reaction. b, UMAP presentation of key proinflammatory factor and immunosuppressor involved in HA-mediated inflammation. c, Violin presentation of key proinflammatory factor and immunosuppressor over time (CD200 was downregulated significantly in the SN group at week 3).
Fig. 7
Fig. 7
Heterogeneity of MSCs and PCDH10+ MSCs in HA microenvironments. a, UMAP visualization showing the functional clusters of MSCs (identified in Supplementary Figs. 4 and 5). b, Velocity visualization of MSCs showing the different cell development trajectories in the PM group (blue, proliferative MSCs 1; yellow, progenitor MSCs; green, proliferative MSCs 2; red, LRRC75A + MSCs; purple, immunoregulatory MSCs). c, Dot plot presenting the normalized expression of representative signature genes of different clusters and pre-progenitor cells identified as PCDH10+/LRRC75A- MSCs (the gene expression frequency is indicated by the spot size, and the expression level is indicated by the color intensity). GO analysis showing the different osteogenic fates in clusters 6 (d) and 9 (e) in the SN group (the red arrow shows the main osteogenic function). f, PCDH10+ cells in the SN group showing upregulated expression of key HA-related osteogenic molecules.
Fig. 8
Fig. 8
Osteogenic process of MSCs during OM induction. a, Stacked violin visualization of key genes involved in OM-mediated osteogenesis. b, Distribution of target gene expression in the cells in the PI group at different time points and distinct cell fates matched in UMAP and cell trajectory visualization (the red arrow shows the trajectory direction; the direction with high expression of ZBTB16 is marked as ZBTB16, and the direction with low expression of the WNT inhibitor FRZB is marked as WNT). c, Cell development trajectory of MSCs induced for 3 weeks in the PI group (PI_3) as determined by Monocle analysis (the red arrow shows the direction of trajectory). d, Gene expression heatmap of the cells in the PI_3 group in a branch-dependent manner showing distinct genetic phenotypes of the ZBTB16 and WNT branches. e, Pseudotime kinetics of the indicated genes from the root of fate 1 (ZBTB16, solid line) and fate 2 (WNT, dashed line).
Fig. 9
Fig. 9
The ZBTB16/WNT2 transition, LRRC75A + MSC function during OM induction, and enhanced hypoxic and inflammatory reactions induced by HA scaffolds combined with OM. a, Marker genes of different cell fates presenting in UMAP and gene jitter plots according to Monocle analysis.b, Expression tendencies of the indicated genes during distinct osteogenic processes (PI_1, PI at week 1; PI_2, PI at week 2; PI_3, PI at week 3).c, Violin and UMAP visualization showing that LRRC75A was highly expressed in limited clusters (clusters 1 and 2) in the PI group (the red arrow shows that the expression tendencies of LRRC75A and WNT2 were the same and were totally opposite those of ZBTB16).d, Proportions of LRRC75A + MSCs in the PI group at different time points showing a steadily ascending tendency.e, UMAP visualization of the indicated hypoxia and inflammation genes specifically highly expressed in the SI group.

References

    1. Agarwal R., Garcia A.J. Biomaterial strategies for engineering implants for enhanced osseointegration and bone repair. Adv. Drug Deliv. Rev. 2015;94:53–62. doi: 10.1016/j.addr.2015.03.013. - DOI - PMC - PubMed
    1. Ho-Shui-Ling A., Bolander J., Rustom L.E., et al. Bone regeneration strategies: engineered scaffolds, bioactive molecules and stem cells current stage and future perspectives. Biomaterials. 2018;180:143–162. doi: 10.1016/j.biomaterials.2018.07.017. - DOI - PMC - PubMed
    1. Kim H.D., Amirthalingam S., Kim S.L., et al. Biomimetic materials and fabrication approaches for bone tissue engineering. Adv Healthc Mater. 2017;6(23) doi: 10.1002/adhm.201700612. - DOI - PubMed
    1. Li M., Xiong P., Yan F., et al. An overview of graphene-based hydroxyapatite composites for orthopedic applications. Bioact Mater. 2018;3(1):1–18. doi: 10.1016/j.bioactmat.2018.01.001. - DOI - PMC - PubMed
    1. Oliveira H.L., Da Rosa W.L.O., Cuevas-Suarez C.E., et al. Histological evaluation of bone repair with hydroxyapatite: a systematic review. Calcif. Tissue Int. 2017;101(4):341–354. doi: 10.1007/s00223-017-0294-z. - DOI - PubMed

LinkOut - more resources