

Global consumption of prescription opioid analgesics between 2009-2019: a country-level observational study
- PMID: 34820610
- PMCID: PMC8599097
- DOI: 10.1016/j.eclinm.2021.101198
Global consumption of prescription opioid analgesics between 2009-2019: a country-level observational study
Abstract
Background: Opioid analgesics play a key role in pain management but providing access while mitigating risk of misuse and dependence remains a challenge. Tracking global consumption of all opioids over time can help identify emerging patterns and drivers of use.
Methods: Prescription opioid analgesic consumption was estimated for 76 countries between 2009 and 2019 using IQVIA MIDAS data. We reported country-level consumption trends in morphine milligram equivalents (MMEs), assessed differences in consumption between high-income (HICs), upper-middle income (UMICs), and low- and lower-middle income countries (LMICs), and identified country-level socioeconomic drivers of consumption using fixed-effects panel regression models.
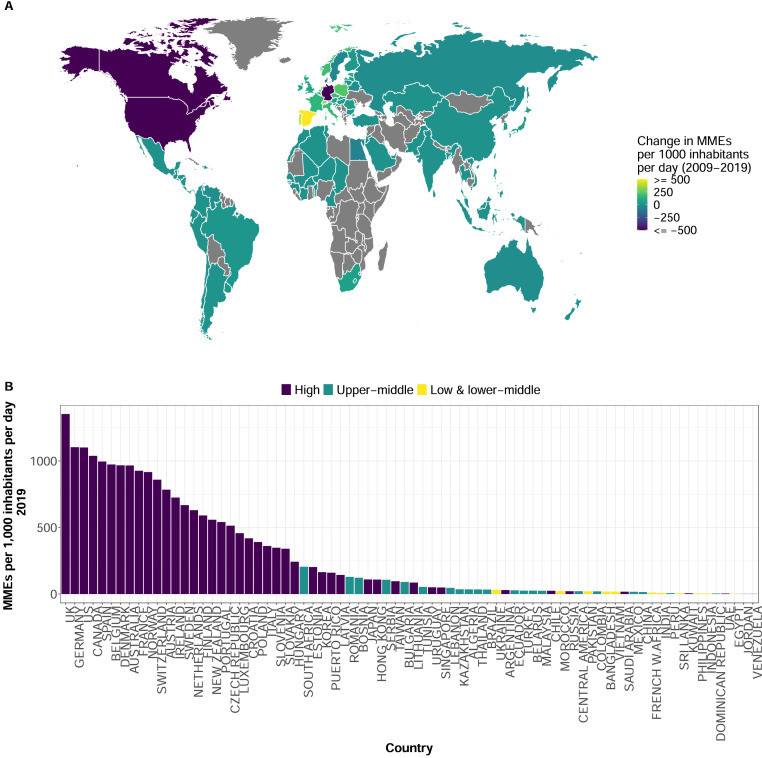
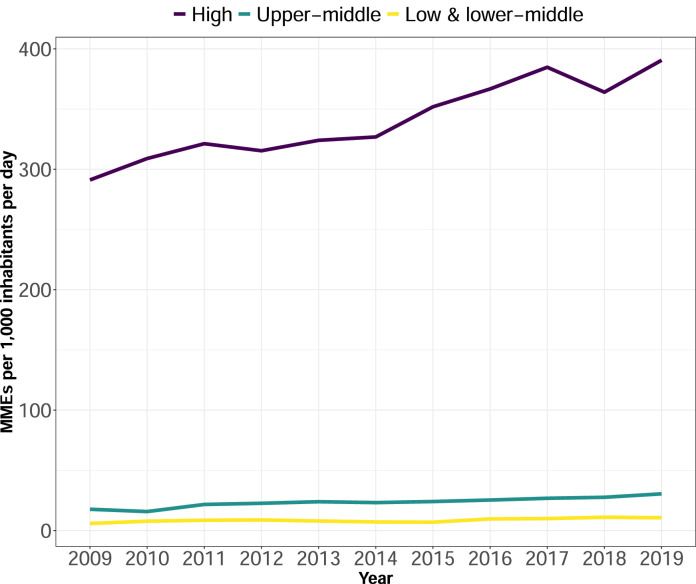
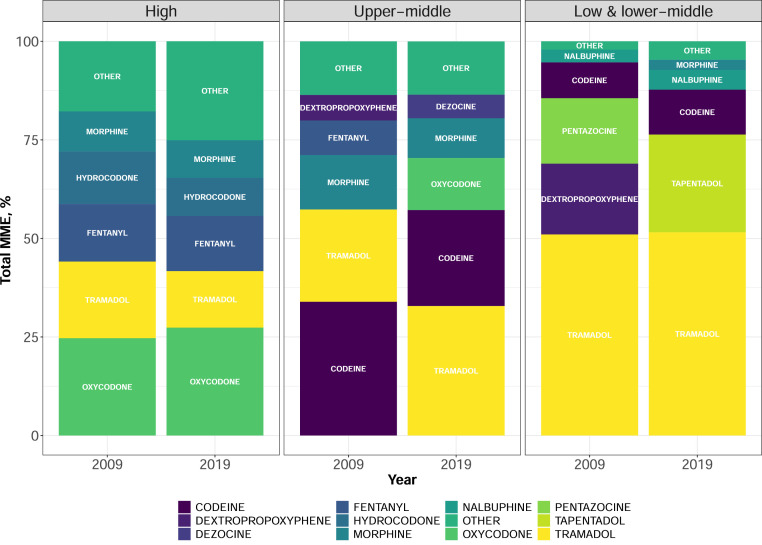
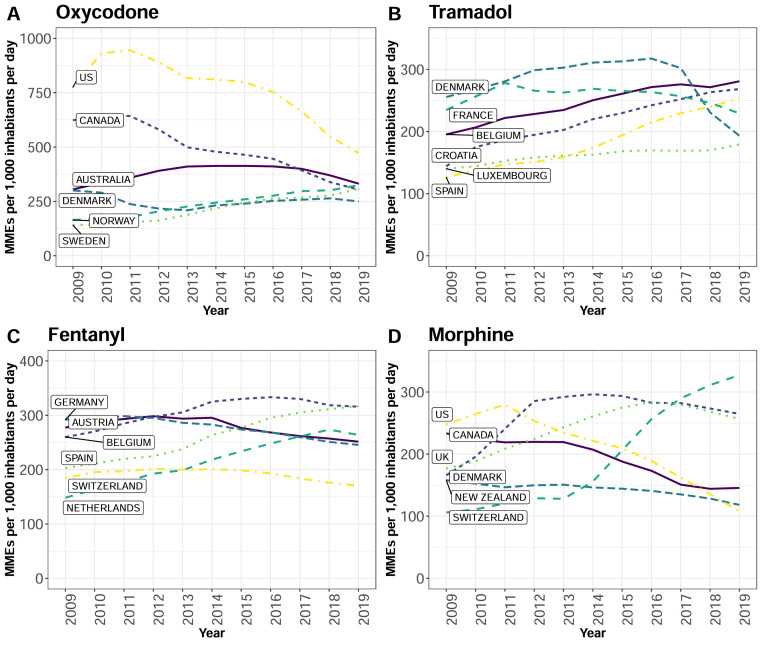
Findings: Global opioid consumption rate declined from 216·3 to 151·5 morphine milligram equivalents per 1,000 inhabitants per day (MID) between 2009 and 2019, with consumption declines in the US and Germany. Overall, consumption rates increased in HICs by a median 36·6 MID (IQR, -7·5 -124·5) with substantial heterogeneity between countries. Median consumption rates were lower in UMICs (23·6 MID) and LMICs (8·3 MID) compared to HICs (345·1 MID) and increased by median 10·4 and 3·7 MID from 2009-2019, respectively. Consumption rates were associated with income (coefficient 18·84, 95% confidence interval 3·8-33·9) and trade (13·59, 1·3-25·8) in UMICs, and physician density (1·95, 1·2-2·7) in LMICs. Tramadol consumption rate increased in the study period and accounted for a relatively large proportion of total opioid volume consumed across all country-income groups.
Interpretation: Substantial heterogeneity in global opioid consumption patterns reflect the challenges involved with providing adequate access to opioid treatment while avoiding potential misuse.
© 2021 The Authors.
Conflict of interest statement
AC and MA are employed by IQVIA. All other authors declare no competing interests.
Figures
Similar articles
-
Global disparities in mortality and liver transplantation in hospitalised patients with cirrhosis: a prospective cohort study for the CLEARED Consortium.Lancet Gastroenterol Hepatol. 2023 Jul;8(7):611-622. doi: 10.1016/S2468-1253(23)00098-5. Epub 2023 May 22. Lancet Gastroenterol Hepatol. 2023. PMID: 37230109 Free PMC article.
-
Global, regional, and national trends in opioid analgesic consumption from 2015 to 2019: a longitudinal study.Lancet Public Health. 2022 Apr;7(4):e335-e346. doi: 10.1016/S2468-2667(22)00013-5. Lancet Public Health. 2022. PMID: 35366408
-
Global consumption patterns of combination hypertension medication: An analysis of pharmaceutical sales data from 2010-2021.PLOS Glob Public Health. 2024 Sep 6;4(9):e0003698. doi: 10.1371/journal.pgph.0003698. eCollection 2024. PLOS Glob Public Health. 2024. PMID: 39240993 Free PMC article.
-
Polysubstance use and misuse or abuse of prescription opioid analgesics: a multi-level analysis of international data.Pain. 2017 Jun;158(6):1138-1144. doi: 10.1097/j.pain.0000000000000892. Pain. 2017. PMID: 28267061 Review.
-
Opioid prescription patterns in Germany and the global opioid epidemic: Systematic review of available evidence.PLoS One. 2019 Aug 28;14(8):e0221153. doi: 10.1371/journal.pone.0221153. eCollection 2019. PLoS One. 2019. PMID: 31461466 Free PMC article.
Cited by
-
State-level variation in distribution of oxycodone and opioid-related deaths from 2000 to 2021: an ecological study of ARCOS and CDC WONDER data in the USA.BMJ Open. 2024 Mar 7;14(3):e073765. doi: 10.1136/bmjopen-2023-073765. BMJ Open. 2024. PMID: 38453203 Free PMC article.
-
Evaluation of the strategies opioid manufacturers used to recruit health professionals and encourage overprescribing: an analysis of industry documents.BMC Public Health. 2024 Aug 8;24(1):2153. doi: 10.1186/s12889-024-19642-z. BMC Public Health. 2024. PMID: 39118033 Free PMC article.
-
Availability and Use of Essential Opioid Analgesics in Sub-Saharan Africa: A Scoping Review Protocol.Int J Surg Protoc. 2023 Feb 1;27(1):1-8. doi: 10.29337/ijsp.184. eCollection 2023. Int J Surg Protoc. 2023. PMID: 36789102 Free PMC article.
-
Global trends in opioid use for pain management in acute pancreatitis: A multicentre prospective observational study.United European Gastroenterol J. 2024 Oct;12(8):1114-1127. doi: 10.1002/ueg2.12641. Epub 2024 Aug 14. United European Gastroenterol J. 2024. PMID: 39140779 Free PMC article.
-
Influences of Software Changes on Oxycodone Prescribing at an Australian Tertiary Emergency Department: A Retrospective Review.Pharmacy (Basel). 2024 Mar 1;12(2):44. doi: 10.3390/pharmacy12020044. Pharmacy (Basel). 2024. PMID: 38525724 Free PMC article.
References
-
- Knaul FM, Farmer PE, Krakauer EL, et al. Alleviating the access abyss in palliative care and pain relief—an imperative of universal health coverage: the Lancet Commission report. The Lancet. 2018;391:1391–1454. - PubMed
LinkOut - more resources
Full Text Sources
