Observational Study
. 2022 Feb;13(1):713-727.
doi: 10.1002/jcsm.12867. Epub 2021 Nov 24.

Sepsis induces interleukin 6, gp130/JAK2/STAT3, and muscle wasting

Affiliations
Observational Study

Sepsis induces interleukin 6, gp130/JAK2/STAT3, and muscle wasting

Lukas Zanders et al. J Cachexia Sarcopenia Muscle. 2022 Feb.

Abstract

Background: Sepsis and inflammation can cause intensive care unit-acquired weakness (ICUAW). Increased interleukin-6 (IL-6) plasma levels are a risk factor for ICUAW. IL-6 signalling involves the glycoprotein 130 (gp130) receptor and the JAK/STAT-pathway, but its role in sepsis-induced muscle wasting is uncertain. In a clinical observational study, we found that the IL-6 target gene, SOCS3, was increased in skeletal muscle of ICUAW patients indicative for JAK/STAT-pathway activation. We tested the hypothesis that the IL-6/gp130-pathway mediates ICUAW muscle atrophy.

Methods: We sequenced RNA (RNAseq) from tibialis anterior (TA) muscle of cecal ligation and puncture-operated (CLP) and sham-operated wildtype (WT) mice. The effects of the IL-6/gp130/JAK2/STAT3-pathway were investigated by analysing the atrophy phenotype, gene expression, and protein contents of C2C12 myotubes. Mice lacking Il6st, encoding gp130, in myocytes (cKO) and WT controls, as well as mice treated with the JAK2 inhibitor AG490 or vehicle were exposed to CLP or sham surgery for 24 or 96 h.

Results: Analyses of differentially expressed genes in RNAseq (≥2-log2-fold change, P < 0.01) revealed an activation of IL-6-signalling and JAK/STAT-signalling pathways in muscle of septic mice, which occurred after 24 h and lasted at least for 96 h during sepsis. IL-6 treatment of C2C12 myotubes induced STAT3 phosphorylation (three-fold, P < 0.01) and Socs3 mRNA expression (3.1-fold, P < 0.01) and caused myotube atrophy. Knockdown of Il6st diminished IL-6-induced STAT3 phosphorylation (-30.0%; P < 0.01), Socs3 mRNA expression, and myotube atrophy. JAK2 (- 29.0%; P < 0.01) or STAT3 inhibition (-38.7%; P < 0.05) decreased IL-6-induced Socs3 mRNA expression. Treatment with either inhibitor attenuated myotube atrophy in response to IL-6. CLP-operated septic mice showed an increased STAT3 phosphorylation and Socs3 mRNA expression in TA muscle, which was reduced in septic Il6st-cKO mice by 67.8% (P < 0.05) and 85.6% (P < 0.001), respectively. CLP caused a loss of TA muscle weight, which was attenuated in Il6st-cKO mice (WT: -22.3%, P < 0.001, cKO: -13.5%, P < 0.001; WT vs. cKO P < 0.001). While loss of Il6st resulted in a reduction of MuRF1 protein contents, Atrogin-1 remained unchanged between septic WT and cKO mice. mRNA expression of Trim63/MuRF1 and Fbxo32/Atrogin-1 were unaltered between CLP-treated WT and cKO mice. AG490 treatment reduced STAT3 phosphorylation (-22.2%, P < 0.05) and attenuated TA muscle atrophy in septic mice (29.6% relative reduction of muscle weight loss, P < 0.05). The reduction in muscle atrophy was accompanied by a reduction in Fbxo32/Atrogin-1-mRNA (-81.3%, P < 0.05) and Trim63/MuRF1-mRNA expression (-77.6%, P < 0.05) and protein content.

Conclusions: IL-6 via the gp130/JAK2/STAT3-pathway mediates sepsis-induced muscle atrophy possibly contributing to ICUAW.

Keywords: IL-6 signalling; Inflammation; Intensive care unit acquired weakness; Muscle atrophy; Sepsis; gp130.


Conflict of interest statement

Lukas Zanders, Melanie Kny, Alexander Hahn, Sibylle Schmidt, Sebastian Wundersitz, Mihail Todiras, Ines Lahmann, Arnab Bandyopadhyay, Tobias Wollersheim, Lars Kaderali, Friedrich C. Luft, Carmen Birchmeier, Steffen Weber‐Carstens, and Jens Fielitz declare that they have no conflict of interest.

Figures
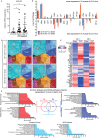
Figure 1
Figure 1
The IL‐6 pathway is activated in skeletal muscle during sepsis. (A) SOCS3 mRNA expression in muscle of critically ill patients. Muscle biopsy specimens from critically ill patients were obtained from the vastus lateralis muscle on Day 5 (n = 25) and Day 15 (n = 19) in intensive care unit (ICU). Healthy individuals (n = 5) served as controls. Data are presented as fold change (mean ± SEM). *P < 0.05. (B–E) WT mice were subjected to cecal ligation and puncture (CLP) or sham surgery. RNA sequencing analyses were performed 24 and 96 h after surgery (WT sham, n = 3; WT CLP, n = 3, for both time points). (B) Gene expression of known IL6‐family members and their receptors in TA muscle of sham‐ and CLP‐operated mice after 24 and 96 h. (C) Voronoi plot of differentially expressed genes (log2 fold change≥2, adjusted P value <0.05) from RNA sequencing analysis is shown. Voronoi‐plots show the respective GO terms (left panels) and the enriched genes (right panel) per time point (top panels 24 h, bottom panels 96 h) as indicated. Insets localize IL‐6‐ and JAK/STAT pathway. (D) Venn diagram showing the number of genes that were increased (log2 fold change≥2, adjusted P value <0.01) in the tibialis anterior muscle compared with sham treated mice after 24 h, 96 h or at both time points. The DAVID functional annotation tool was used for gene ontology (GO) term‐pathway and Kyoto Encyclopedia of Genes and Genomes (KEGG)‐pathway analyses of each individual time point, and 10 of the most enriched biological processes and pathways are shown. (E) Heat map of genes contained in GO‐term 0071354 cellular response to IL‐6 that were significantly regulated (P value <0.05) in TA muscle of septic mice 24 and 96 h after surgery when compared to TA of sham operated mice.
Figure 2
Figure 2
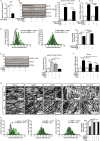
Interleukin 6 activates the JAK/STAT signalling pathway and induces atrophy in myocytes. Five days differentiated C2C12 myotubes were treated with interleukin 6 (IL‐6, 10 ng/mL, n = 3) or solvent control (0.1% bovine serum albumin in phosphate‐buffered saline, n = 3) for the indicated time points. (A) Western blot analysis with anti‐phospho‐STAT3‐Tyr705 (pSTAT3 Y705), anti‐STAT3 and anti‐GAPDH antibodies, n = 3. GAPDH was used as loading control. Bar graph showing the ratio of the relative densities of pSTAT3 Y705 and STAT3 protein contents as detected C. (B) Quantitative real‐time polymerase chain reaction (qRT‐PCR) analysis of Socs3 expression. mRNA expression was normalized to Gapdh. Data are presented as mean ± SD. *P < 0.05, **P < 0.01, ***P < 0.001. MW, molecular weight; min, minutes; IL‐6, interleukin 6. (C) Representative light microscopy pictures. Scale bar = 100 μm. (D) Frequency distribution histograms of cell width of IL‐6 and solvent treated myotubes, n = 100 cells per condition. Mean myotube width.
Figure 3
Figure 3
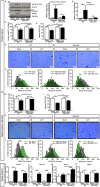
Interleukin 6 mediates atrophy through gp130/JAK2/STAT3 signalling in myocytes. (A–D) Five days differentiated C2C12 myotubes were transfected with control siRNA (control siRNA, 50 nM) (n = 6) or siRNA targeting Il6st/gp130 (Il6st siRNA, 50 nM) (n = 6) followed by treatment with IL‐6 (10 ng/mL) or vehicle control, as indicated, for 24 h. (A) Quantitative real‐time polymerase chain reaction (qRT‐PCR) analysis of Il6st expression. mRNA expression was normalized to Gapdh. (B) Western blot analysis with anti‐gp130, anti‐phospho‐STAT3‐Tyr705 (pSTAT3 Y705), anti‐STAT3, and anti‐GAPDH antibodies, n = 3. GAPDH was used as loading control. Bar graph showing the ratio of the relative densities of pSTAT3 Y705 and STAT3 protein contents as detected in (B). (C) qRT‐PCR analysis of Socs3 expression. mRNA expression was normalized to Gapdh. (D) Frequency distribution histograms of cell width of IL‐6 and vehicle‐treated myotubes, n = 100 cells per condition. Bar graph showing mean myotube width. (E–H) Five days differentiated C2C12 myotubes were treated with the JAK2 inhibitor AG490 (n = 6), the STAT3 inhibitor C188‐9 (n = 6) or vehicle control prior to treatment with IL‐6 (10 ng/mL) or solvent control, as indicated, for 24 h. (E), Western blot analysis with anti‐phospho‐STAT3‐Tyr705 (pSTAT3 Y705), anti‐STAT3, and anti‐GAPDH antibodies, n = 3. GAPDH was used as loading control. Bar graph showing the ratio of the relative densities of pSTAT3 Y705 and STAT3 protein contents as detected (E). Data are shown as mean ± SD. (F) qRT‐PCR analysis of Socs3 expression. mRNA expression was normalized to Gapdh. (G) Representative light microscopy pictures. Scale bar = 100 μm. Data are presented as mean ± SD. *P < 0.05, **P < 0.01, ***P < 0.001. MW, molecular weight, IL‐6, interleukin 6. (H) Frequency distribution histograms of cell width of IL‐6 and vehicle‐treated myotubes in the absence or presence of JAK2 and STAT3 inhibitors, and Il6st siRNA or scrambled siRNA control, as indicated, n = 100 cells per condition. Bar graph showing mean myotube width.
Figure 4
Figure 4
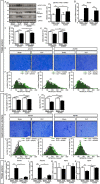
Deletion of Il6st in skeletal myocytes attenuates sepsis‐induced muscle atrophy in mice. Twelve‐ to 16‐week‐old male Il6st cKO mice and wildtype (WT) littermates were subjected to cecal ligation and puncture (CLP) or sham surgery. Analyses were performed 24 h (for Western blot: WT sham, n = 4; WT CLP, n = 6; KO sham, n = 4; KO CLP, n = 4) or 96 h (for qRT PCR and morphological analyses: WT sham, n = 6; WT CLP, n = 15; KO sham, n = 6; KO CLP, n = 10) after surgery in tibialis anterior (TA) and gastrocnemius and plantaris (GP). (A) Western blot analysis with anti‐phospho‐STAT3‐Tyr705 (pSTAT3 Y705), anti‐STAT3, anti‐Atrogin‐1, anti‐MuRF1, and anti‐GAPDH antibodies, n = 3. GAPDH was used as loading control. Bar graph showing the ratio of the relative densities of pSTAT3 Y705 and STAT3 protein contents as detected in (A) as mean ± SD. Arrow denotes nonspecific (n.s.) signal. (B) Quantitative real‐time polymerase chain reaction (qRT‐PCR) analysis of Socs3. mRNA expression was normalized to Gapdh. Data are presented as mean ± SEM; **P < 0.01, ***P < 0.001. (C, G) Analyses of TA and GP muscle weights normalized to tibia length of the same animal. (D, H) Metachromatic ATPase staining of histological cross‐sections from TA and GP of sham or CLP operated WT and Il6st cKO mice. (E, I) Mean myofibre cross‐sectional area (MCSA) of TA and GP muscle. (F, J) Frequency distribution histograms of fast/type II MCSA of sham‐treated and CLP‐treated Il6st cKO and WT mice of TA and GP muscle. Data are presented as mean ± SEM; *P < 0.05, **P < 0.01, ***P < 0.001. (K–N) qRT‐PCR analysis of Trim63, Fbxo32, Myh2, and Myh4. mRNA expression was normalized to Gapdh. Data are presented as mean ± SEM; *P < 0.05, **P < 0.01, ***P < 0.001.
Figure 5
Figure 5
The JAK2 inhibitor AG490 attenuates sepsis‐induced muscle atrophy in mice. Twelve‐ to 16‐week‐old male Il6st cKO and wildtype (WT) mice were treated with the JAK2 inhibitor AG490 (n = 20, 10 μM) or vehicle (n = 20) and then subjected to cecal ligation and puncture (CLP) or sham surgery (solvent sham, n = 5; solvent CLP, n = 15; AG490 sham, n = 5; AG490 CLP, n = 15). Analyses were performed 96 h after surgery in tibialis anterior (TA) and gastrocnemius and plantaris (GP) of sham‐treated and CLP‐treated AG490 and vehicle‐treated animals. (A) Western blot analysis with anti‐phospho‐STAT3‐Tyr705 (pSTAT3 Y705), anti‐STAT3, anti‐Atrogin‐1, anti‐MuRF1, and anti‐GAPDH antibodies, n = 3. GAPDH was used as loading control. Bar graph showing the ratio of the relative densities of pSTAT3 Y705 and STAT3 protein contents as detected in (A) as mean ± SD. Arrow denotes nonspecific (n.s.) signal. (B) Quantitative real‐time polymerase chain reaction (qRT‐PCR) analysis of Socs3. mRNA expression was normalized to Gapdh. Data are presented as mean ± SEM; ***P < 0.001. (C, G) Analyses of TA and GP muscle weights normalized to tibia length of the same animal. (D, H) Metachromatic ATPase staining of histological cross‐sections from TA and GP of sham and CLP operated AG490‐ and solvent‐treated mice. (E, I) Mean myofibre cross‐sectional area (MCSA) of TA and GP muscle. (F, J) Frequency distribution histograms of fast/type II MCSA of sham‐operated and CLP‐operated AG490‐treated and solvent‐treated mice. Data are presented as mean ± SEM; *P < 0.05, **P < 0.01, ***P < 0.001. (KN) Quantitative real‐time polymerase chain reaction (qRT‐PCR) analysis of Trim63, Fbxo32, Myh2, and Myh4. mRNA expression was normalized to Gapdh. Data are presented as mean ± SEM; *P < 0.05, **P < 0.01, ***P < 0.001.
Figure 6
Figure 6
IL‐6 inhibits insulin signalling in myocytes in vitro. (A) Twelve‐ to 16‐week‐old male Il6st cKO and wildtype (WT) mice were subjected to cecal ligation and puncture (CLP) or sham surgery (WT sham, n = 4; WT CLP, n = 6; KO sham, n = 4; KO CLP, n = 4). Analyses were performed 24 h after surgery. Western blot analysis with anti‐Akt, anti‐pAkt S473, and anti‐GAPDH antibodies, n = 3. GAPDH was used as loading control. Bar graph showing the ratio of the relative densities of pAkt S473 and Akt protein contents as detected in (A) as mean ± SD. (B) Five days differentiated C2C12 myotubes were treated with IL‐6 (10 ng/mL) or vehicle for 30 min (n = 6) before insulin‐treatment for 1 h (n = 3). Western blot analysis with anti‐Akt, anti‐pAkt S473, anti‐STAT3, anti‐pSTAT3 Y705, anti‐pIRS1 S636/639, anti‐IRS1, and anti‐GAPDH antibodies, n = 3. GAPDH was used as loading control. Bar graph showing the ratio of the relative densities of pAkt S473 and Akt as well as pSTAT3 Y705 and STAT3 protein contents mean ± SD; *P < 0.05, **P < 0.01, ***P < 0.001.
Figure 7
Figure 7
The IL‐6/gp130/JAK2/STAT3‐pathway mediates sepsis‐induced muscle atrophy. IL‐6 plasma levels are increased in critically ill human patients and mice with polymicrobial sepsis. IL‐6 acts on myocytes via the gp130 and IL‐6Rα‐complex and activates JAK2‐ and STAT3‐signalling, which leads to an increased expression of SOCS3. SOCS3 functions as a negative regulator of cytokine signalling and inhibits the growth promoting insulin/insulin‐receptor/Akt pathway by degradation of IRS‐1. Reduction of IRS‐1 is paralleled by a decreased Akt‐activity that results in a reduced protein synthesis and an increased protein degradation, which eventually mediate muscle atrophy. Inhibition of IL‐6/gp130 signalling by IL6st‐knockdown (e.g. Il6st siRNA and Il6st cKO), JAK2 (e.g. AG490), or STAT3 inhibition (e.g. C188‐9 and S3i‐201) prevents IL‐6‐induced SOCS3 expression as well as myocyte atrophy in vitro and skeletal muscle atrophy in vivo. Red arrows indicate changes related to increased IL‐6 plasma levels. Fbxo32 indicates F‐box protein 32; Gp130, glycoprotein 130; IRS‐1, insulin receptor substrate‐1; IL‐6, interleukin 6; IL‐6Rα, interleukin 6 receptor alpha; JAK2, Janus kinase‐2; MuRF1, muscle‐specific RING finger protein 1; PDK1, 3‐phosphoinositide‐dependent protein kinase 1; PI3K, phosphatidylinositol 3‐kinase; SOCS3, suppressor of cytokine signalling 3; STAT3, signal transducer and activator of transcription 3; Trim63, tripartite motif containing 63. Created with BioRender.com.

References

    1. Ali NA, O'Brien JM Jr, Hoffmann SP, Phillips G, Garland A, Finley JC, et al. Acquired weakness, handgrip strength, and mortality in critically ill patients. Am J Respir Crit Care Med 2008;178:261–268. - PubMed
    1. Sharshar T, Bastuji‐Garin S, Stevens RD, Durand MC, Malissin I, Rodriguez P, et al. Presence and severity of intensive care unit‐acquired paresis at time of awakening are associated with increased intensive care unit and hospital mortality. Crit Care Med 2009;37:3047–3053. - PubMed
    1. Herridge MS, Tansey CM, Matte A, Tomlinson G, Diaz‐Granados N, Cooper A, et al. Functional disability 5 years after acute respiratory distress syndrome. N Engl J Med 2011;364:1293–1304. - PubMed
    1. Wollersheim T, Woehlecke J, Krebs M, Hamati J, Lodka D, Luther‐Schroeder A, et al. Dynamics of myosin degradation in intensive care unit‐acquired weakness during severe critical illness. Intensive Care Med 2014;40:528–538. - PubMed
    1. Puthucheary ZA, Rawal J, McPhail M, Connolly B, Ratnayake G, Chan P, et al. Acute skeletal muscle wasting in critical illness. JAMA 2013;310:1591–1600. - PubMed

Publication types