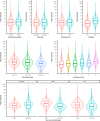
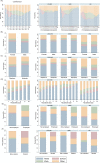
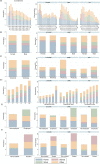
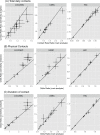
Social contact patterns and implications for infectious disease transmission - a systematic review and meta-analysis of contact surveys
- PMID: 34821551
- PMCID: PMC8765757
- DOI: 10.7554/eLife.70294
Social contact patterns and implications for infectious disease transmission - a systematic review and meta-analysis of contact surveys
Abstract
Background: Transmission of respiratory pathogens such as SARS-CoV-2 depends on patterns of contact and mixing across populations. Understanding this is crucial to predict pathogen spread and the effectiveness of control efforts. Most analyses of contact patterns to date have focused on high-income settings.
Methods: Here, we conduct a systematic review and individual-participant meta-analysis of surveys carried out in low- and middle-income countries and compare patterns of contact in these settings to surveys previously carried out in high-income countries. Using individual-level data from 28,503 participants and 413,069 contacts across 27 surveys, we explored how contact characteristics (number, location, duration, and whether physical) vary across income settings.
Results: Contact rates declined with age in high- and upper-middle-income settings, but not in low-income settings, where adults aged 65+ made similar numbers of contacts as younger individuals and mixed with all age groups. Across all settings, increasing household size was a key determinant of contact frequency and characteristics, with low-income settings characterised by the largest, most intergenerational households. A higher proportion of contacts were made at home in low-income settings, and work/school contacts were more frequent in high-income strata. We also observed contrasting effects of gender across income strata on the frequency, duration, and type of contacts individuals made.
Conclusions: These differences in contact patterns between settings have material consequences for both spread of respiratory pathogens and the effectiveness of different non-pharmaceutical interventions.
Funding: This work is primarily being funded by joint Centre funding from the UK Medical Research Council and DFID (MR/R015600/1).
Keywords: contact surveys; epidemiology; global health; none; pathogen transmission; social contact patterns.
Plain language summary
Infectious diseases, particularly those caused by airborne pathogens like SARS-CoV-2, spread by social contact, and understanding how people mix is critical in controlling outbreaks. To explore these patterns, researchers typically carry out large contact surveys. Participants are asked for personal information (such as gender, age and occupation), as well as details of recent social contacts, usually those that happened in the last 24 hours. This information includes, the age and gender of the contact, where the interaction happened, how long it lasted, and whether it involved physical touch. These kinds of surveys help scientists to predict how infectious diseases might spread. But there is a problem: most of the data come from high-income countries, and there is evidence to suggest that social contact patterns differ between places. Therefore, data from these countries might not be useful for predicting how infections spread in lower-income regions. Here, Mousa et al. have collected and combined data from 27 contact surveys carried out before the COVID-19 pandemic to see how baseline social interactions vary between high- and lower-income settings. The comparison revealed that, in higher-income countries, the number of daily contacts people made decreased with age. But, in lower-income countries, younger and older individuals made similar numbers of contacts and mixed with all age groups. In higher-income countries, more contacts happened at work or school, while in low-income settings, more interactions happened at home and people were also more likely to live in larger, intergenerational households. Mousa et al. also found that gender affected how long contacts lasted and whether they involved physical contact, both of which are key risk factors for transmitting airborne pathogens. These findings can help researchers to predict how infectious diseases might spread in different settings. They can also be used to assess how effective non-medical restrictions, like shielding of the elderly and workplace closures, will be at reducing transmissions in different parts of the world.
Conflict of interest statement
AM, OW, OR, MM, AD, PD, MK, AK, RK, SK, KK, CL, Od, KL, WM, AM, CM, JM, EN, DN, WP, FR, SS, WW, RW, JW, JZ, CW No competing interests declared, PW received funding from WHO and the Asian Development Bank via their institution to investigate COVID19 Vaccine modelling. The author has no other competing interests to declare, MA has received research funding from Seqirus outside the submitted work, CG has received funding from NIH, CDC, AHRQ, FDA, Campbell Alliance/Syneos Health and Sanofi, outside the current work. CGG has also received consulting fees from Pfizer, Merck and Sanofi. The author has no other competing interests to declare, GP was employed by the Emmes Company while analyzing the Niakhar Senegal social contact network data included in this study. The Emmes Company was contracted to perform data cleaning and data analysis of the Niakhar, Senegal clinical trial data (but not the social contact network data) for this study before GEP joined the Emmes Company (in October 2015). After GEP joined the Emmes Company, the sole support from Emmes for this manuscript was in the form of salary support for GEP. GEP also received travel support from Thomas Francis Jr. Travel Fellowship. The author has no other competing interests to declare, JS received travel support for this work from Thomas Francis, Jr. Scholarship Fund. JDS has also received consultancy fees from the International Vaccine Institute, Seoul, Republic of Korea, for work related to studies of typhoid fever burden and vaccine impact. JDS also participates on a Data Safety Monitoring Board for optimising infant immunisation schedules in Uganda & Nepal, University of Oxford, UK (ongoing), PW received consultancy fees from Pfizer for a lecture on statistical inference using infectious disease models and payment or honoraria from IS Global, Barcelona (for a lecture on statistical inference using infectious disease models) and Lancet Global Health (for reviewing an article). The author has no other competing interests to declare
Figures


Update of
-
Social Contact Patterns and Implications for Infectious Disease Transmission: A Systematic Review and Meta-Analysis of Contact Surveys.medRxiv [Preprint]. 2021 Jun 15:2021.06.10.21258720. doi: 10.1101/2021.06.10.21258720. medRxiv. 2021. Update in: Elife. 2021 Nov 25;10:e70294. doi: 10.7554/eLife.70294. PMID: 34159341 Free PMC article. Updated. Preprint.
References
-
- Béraud G, Kazmercziak S, Beutels P, Levy-Bruhl D, Lenne X, Mielcarek N, Yazdanpanah Y, Boëlle PY, Hens N, Dervaux B. The French Connection: The First Large Population-Based Contact Survey in France Relevant for the Spread of Infectious Diseases. PLOS ONE. 2015;10:e0133203. doi: 10.1371/journal.pone.0133203. - DOI - PMC - PubMed
-
- Brauner JM, Mindermann S, Sharma M, Johnston D, Salvatier J, Gavenčiak T, Stephenson AB, Leech G, Altman G, Mikulik V, Norman AJ, Monrad JT, Besiroglu T, Ge H, Hartwick MA, Teh YW, Chindelevitch L, Gal Y, Kulveit J. Inferring the effectiveness of government interventions against COVID-19. Science. 2021;371:eabd9338. doi: 10.1126/science.abd9338. - DOI - PMC - PubMed
Publication types
MeSH terms
Grants and funding
LinkOut - more resources
Full Text Sources
Medical
Miscellaneous

