. 2021 Oct 30;11(11):429.
doi: 10.3390/bios11110429.

Assessment of Brain Functional Activity Using a Miniaturized Head-Mounted Scanning Photoacoustic Imaging System in Awake and Freely Moving Rats

Affiliations

Assessment of Brain Functional Activity Using a Miniaturized Head-Mounted Scanning Photoacoustic Imaging System in Awake and Freely Moving Rats

Yuhling Wang et al. Biosensors (Basel). .

Abstract

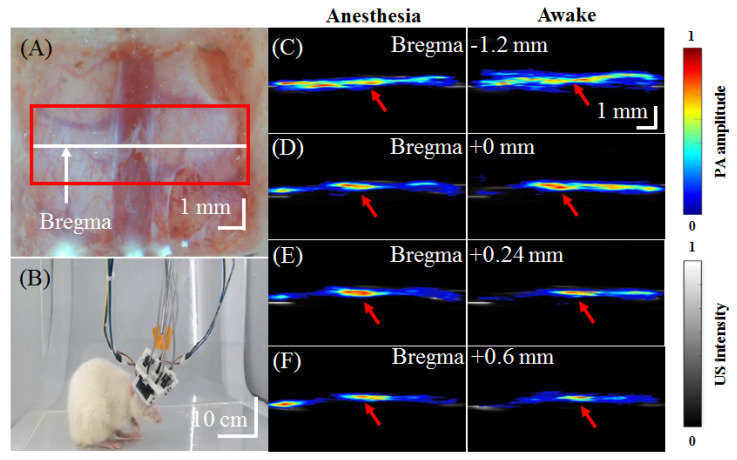
Understanding the relationship between brain function and natural behavior remains a significant challenge in neuroscience because there are very few convincing imaging/recording tools available for the evaluation of awake and freely moving animals. Here, we employed a miniaturized head-mounted scanning photoacoustic imaging (hmPAI) system to image real-time cortical dynamics. A compact photoacoustic (PA) probe based on four in-house optical fiber pads and a single custom-made 48-MHz focused ultrasound transducer was designed to enable focused dark-field PA imaging, and miniature linear motors were included to enable two-dimensional (2D) scanning. The total dimensions and weight of the proposed hmPAI system are only approximately 50 × 64 × 48 mm and 58.7 g (excluding cables). Our ex vivo phantom experimental tests revealed that a spatial resolution of approximately 0.225 mm could be achieved at a depth of 9 mm. Our in vivo results further revealed that the diameters of cortical vessels draining into the superior sagittal sinus (SSS) could be clearly imaged and continuously observed in both anesthetized rats and awake, freely moving rats. Statistical analysis showed that the full width at half maximum (FWHM) of the PA A-line signals (relative to the blood vessel diameter) was significantly increased in the selected SSS-drained cortical vessels of awake rats (0.58 ± 0.17 mm) compared with those of anesthetized rats (0.31 ± 0.09 mm) (p < 0.01, paired t-test). In addition, the number of pixels in PA B-scan images (relative to the cerebral blood volume (CBV)) was also significantly increased in the selected SSS-drained blood vessels of awake rats (107.66 ± 23.02 pixels) compared with those of anesthetized rats (81.99 ± 21.52 pixels) (p < 0.01, paired t-test). This outcome may result from a more active brain in awake rats than in anesthetized rats, which caused cerebral blood vessels to transport more blood to meet the increased nutrient demand of the tissue, resulting in an obvious increase in blood vessel volume. This hmPAI system was further validated for utility in the brains of awake and freely moving rats, showing that their natural behavior was unimpaired during vascular imaging, thereby providing novel opportunities for studies of behavior, cognition, and preclinical models of brain diseases.

Keywords: fiber-bundle-based illumination; freely moving animals; hemoglobin oxygen saturation; in vivo imaging; photoacoustic (PA).


Conflict of interest statement

The authors declare no conflict of interest.

Figures

Figure 1
Figure 1
Diagram of the head-mounted hmPAI system with fiber-bundle-based illumination. First, the laser system provides laser pulses to the optical fiber through the lens, and the optical fiber is connected to the hmPAI device. The hmPAI device is mainly composed of four linear motors and controlled by the developed Arduino system. The holder was made by light-cured 3D printing. In the PC base, we used our own designed interface to control the entire imaging and scanning system.
Figure 2
Figure 2
Diagram of the developed hmPAI system introducing each size, component, and assembly. (A) Holder for the y-axis linear motor. Black arrows indicate the positions of two y-axis motors. (B) Holder for the x-axis linear motor. Black arrows indicate the positions of the x-axis motors. (C) Holder for the 48 MHz transducer and fiber bundles. Black arrows indicate where the fiber bundles and transducer are placed. (D) Cross-sectional view of the hmPAI system after assembly.
Figure 3
Figure 3
Performance tests for the axial and lateral resolutions of the developed hmPAI system using 79 µm carbon fiber and pencil lead phantoms. (A) Photograph of the in vitro carbon fiber phantom imaging experiment setup using the hmPAI system in a water tank. The size of the carbon fiber was approximately 79 µm, as measured by an LED handheld microscope. (B) PA B-scan image and axial resolution tests of the developed Arduino-based scanning system with steps of 0.12 mm at a depth of 9 mm, as quantified using a 79 µm carbon fiber phantom measured by FWHM. The results indicated that the spatial resolution of measurements by the Arduino-based scanning system was approximately 0.225 mm. (C) Performance tests of the developed hmPAI system using two pencil leads to simulate blood vessels at the same depth (i.e., 9 mm). (D) 3D PA image of the two pencil leads at the same depth measured by the developed Arduino-based scanning system (Movie S1 in Supplementary Materials). (E) Performance tests using three pencil leads at imaging depths of 8, 9, and 10 mm with the developed hmPAI system. (F) PA 3D image of three pencil leads at different depths produced by the developed Arduino-based scanning system (Movie S2).
Figure 4
Figure 4
Surgical preparation procedure for the developed hmPAI system for the rat brain. (A) The base plate is used to set screws in the skull. (B) The y-axis motor bracket slides into the base plate through the track. (C) The y-axis motor is set in the y-axis motor holder with four screws. (D) The user checks the window to ensure that the surgical area is visible. (E) The x-axis motor holder is set in the y-axis motor with two screws. (F) The x-axis motor is set in the x-axis motor holder with four screws. (G) The transducer holder is set in the x-axis motor with two screws. (H) Test of the developed hmPAI system with awake rats in an acrylic box.
Figure 5
Figure 5
Schematic diagram of the cross-sectional view of the developed hmPAI system, describing all parts in detail, including the placement of the bracket, optical fiber, probe, x/y-axis motors, and Arduino device and the actual location on the rat. (A) Schematic showing the laser light path and transducer orientation. (B) Photograph of the assembled holder. (C) Photograph of the assembled system with transducer and fiber mounted on the head of a rat.
Figure 6
Figure 6
In vivo PA800 signals from diameter changes in cortical SSS blood vessels at the bregma position from awake and anesthetized rats. (A) Photograph of the rat brain after craniotomy for the addition of the developed hmPAI system. (B) Representative movie depicting awake and freely moving experimental rats wearing the hmPAI system (Movie S3). (C,D) Normalized and FWHM PA800 A-line cortical SSS blood vessel signals at bregma in anesthetized rats (Movie S4). The diameter of cerebral blood vessels in rats under anesthesia was approximately between 0.07 and 0.41 mm. (E,F) Normalized and FWHM PA800 A-line cortical SSS blood vessel signals at bregma in awake rats (Movie S4). In this awake rat study, the diameter of the selected SSS blood vessels of the rat ranged from 0.27 to 0.78 mm.
Figure 7
Figure 7
FWHM values of PA A-line signals in anesthetized (black) and awake (gray) rats. The diameter of the SSS blood vessel was significantly larger in the awake state than in the anesthetized state. This may be due to the continuous activity of awake rats, which caused their brains to be more active. Rat brains need more nutrients when the rats are active; that is, more blood needs to be delivered to the blood vessels in the brain, resulting in significant diameter changes. Error bars represent SD. ** p < 0.01 (Paired t-test, n = 4).
Figure 8
Figure 8
PA B-scan monitoring of the dynamics of the selected SSS blood vessel in anesthetized and awake rats. (A) PA MAP image of the time course of vessel diameter changes in anesthetized rats. The x-axis indicates the PA B-scan image, and the y-axis indicates the scanning time. The scanning time in this representative illustration is 16 min. (BE) PA B-scan cross-sectional images of the target blood vessel at 1, 4, 9, and 14 min of anesthesia. (F,G) Video of the PA B-scan images and the number of pixels in PA B-scan images of anesthetized rats at different time points (16 min in total) (Movie S5). The number of pixels in the PA B-scan images of the measured SSS blood vessel ranged between 45 and 135. (H) PA MAP image of the time course (16 min) of blood vessel diameter changes in awake rats. The x-axis indicates the PA B-scan image, and the y-axis indicates the scanning time. The scanning time in this representative illustration is 16 min. (IL) PA B-scan cross-sectional images of the target SSS blood vessel in an awake rat at 4, 6, 8, and 14 min. (M,N) PA B-scan images and the number of pixels in PA B-scan images of anesthetized and awake rats at different time points (16 min in total) (Movie S5). The number of pixels in the PA B-scan of the measured SSS blood vessel ranged between 58 and 148.
Figure 9
Figure 9
The percent of baseline blood vessel diameter from the PA B-scan image in anesthetized (black) and awake (gray) rats, with the anesthetized state as the baseline. There was a significant difference in the diameter of the blood vessels in the awake state compared to that in the anesthesia state. This result is in agreement with the result observed in the PA A-line. The reason may be that the brain is more active because awake rats exhibit continuous activity; thus, more nutrients must be transported by blood in the cerebral blood vessels, resulting in obviously increased blood vessel volume. Error bars represent SD. * p < 0.05 (Paired t-test, n = 3).
Figure 10
Figure 10
In vivo PA800 B-scan images of the cortical region of the rat brain at the positions of bregma −1.2, 0, +0.24, +0.6 mm in anesthetized and awake rats. (A) Photograph of the rat brain after craniotomy for addition of the hmPAI system. (B) Representative movie depicting awake and freely moving experimental rats equipped with a wearable hmPAI system (Movie S3) for PA B-scan imaging. (CF) PA B-scan images at bregma −1.2, +0, +0.24, and +0.6 mm in anesthetized and awake rats. The experimental results show that the developed hmPAI system can successfully perform PA B-scan imaging at different brain positions.

Similar articles

Cited by

References

    1. Makeig S., Kothe C., Mullen T., Bigdely-Shamlo N., Zhang Z., Kreutz-Delgado K. Evolving Signal Processing for Brain-Computer Interfaces. Proc. IEEE. 2012;100:1567–1584. doi: 10.1109/JPROC.2012.2185009. - DOI
    1. Lance B.J., Kerick S.E., Ries A.J., Oie K.S., McDowell K. Brain-Computer Interface Technologies in the Coming Decades. Proc. IEEE. 2012;100:1585–1599. doi: 10.1109/JPROC.2012.2184830. - DOI
    1. Costecalde T., Aksenova T., Torres-Martinez N., Eliseyev A., Mestais C., Moro C., Benabid A.L. A Long-Term BCI Study with ECoG Recordings in Freely Moving Rats. Neuromodulation. 2018;21:149–159. doi: 10.1111/ner.12628. - DOI - PubMed
    1. Insanally M., Trumpis M., Wang C., Chiang C.H., Woods V., Palopoli-Trojani K., Bossi S., Froemke R.C., Viventi J. A low-cost, multiplexed muECoG system for high-density recordings in freely moving rodents. J. Neural. Eng. 2016;13:026030. doi: 10.1088/1741-2560/13/2/026030. - DOI - PMC - PubMed
    1. Garcia-Cortadella R., Schwesig G., Jeschke C., Illa X., Gray A.L., Savage S., Stamatidou E., Schiessl I., Masvidal-Codina E., Kostarelos K., et al. Graphene active sensor arrays for long-term and wireless mapping of wide frequency band epicortical brain activity. Nat. Commun. 2021;12:211. doi: 10.1038/s41467-020-20546-w. - DOI - PMC - PubMed

LinkOut - more resources